NJ School Performance Report Comparisons for Berkeley Heights, New Providence, Millburn, Westfield, Chatham, Madison and Summit.
The following analysis draws on the newly released New Jersey School Performance Reports for the 2023–2024 school year. It highlights trends in student proficiency across English Language Arts, Math, and Science, while also examining other key indicators such as student growth, chronic absenteeism, and incident rates. The data compares performance across seven districts, offering a look at how outcomes have shifted from pre-pandemic levels (2018–2019) through the most recent year.
English Language Arts
Millburn and New Providence remain top performers in the set, with Millburn fully recovering to pre-pandemic levels (84.9%), and New Providence slightly exceeding its 2018–2019 performance (+0.1%).
Summit, Westfield, and Berkeley Heights continue to trail their pre-COVID performance.
Chatham appears the furthest behind in this area, falling from 82.7% in 2018–2019 to 75.3% in 2023–2024—a 7.4-point decline.

Math
Millburn remains the top-performing district in math with 82.4% of students meeting/exceeding expectations in 2023–2024—only 1.4 points below its 2018–2019 level.
New Providence nearly fully recovered, showing a minimal decline of 0.3 points.
Berkeley Heights is the only district to surpass pre-pandemic math performance, increasing from 68.8% to 70.1%—a +1.3 point gain.
Summit (−4.1), Chatham (−4.8), and Madison (−3.3) experienced the most significant setbacks compared to their 2018–2019 benchmarks.

Science
Millburn remains the set leader in science with 68% of students meeting or exceeding expectations—slightly improved from pre-pandemic levels (+1 point).
New Providence shows the strongest improvement overall, jumping from 54% to 57.3%—a +3.3 point gain.
Berkeley Heights and Madison experienced the largest drop-offs, declining by −4.3 and −3 points, respectively.

7 District Average for ELA, Math & Science
ELA had the highest average performance, rebounding steadily post-2021.
Math dipped in 2021–2022 and peaked in 2022–2023, with a slight decline in 2023–2024.
Science showed the most consistent improvement after a sharp drop in 2021–2022, nearly returning to pre-pandemic levels by 2023–2024.

Student Growth
Measured by Median Student Growth Percentile (mSGP), this report reflects how much progress students made in English Language Arts and Math (grades 4–8), relative to their academic peers.
Growth Benchmark:
-
Low Growth: mSGP < 35
-
Typical Growth: mSGP 35–65
-
High Growth: mSGP > 65
ELA
Summit and Millburn saw the strongest growth since pre-pandemic years, each improving by +6 and +7 points, respectively.
New Providence and Berkeley Heights also posted solid mSGP scores of 58 and 55, both indicating typical to high growth.
Westfield maintained the same growth level as 2018–2019 (mSGP of 49), showing stability.
Madison and Chatham are 8 points and 7 points, behind (respectively) both landing near or below the threshold for low growth.

Math
New Providence maintained its pre-pandemic growth level exactly at an mSGP of 59, showing consistent student progress.
Summit also returned to its 2018–2019 level (mSGP 54), indicating typical growth.
Millburn, Westfield, and Berkeley Heights maintained declines (−2 to −5 points) but remained within the typical growth range.
Madison and Chatham deepen or hold at significant drops in math growth. Madison fell 12.5 points from 2018-2019 to 52.5, and Chatham declined a concerning 16 points, landing at 44, bordering low growth

7 District Average for Student Growth
ELA growth held steady, showing a slight improvement.
Math growth declined noticeably, suggesting a need for renewed focus on post-pandemic math recovery.

Chronic Absenteeism
Westfield is the only district to reduce chronic absenteeism since 2018–2019, dropping from 3.5% to 2.3% (−1.2 percentage points).
Madison shows the highest rate of chronic absenteeism in 2023–2024 at 9.7%, marking a +2.7 point increase—the most significant rise among the districts.
New Providence, Chatham, Berkeley Heights, and Millburn also maintained notable increases from 2018-2019, with chronic absenteeism rates now ranging from 4.9% to 7.4%.

Chronic absenteeism increased overall, rising from an average of 5.2% to 6.5%, with variation by district.

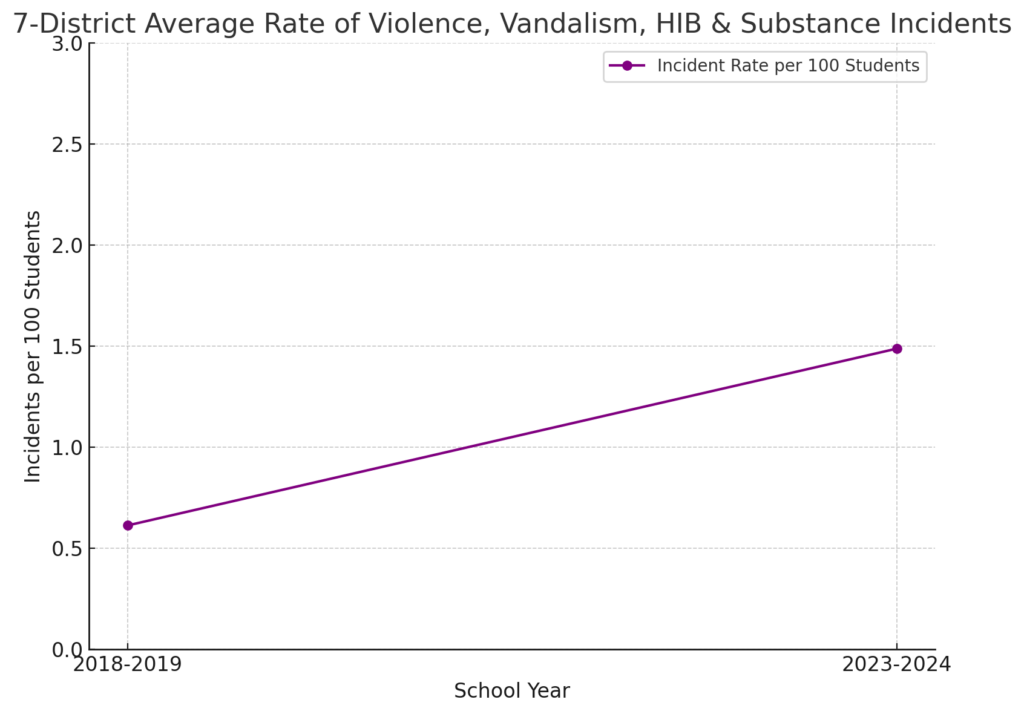
Violence, Vandalism, HIB (Harassment, Intimidation, and Bullying), and Substance Incidents
Summit recorded the highest rate of incidents in 2023–2024 at 2.74 per 100 students, nearly tripling its 2018–2019 rate (+1.93).
Madison also showed a significant spike, rising from 0.91 to 2.18 incidents per 100 (+1.27).
Westfield and New Providence both saw increases of over 1 incident per 100 students, now reporting 1.76 and 1.43, respectively.
Millburn, Chatham, and Berkeley Heights remained relatively stable, with changes of less than ±0.4 from pre-pandemic levels.
Millburn showed a slight improvement (−0.01), the only district to report a decline.

The average incident rate more than doubled, rising from 0.61 to 1.49 incidents per 100 students.

Link to Source Documents from NJ DOE
Read More on Academic Achievement and Proficiency
Subscribe to NJ21st For Free
Our Commitment to Ethical Journalism
|


