2018 through 2024
About a month back, someone on the Scotch Plains forum asked about how the school district is doing academically. I finally had a chance to dig into the data—sorry for the delay, it’s been a busy stretch here.
A few quick notes before getting into it:
There’s no state testing data for the 2019–2020 and 2020–2021 school years. The state paused testing during COVID. Student growth scores also changed during that time, so while you could try to estimate, it’s not really worth it now that we’ve got three solid years (2018–2019, 2022–2023, and 2023–2024) using the same metrics.
Everything below is based on NJ DOE School Performance Data.. It’s important to note that NJ Performance reports are one of the most reliable resources for parents in evaluating a Districts performance. For example, Berkeley Heights reported higher SAT scores than what was indicated on the performance report. We later found out that the source they were using included only their best scores.
Median Student Growth
The state tracks something called “student growth percentiles” (SGPs). It’s basically a measure of how much progress students are making compared to others across the state. It’s grouped into three bands:
- Low Growth: Below 35
- Typical Growth: 35 to 65
- High Growth: Above 65
Median Student Growth tracks groups of Students over a time period.

Scotch Plains-Fanwood’s ELA growth has stayed pretty steady since 2018–2019. Math, on the other hand, has gone down.
Proficiency in ELA, Math and Science
Proficiency tests are different from aptitude tests. These are about how well schools are teaching the material—not how “smart” kids are. They’re a check on whether districts are doing their job.
There’s been a push lately to get rid of these tests, especially as scores dropped across the state after COVID. But they still matter. Without them, there’s no real way for families to know how schools are doing.
Here’s how SPF has done:
- ELA: 78% of students were meeting or exceeding expectations in 2018–2019. That dropped to 70% by 2023–2024.
- Math: 66% to 58%.
- Science: went up slightly, from 39% to 41%.

When we compare this to other towns on our 7-District Dashboard (Berkeley Heights, Chatham, New Providence, Madison, Millburn, Summit, and Westfield), SPF is coming in lower across the board.

Grade-Level Breakdowns
The next few graphs show how each school level is doing:
ELA is broken down by Elementary (Grades 3–5), Middle (Grades 6–8), and High School (Grades 9–12).

Math doesn’t include Algebra I, Geometry, or Algebra II—those are shown separately.

Algebra II scores haven’t been reported at all for SPF since 2018–2019.

College Readiness: Aptitude Test Performance & Four Year Graduation Rates
Unlike state proficiency exams, SAT and ACT tests are less about how a school teaches and more about a student’s individual aptitude and college readiness. It’s important to be cautious when interpreting year-to-year changes, as these scores are best understood in the context of broader averages. Test participation rates and test formats can also vary from year to year, which may affect results.
SAT: English and Math

ACT: Reading, English, Math, Science

Four Year Graduation Rates

Environment
The graph below demonstrate percentage of students categorized as chronically absent and the number of adverse incidents (HIB, Violence, Vandalism) per 100 Students.
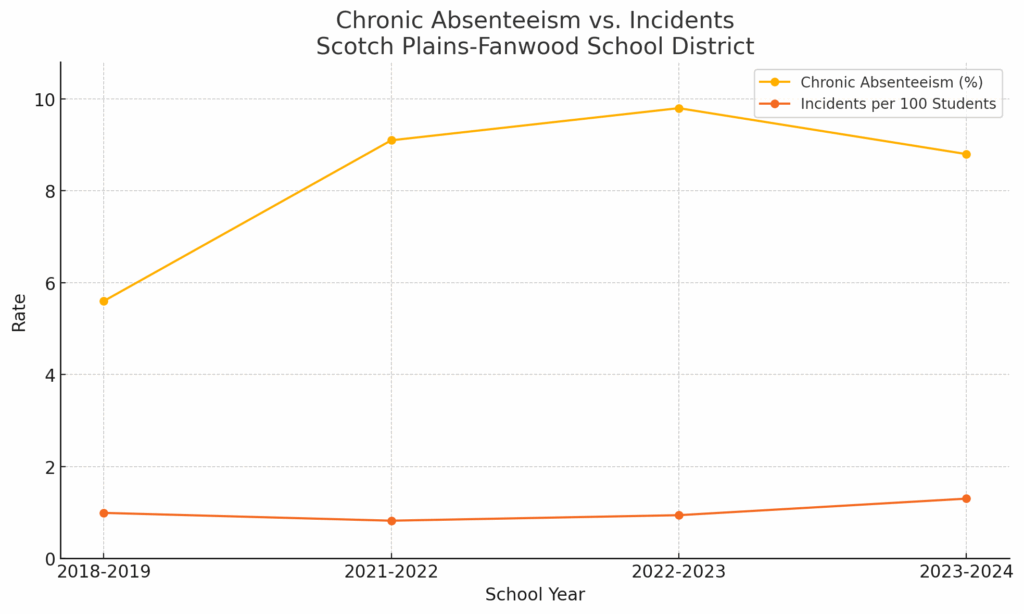
Absenteeism has gone down a little since last year, but it’s still higher than it was in 2018–2019. Meanwhile, incident rates are creeping up again after a dip two years ago.
Read All Articles on Education
Subscribe to nj21st For Free
Our Commitment to Ethical Journalism
|
Related Articles
2026 7-Municipality Budget Analysis
Scotch Plains’ New Budget Explained: Taxes, Spending, and Debt