Beyond the raw figures of New Jersey’s justice system are countless individual lives, each deeply shaped by everything from where they grew up to their racial background.
This report, using the most recent data from March 2025, may be a starting point in understanding how poverty and entrenched inequalities determine who ends up in prison and for how long.
While the charts in this report focus on race, geography, and sentence length, there’s another layer that can’t be ignored: poverty. People from low-income communities are far more likely to be arrested, charged, and sent to prison. Not necessarily because they commit more crimes, but because they often can’t afford bail, can’t hire a private attorney, and don’t have the safety nets that wealthier residents take for granted. And because poverty hits Black and Hispanic communities harder in New Jersey, the racial and economic realities are deeply tied together.
The data set included ~13,000 records – each representing one incarcerated individual.
The average age of the individuals represented is ~40 years.
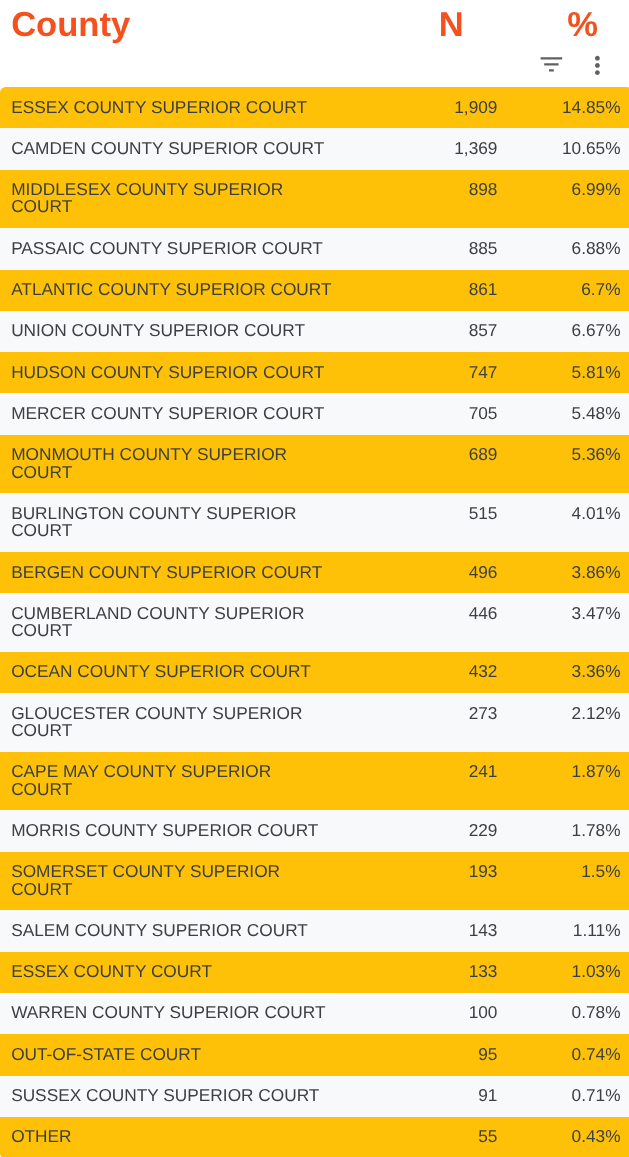
This chart shows which counties sent the most people to state prison. Essex, Camden, and Middlesex top the list. Together, they account for nearly a third of the entire prison population.
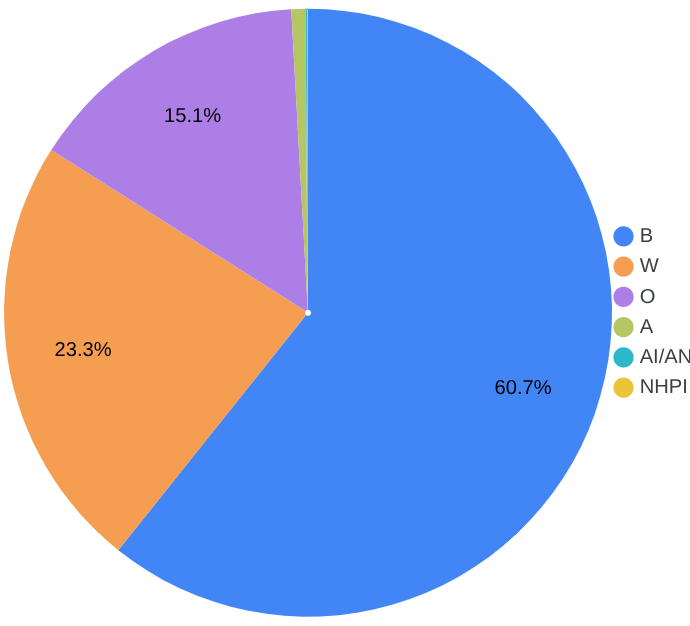
Black individuals make up more than 60% of the state prison population. White individuals account for about 23%, and people listed as “Other” make up another 15%. That “Other” category includes multiracial and unclassified cases.
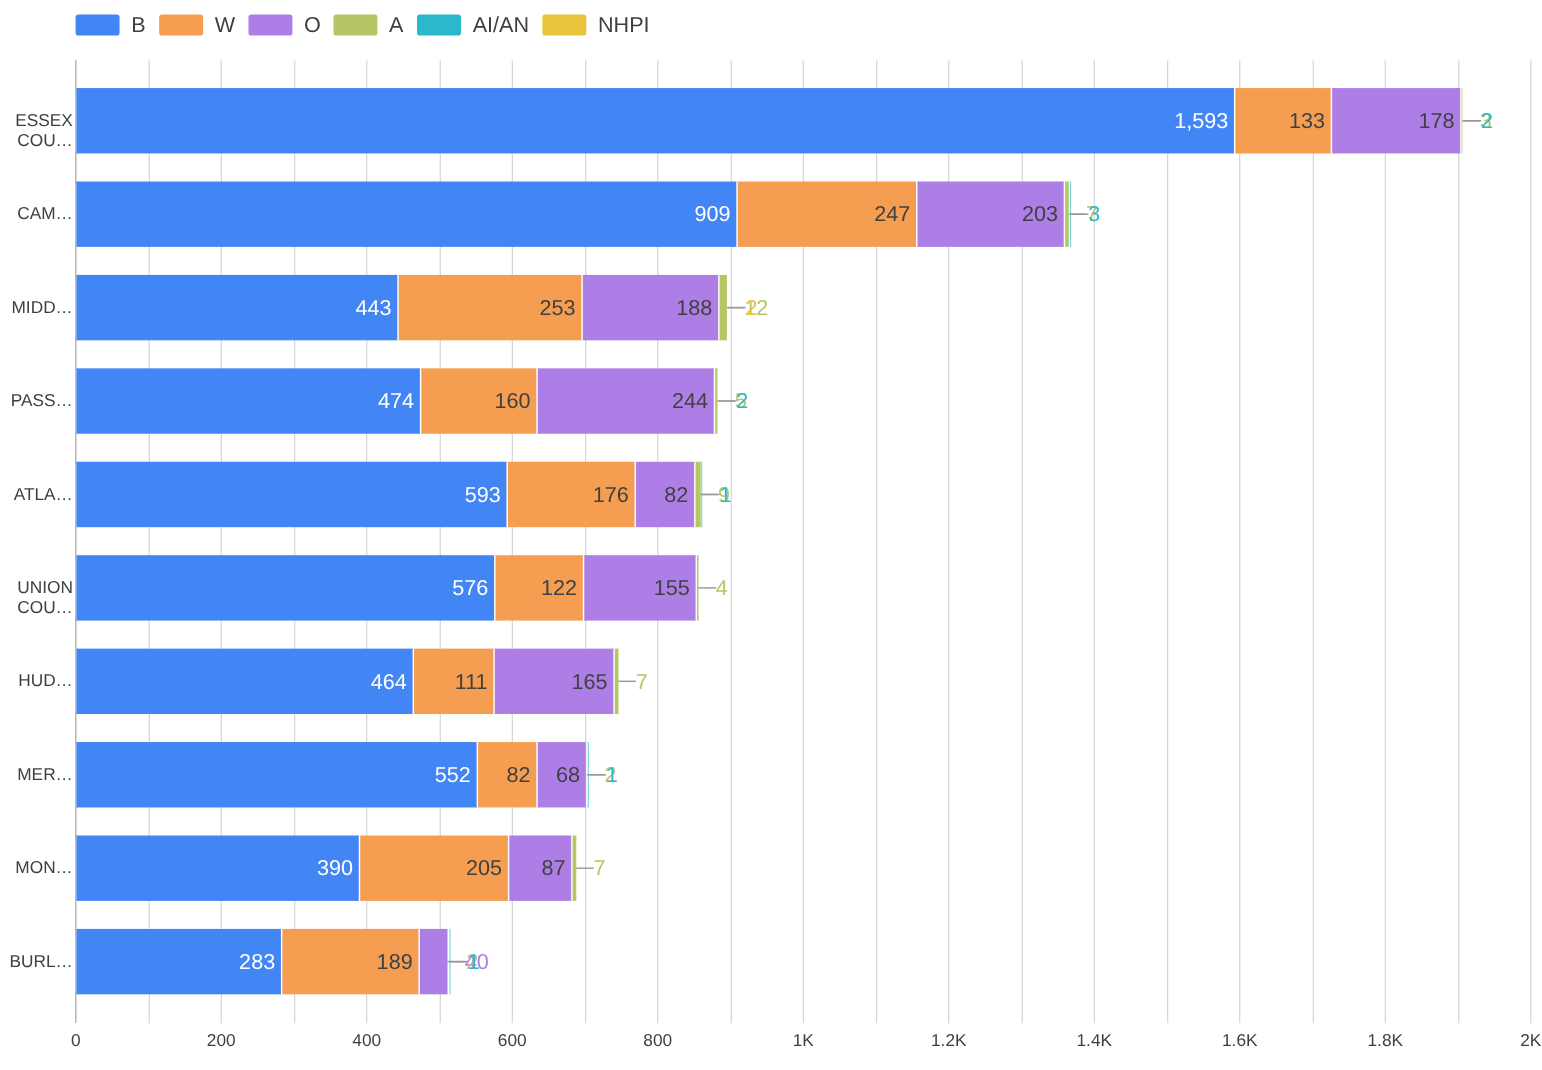
Essex and Camden counties send more people to state prison than any other county- the majority are Black. That lines up, in part, with the makeup of their largest cities. Newark and Camden are majority-Black communities. They are also communities that have faced decades of disinvestment, high poverty rates, and strained public systems. Across the state, Black residents are still over-represented in the prison system, even in counties where they’re a small part of the population.
1/5th of Individuals in the data set were identified as Hispanic.
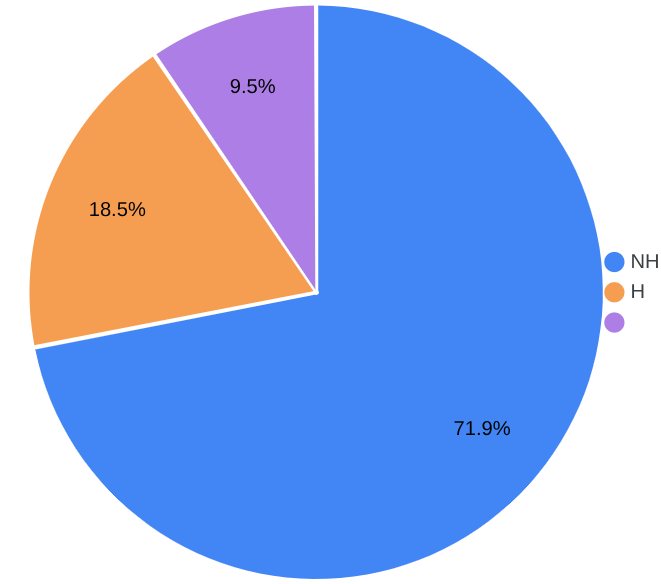
Most people in New Jersey state prisons are classified as non-Hispanic with Hispanic individuals as a stronger presence in Passaic, Camden, and Middlesex.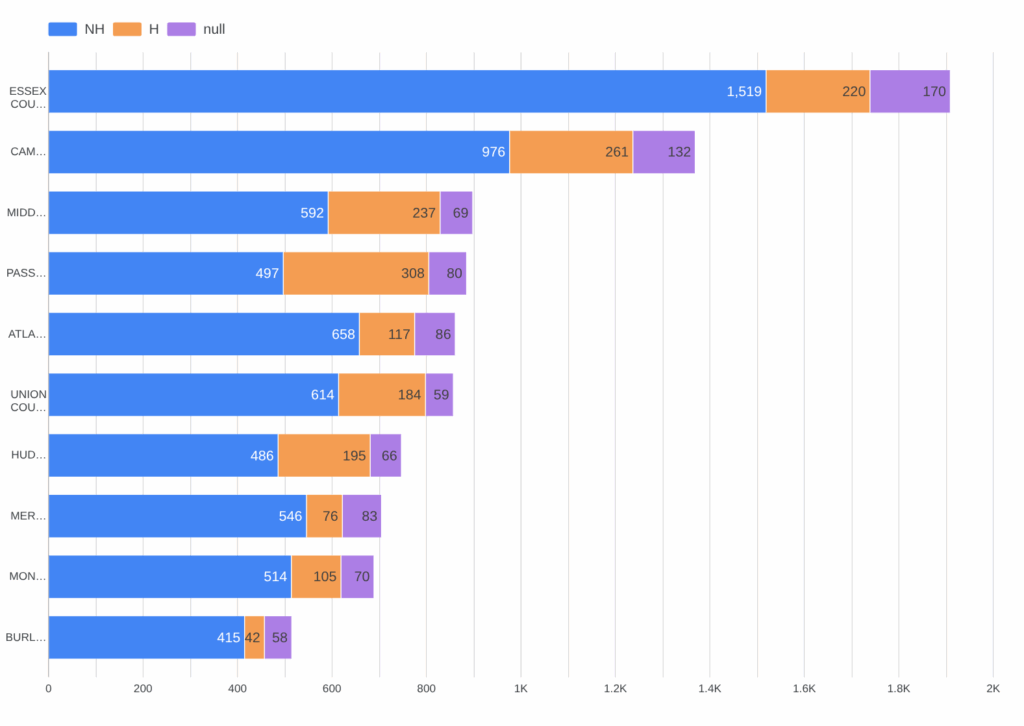
The data records race and ethnicity separately, which is why Hispanic individuals show up across multiple race categories. About 10% of records don’t list ethnicity at all.
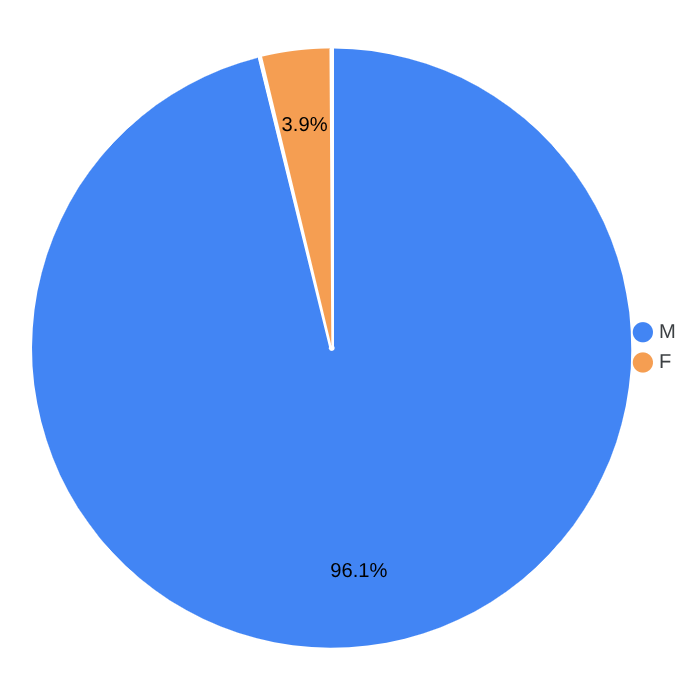
Men make up more than 96% of the prison population. Women account for just under 4%.
Black and White individuals both have a median sentence of 6 years. But when you look at averages, Black individuals are serving longer terms overall—more than 12 years on average. The “Other” and Pacific Islander groups also show long average sentences, though the sample sizes are small and more easily skewed by outliers.

Policy Implications
The data highlights already established disparities, (outsized incarceration of Black residents, link between poverty and sentence length).
The data also supports longstanding calls for reform.
Mandatory minimum sentences often hit certain racial and income groups much harder than others, leading to unfair outcomes.
-Increased support for:
Diversion programs that address root-cause issues while avoiding the societal costs of prison sentences
Restorative justice that works to actually repair the harm versus punishment. This is also consistent with how many Behavioral therapies approach behavior change.
Reentry support which can reduce recidivism and make a persons transition into the community sustainable
Improved transparency/better data infrastructure (standardized, disaggregated reporting on race, sentence length, and admission circumstances).
Data & Methodology
Source
All of the information in this report comes from the New Jersey Department of Corrections’ Incarcerated Persons Census, published in March 2025. The dataset provides a point-in-time snapshot of individuals in state prison and includes details such as race, gender, age, total sentence length, county of admission, and whether a person is identified as Hispanic or not.
Data Preparation
We cleaned and standardized several fields. This included:
- Converting sentence lengths like “3Y 6M” into numeric year values
- Labeling vague entries like “Not Coded” or “Unknown” as missing
- Double-checking that counts aligned across categories such as race and county
- Creating new fields for analysis, such as total sentence length in years
No records were deleted.
Any ambiguous or incomplete information was left as-is but flagged as missing where appropriate.
Analysis
Google BigQuery was used to hold and query the dataset.
Google Studio was used to create the graphs.
Limitations
- About 10% of records don’t include ethnicity.
- The NHPI (Native Hawaiian or Pacific Islander) and AI/AN (American Indian/Alaska Native) groups are very small – averages can be skewed by outliers.
- The “O” (Other) category in race is broad/not well defined. It likely includes multiracial individuals or those not listed in other categories.
- The county field reflects where a person was convicted, not necessarily where they lived or were arrested. That matters when interpreting geographic patterns.
A Quick Guide to the Terms
- “N” = Number of people
- “%” = Percentage of the total state prison population
- Race codes:
- B – Black or African American
- W – White
- O – Other
- A – Asian
- AI/AN – American Indian or Alaska Native
- NHPI – Native Hawaiian or Pacific Islander
- Ethnicity codes:
- H – Hispanic
- NH – Non-Hispanic
- null – Not recorded
See More Special Reports and Resources
Subscribe to NJ21st For Free
Our Commitment to Ethical Journalism
|
