
How Much of Each Per Pupil Dollar Goes to Instruction
This is the second in a series intended to help families better understand how to hold their School District spending student-centered and accountable.
Part One looked at total cost per pupil across our seven dashboard districts using their Annual Comprehensive Financial Reports ACFRs. It showed that per pupil costs rose in every district between 2022 and 2025 even as enrollment declined or remained relatively flat.
In this installment we are going to look at answering one question.
How much of each per pupil dollar is actually going to instruction as these costs rise?
This analysis looks at share instead of raw totals and for each district and year the calculation is pretty straightforward.
Instruction cost per pupil / total cost per pupil
2022 compared with 2025
| District | 2022 | 2025 |
|---|---|---|
| Berkeley Heights | $10,159 | $10,858 |
| Chatham | $8,631 | $10,279 |
| Madison | $8,551 | $9,876 |
| Millburn | $9,432 | $10,573 |
| New Providence | $7,991 | $8,914 |
| Summit | $9,536 | $9,788 |
| Westfield | $8,288 | $9,096 |
| District | 2022 | 2025 |
|---|---|---|
| Berkeley Heights | 38.7% | 34.4% |
| Chatham | 37.0% | 36.2% |
| Madison | 35.9% | 34.1% |
| Millburn | 37.5% | 35.0% |
| New Providence | 36.5% | 35.0% |
| Summit | 39.4% | 38.0% |
| Westfield | 33.5% | 33.4% |
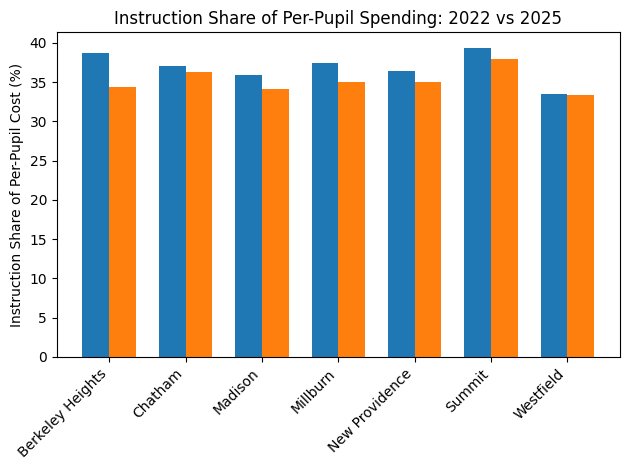
Across all seven districts:
-Instruction makes up ~ 1/3 to just under 2/5 of per-pupil spending
-In every district the instruction share in 2025 is flat or lower than it was in 2022
-Declining enrollment and rising per-pupil costs did not translate into a higher instructional share
Berkeley Heights saw a noticeable decline in instruction’s share of the per-pupil dollar between 2022 and 2025 despite rising total costs.
Millburn and New Providence show stability even as total per-pupil spending increased.
Summit devotes the largest share of its per-pupil spending to instruction in both years -although it's still a modest increase.
Westfield consistently allocates the smallest per pupil share to instruction.
Now ...this is not the whole story.
The ACFR includes school-sponsored athletics within the “Instruction” category which means that instructional spending doesn't just include teaching and academic support but also the costs of athletic programs.
The result?
Athletics inflates the instructional totals we see on the ACFR.
When we adjust for athletics we get a clearer picture of how much of each dollar is actually supporting teaching and learning.
| District | Instruction Share Excluding Athletics 2025 |
|---|---|
| Summit | 36.8% |
| Chatham | 34.8% |
| Millburn | 34.2% |
| New Providence | 33.4% |
| Madison | 32.8% |
| Berkeley Heights | 32.7% |
| Westfield | 32.4% |
In Berkeley Heights athletics growth exceeded total instruction growth, meaning non-athletics instruction declined over the period while in most districts, instruction growth was driven primarily by non-athletic spending.
| District | Total Instruction Change 2023–2025 |
Athletics Change 2023–2025 |
Non-Athletics Instruction Change |
|---|---|---|---|
| Berkeley Heights | $45,694 | $81,699 | -$36,005 |
| Chatham | $2,627,152 | $414,451 | $2,212,701 |
| Madison | $1,297,649 | $9,408 | $1,288,241 |
| Millburn | $3,007,903 | -$2,285 | $3,010,188 |
| New Providence | $1,193,069 | $93,736 | $1,099,333 |
| Summit | $2,590,580 | $50,586 | $2,539,994 |
| Westfield | $4,870,590 | $73,410 | $4,797,180 |
In the graph below
-The bars (orange and blue combined) show total instruction growth from 2023 to 2025 with the dots representing net total instructional growth.
-The blue portion of the bars show the non-athletics instruction portion.
-The orange portion of the bars represents athletics spending growth only.
-The numbers on the Y Axis represents the amount of Total Instruction Growth in Millions (5 = 5 Million)
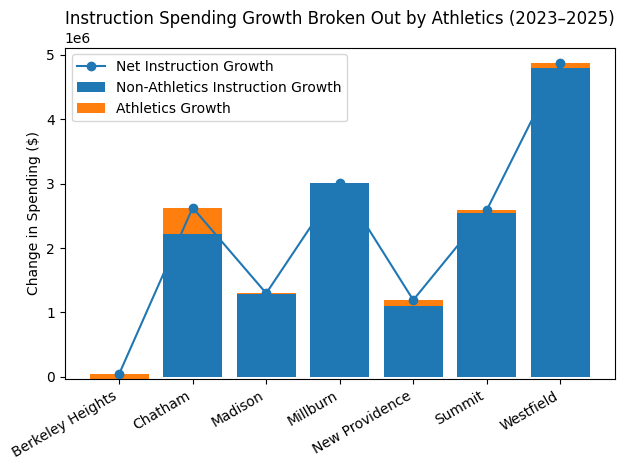
So, using Berkeley Heights as an example....
Total instructional spending for that District increased slightly between 2023 and 2025 (+47k).
But....athletics grew by more than the district’s overall instructional increase during the same period. (+82k)
As a result, when athletics growth is isolated, it accounts for more than 100 percent of the net growth in instruction. (82k/47k=1.744-> 174.4%) comparing 2023 to 2025.
This means that, in Berkeley Heights (according to the numbers in the ACFR), the already modest increase in instruction spending was fully absorbed by rising athletics costs.
On the other hand, while Westfield initially shows a lower investment in Instructional spending a greater portion of its allocation goes directly to the classroom when we look at how that spending is actually broken out.
This example illustrates the importance of digging beyond just the general category totals in the ACFR to look at how spending is distributed within the category.
Here is Spreadsheet with Raw Data
You can review the source documentation here.
Reference: DOE ACFR Page
Part of the NJ21st ACFR Series
This article is part of an ongoing NJ21st series using audited financial reports (ACFRs) to examine how school districts actually spend public dollars and what those choices mean for students.
View the full ACFR series →
|
Related Articles

The $333 Million Hole: Why NJ School Health Premiums are Set to Explode

NJ WARN On Track for 4-Year High: BH & Madison on the 2026 Lay-Off Radar