Budgets are typically not something that draws big numbers, but we’re working hard to change that. Two of our top articles for 2025 connected to a source of confusion and intimidation – school budgets. The articles didn’t draw because they were sensational but because they slowed the discussion down and broke down financial information that budget presentations often speed through and gloss over with little to no context or comparison.
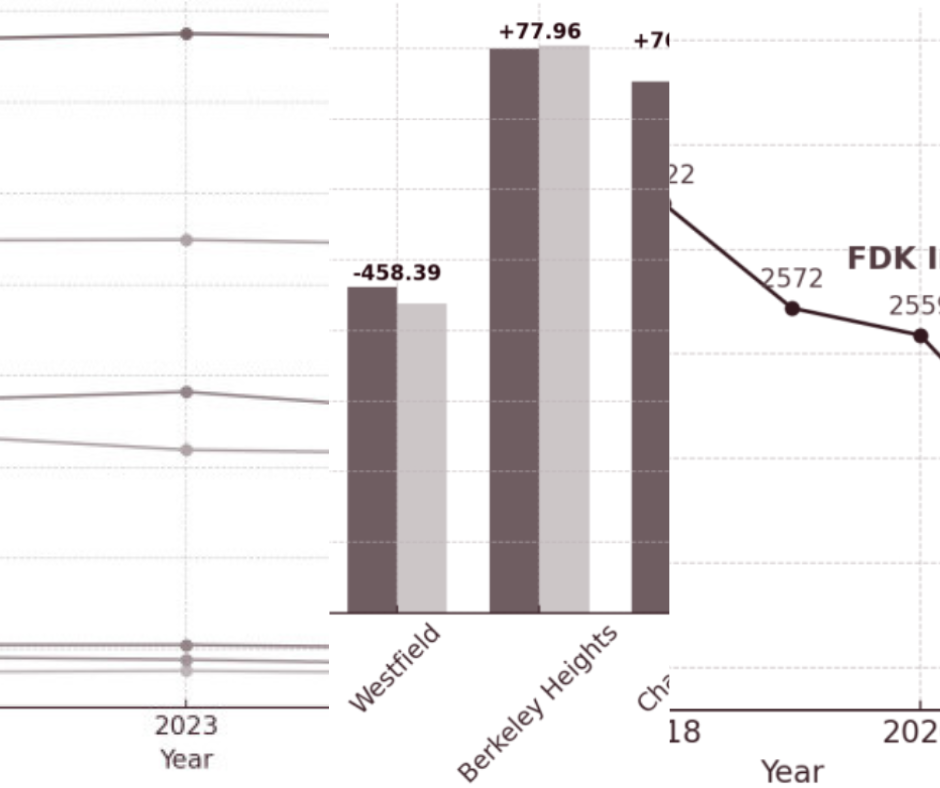
Our highest ranking budget article of the year was the first in a series that walked folks through screen shots of our 7-District budget dashboard – using last year’s ACFR. These visuals provided a starting point for residents to begin more informed inquiries into their District’s budget.
#6 – Breaking Down the 2025 7-District Budget Dashboard with Images (Part One)
This year we are slowing the process down even further by adding more depth and context to the ACFR data – walking readers through not just the comparisons but how to interpret the ACFR itself..
Closely behind was our coverage of the proposed 2025–26 state aid figures which presented aid totals for our Dashboard schools in a side by side format – allowing readers to see how allocations compared across the region. In addition to presenting the proposed numbers, the article went further in explaining how they lined up with historical patterns.
#21 – 7-District Dashboard: Proposed 2025 State Aid Numbers Come Out
These articles continued our traditional framing – budgets are documents, not headlines.
By showing how budgets and aid figures actually work, NJ21st’s coverage created opportunities for parents and students to ask better questions before numbers were finalized and votes were taken.
The emphasis on clarity over conclusions is likely why these articles stood out among the most read articles of the year.
Catch up on the full year-end series
All parts of the series are collected in one place, with links to the reporting referenced in each installment.
View the series page
|
Related Articles
Berkeley Heights 2026 Budget Proposed at $35M: Here is Where the Money is Going

Legal But Opaque Part 2: A Case Study of the Berkeley Heights Recreation Hire