We have spent the better part of budget season looking at School Budgets – this coming week we will take a look at the municipal side.
Just like the ACFR for School Districts, Municipal ACFR’s are a record of what was spent and serve as a much better source of understanding how a Town or City uses tax dollars than a budget – which often changes and, in some towns, is mutilated by the time December rolls around.
We used the most recent ACFR Data for seven towns (Berkeley Heights, Cranford, Mountainside, New Providence, Scotch Plains, Summit and Westfield) census data to arrive at a Municipal Efficiency Score.
We arrived at this score/ranking by comparing how much each town spent per household across 17 major municipal cost areas pulled from the A-3 statements in the 2024 ACFRs.
For each category, the town with the lowest cost per household was ranked 1 and the highest was ranked 7. Those category ranks were then averaged to create a final efficiency score.
Lower scores reflect a leaner overall spending structure.
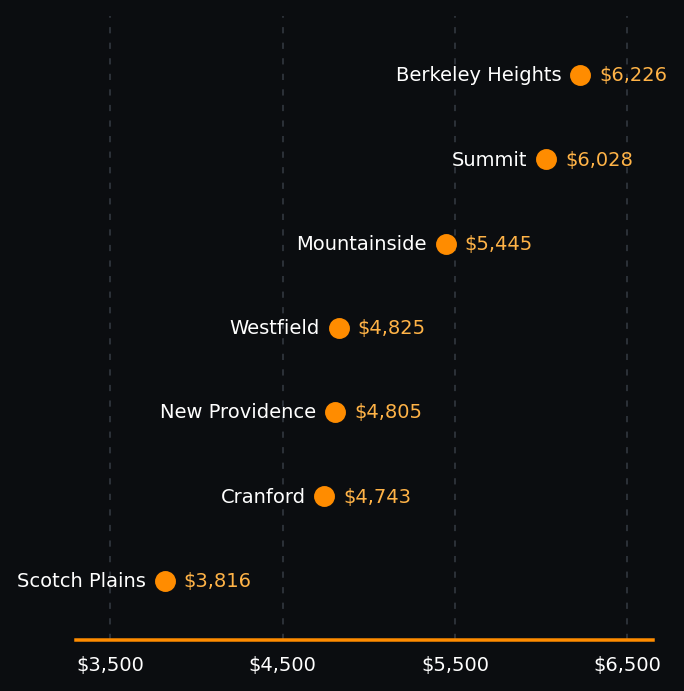
The list below shows each town’s final score, followed by its rank, per-household cost, and total spending in each major area.
Municipal Efficiency Rankings
2024 per-household spending ranked across core categories. Rank 1 is the most efficient (lowest cost). EMS is marked N/A where no source-table value was provided.
Scotch Plains
Efficiency Score: 2.53
| Police | 5 | $840.49 |
| Fire | 4 | $75.42 |
| EMS | 4 | $78.97 |
| Emergency | 2 | $3.73 |
| Admin | 2 | $187.24 |
| Court | 1 | $23.14 |
| Legal | 5 | $41.75 |
| Insurance | 2 | $379.23 |
| Pension | 1 | $380.27 |
| Utilities | 2 | $98.08 |
| Public Works | 1 | $331.32 |
| Recreation | 6 | $221.23 |
| Health | 1 | $0.76 |
| Debt | 1 | $288.18 |
| Capital | 1 | $18.74 |
| Total Operating | 1 | $3,509.14 |
| Total Spending | 1 | $3,816.06 |
Cranford
Efficiency Score: 3.69
| Police | 3 | $791.91 |
| Fire | 6 | $499.29 |
| EMS | — | N/A |
| Emergency | 6 | $50.16 |
| Admin | 3 | $189.36 |
| Court | 2 | $30.95 |
| Legal | 6 | $48.75 |
| Insurance | 6 | $637.22 |
| Pension | 4 | $512.35 |
| Utilities | 1 | $51.84 |
| Public Works | 2 | $410.80 |
| Recreation | 3 | $61.91 |
| Health | 5 | $35.89 |
| Debt | 5 | $541.70 |
| Capital | 2 | $21.22 |
| Total Operating | 3 | $4,179.78 |
| Total Spending | 2 | $4,742.69 |
Westfield
Efficiency Score: 3.65
| Police | 1 | $763.42 |
| Fire | 5 | $412.63 |
| EMS | 1 | $0.00 |
| Emergency | 7 | $54.08 |
| Admin | 1 | $173.76 |
| Court | 4 | $38.70 |
| Legal | 2 | $35.60 |
| Insurance | 5 | $628.42 |
| Pension | 5 | $536.64 |
| Utilities | 3 | $160.63 |
| Public Works | 5 | $560.54 |
| Recreation | 2 | $42.62 |
| Health | 7 | $80.85 |
| Debt | 2 | $306.03 |
| Capital | 4 | $67.43 |
| Total Operating | 4 | $4,451.86 |
| Total Spending | 4 | $4,825.32 |
New Providence
Efficiency Score: 3.88
| Police | 6 | $850.84 |
| Fire | 1 | $35.98 |
| EMS | — | N/A |
| Emergency | 1 | $1.09 |
| Admin | 6 | $283.06 |
| Court | 7 | $83.49 |
| Legal | 1 | $13.21 |
| Insurance | 1 | $369.91 |
| Pension | 3 | $464.31 |
| Utilities | 6 | $203.38 |
| Public Works | 7 | $621.37 |
| Recreation | 4 | $122.21 |
| Health | 4 | $29.67 |
| Debt | 4 | $535.26 |
| Capital | 6 | $178.27 |
| Total Operating | 2 | $4,091.94 |
| Total Spending | 3 | $4,805.46 |
Berkeley Heights
Efficiency Score: 4.47
| Police | 4 | $839.78 |
| Fire | 2 | $41.14 |
| EMS | 3 | $22.26 |
| Emergency | 4 | $32.39 |
| Admin | 5 | $264.18 |
| Court | 3 | $31.48 |
| Legal | 4 | $41.19 |
| Insurance | 7 | $705.83 |
| Pension | 2 | $463.72 |
| Utilities | 7 | $256.32 |
| Public Works | 3 | $445.99 |
| Recreation | 1 | $39.41 |
| Health | 2 | $14.09 |
| Debt | 7 | $962.04 |
| Capital | 7 | $484.97 |
| Total Operating | 5 | $4,779.23 |
| Total Spending | 7 | $6,226.24 |
Summit
Efficiency Score: 5.06
| Police | 2 | $770.71 |
| Fire | 7 | $520.40 |
| EMS | — | N/A |
| Emergency | 5 | $34.16 |
| Admin | 4 | $260.11 |
| Court | 5 | $39.30 |
| Legal | 3 | $37.09 |
| Insurance | 3 | $489.85 |
| Pension | 7 | $663.75 |
| Utilities | 4 | $168.58 |
| Public Works | 6 | $591.13 |
| Recreation | 7 | $330.15 |
| Health | 6 | $61.46 |
| Debt | 6 | $786.51 |
| Capital | 3 | $24.58 |
| Total Operating | 7 | $5,216.45 |
| Total Spending | 6 | $6,027.54 |
Mountainside
Efficiency Score: 4.94
| Police | 7 | $1,353.38 |
| Fire | 3 | $59.64 |
| EMS | 2 | $13.96 |
| Emergency | 3 | $17.46 |
| Admin | 7 | $354.09 |
| Court | 6 | $77.89 |
| Legal | 7 | $133.77 |
| Insurance | 4 | $542.78 |
| Pension | 6 | $579.89 |
| Utilities | 5 | $180.75 |
| Public Works | 4 | $479.85 |
| Recreation | 5 | $217.88 |
| Health | 3 | $26.33 |
| Debt | 3 | $426.85 |
| Capital | 5 | $153.96 |
| Total Operating | 6 | $4,864.35 |
| Total Spending | 5 | $5,445.16 |
As with the 7-District Budget Dashboard, we’ll provide further analysis as the week goes on.
|
Related Articles

Millburn School Budget: The Price Tag Is High, The Results Are Real

Inside the March 24 New Providence Agenda: Housing Strategy, Budgets, and Infrastructure
