The following snapshots use Berkeley Heights as a case study in how the ACFR can be used by families and students in holding their District Budgets Accountable to Student Learning.
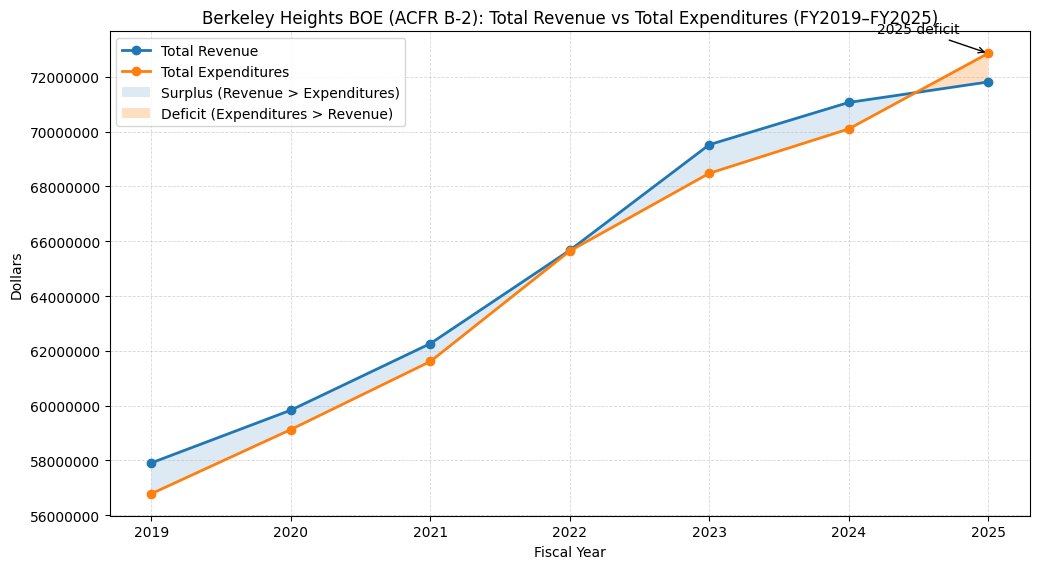
From 2019–2024 Berkeley Heights ran small annual surpluses, but in 2025 spending finally outpaced revenue, flipping the year to a $1.05M deficit. (b2-acfr)
This tipping point comes after years of residents raising concerns about discretionary spending and after a reconfiguration plan that expanded facilities needs even as enrollment declined, rather than using that moment to streamline and consider broader grade configurations that research suggests can support academic success.
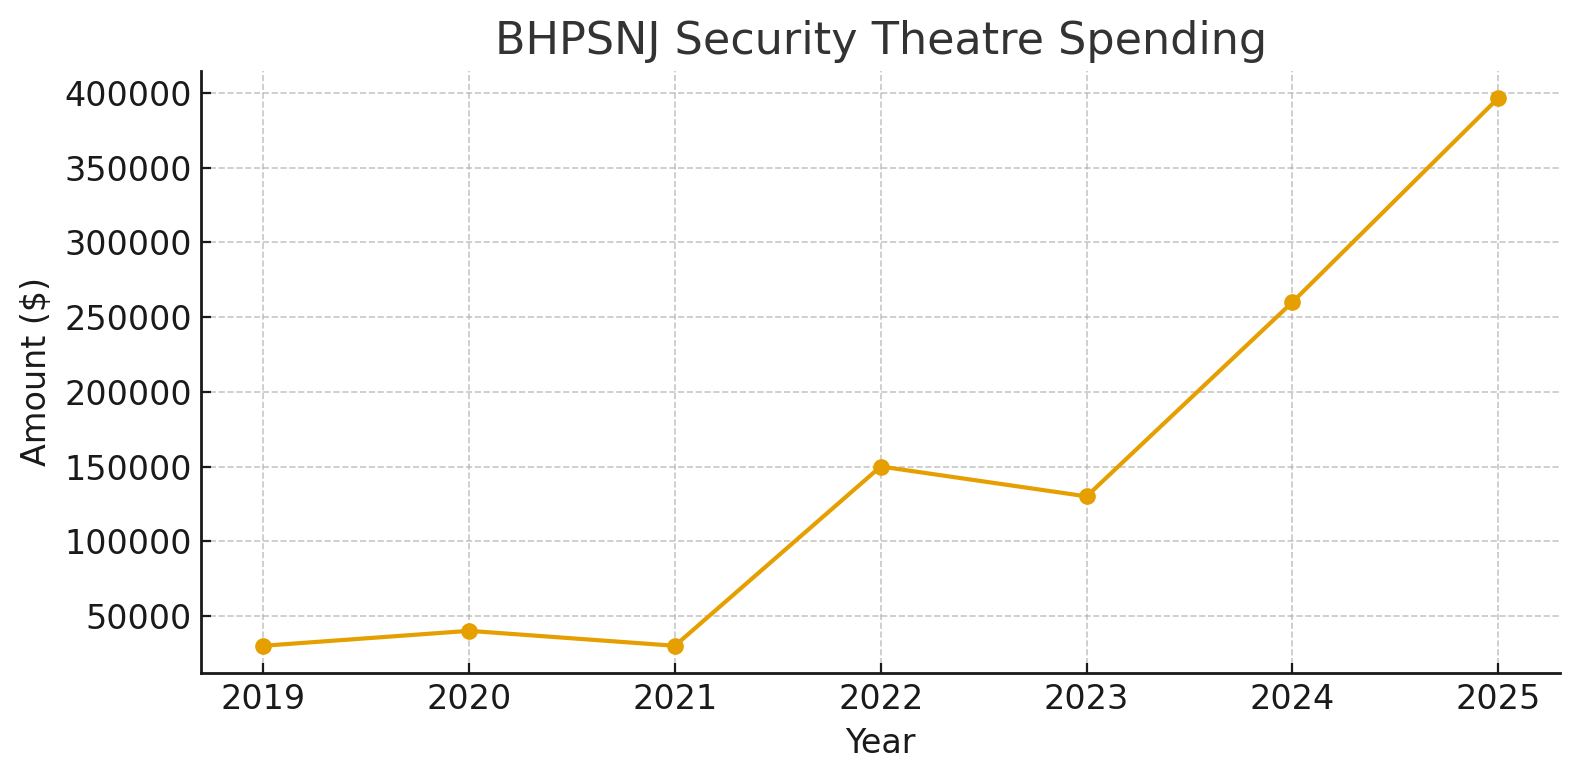
It also occurs where Security Spending reached 400k and spending in Athletics outpaced non-athletic Instruction.
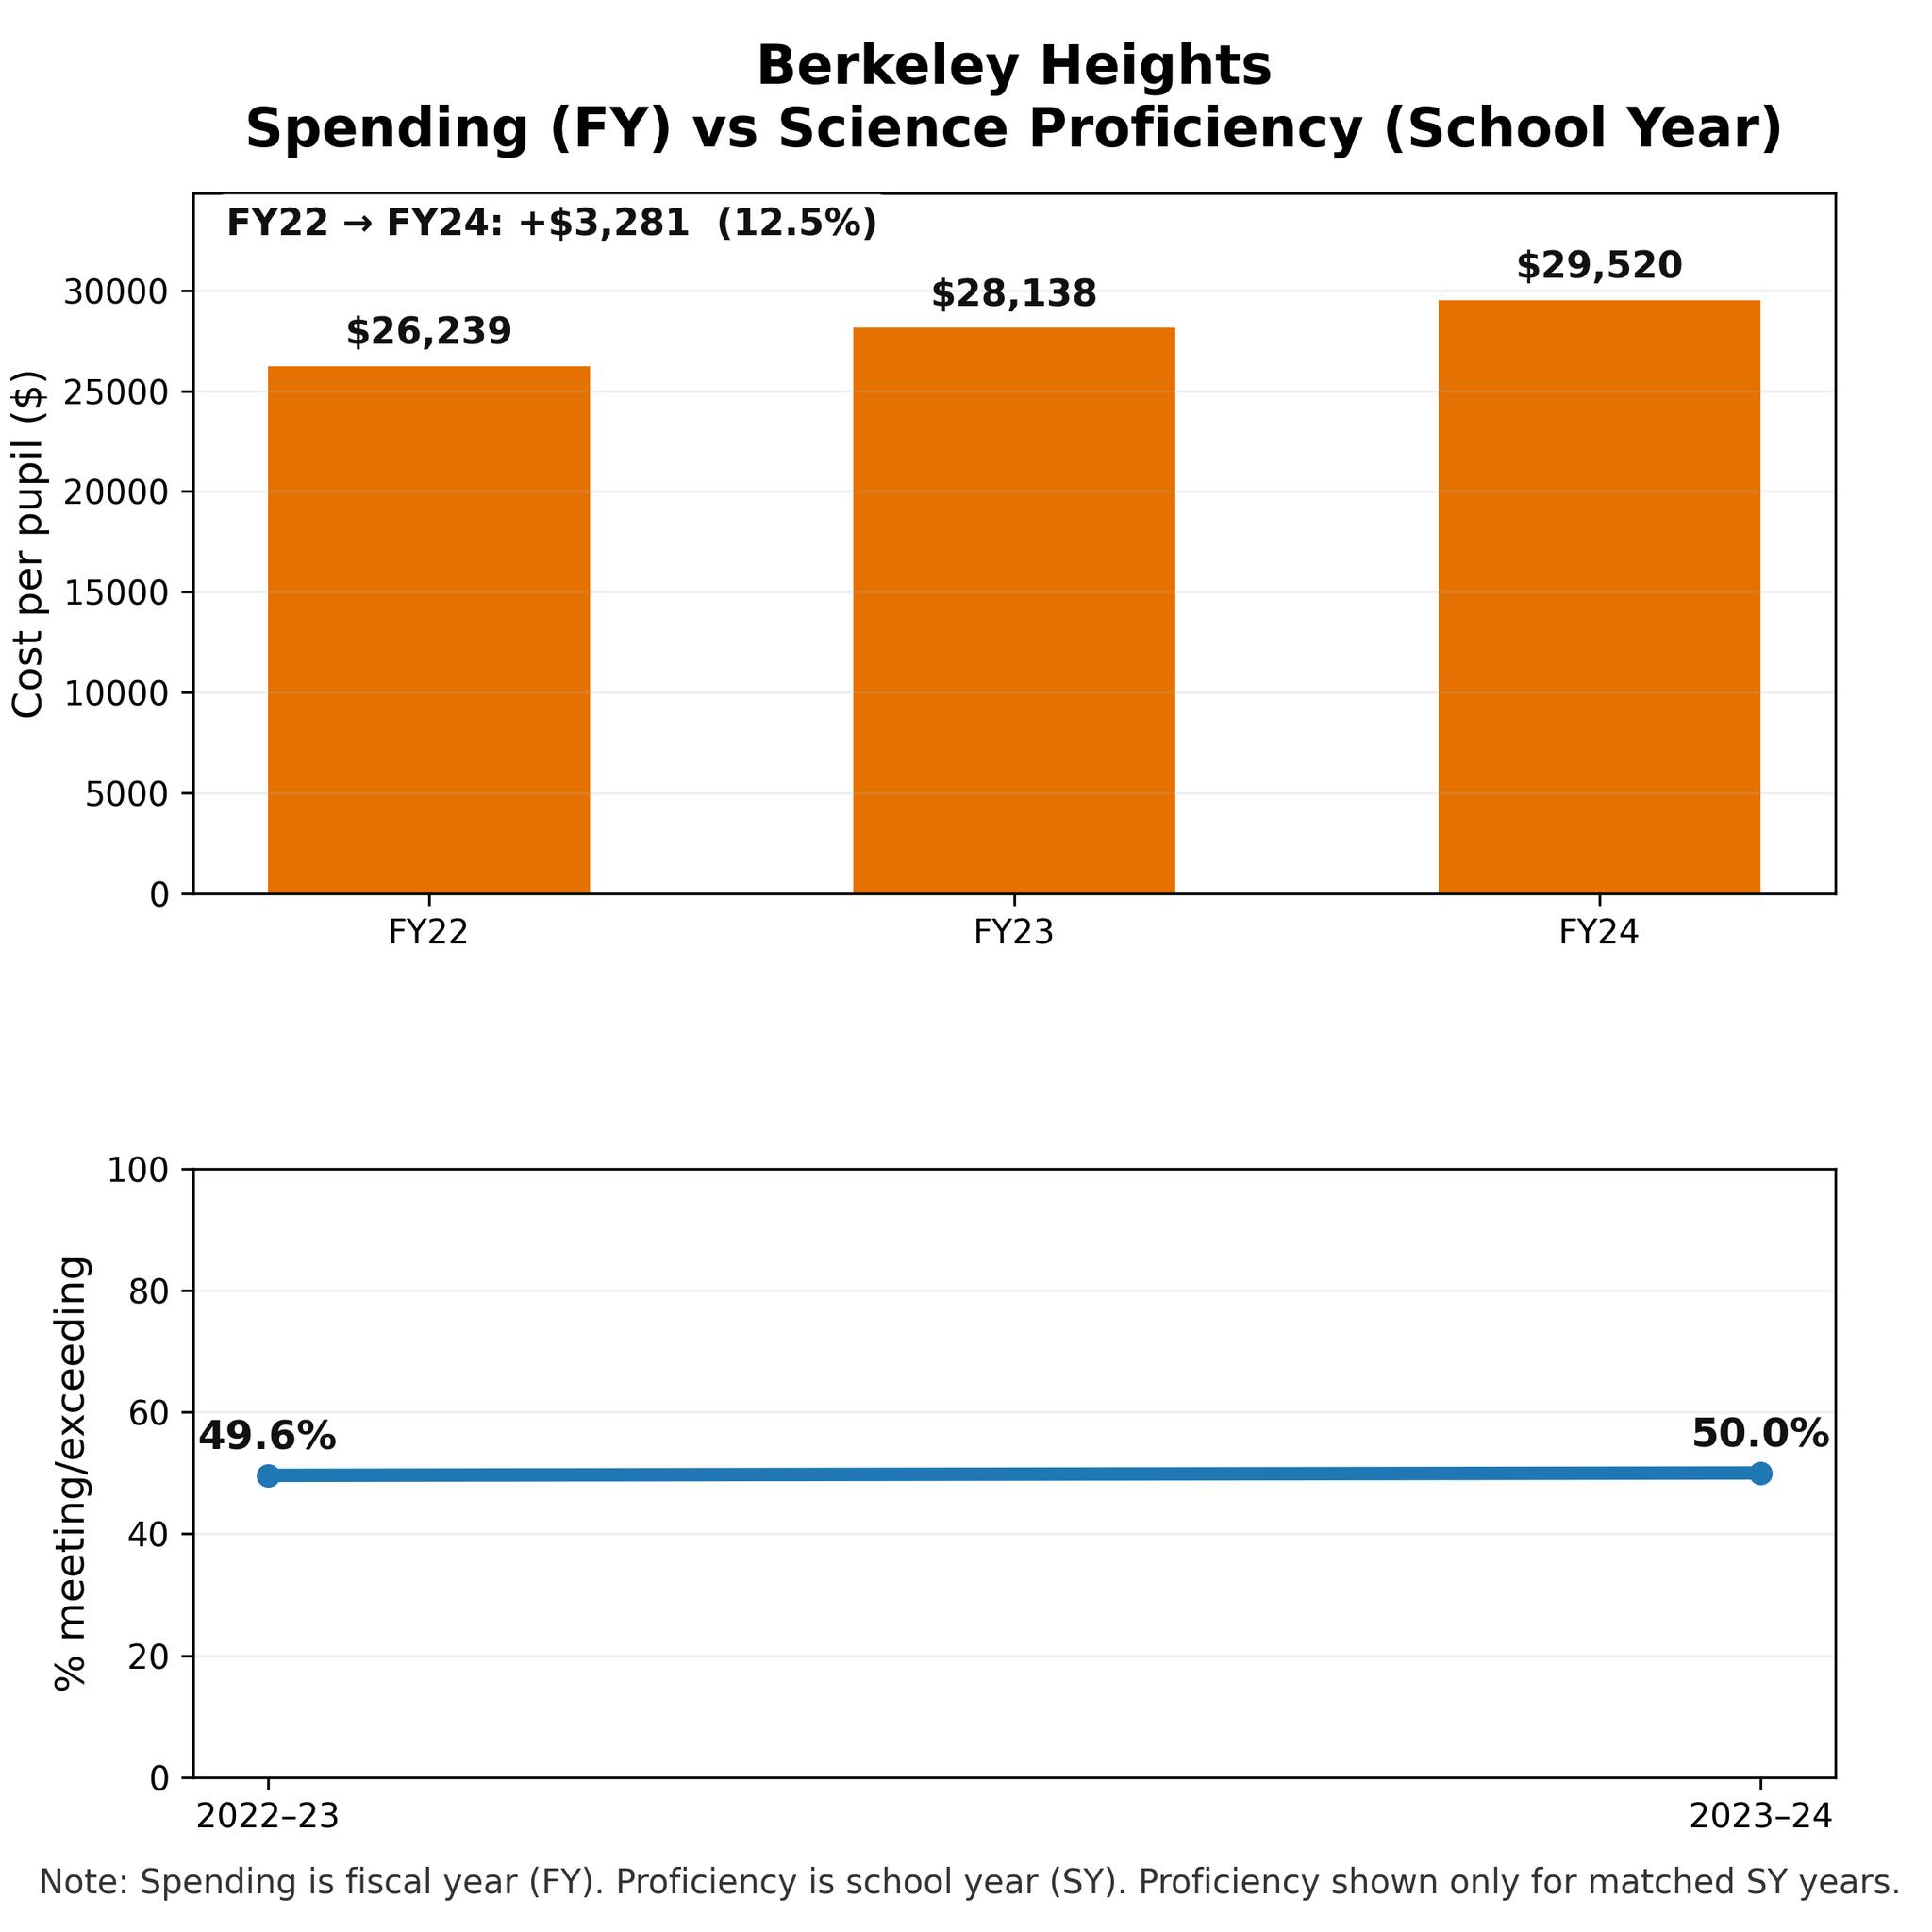
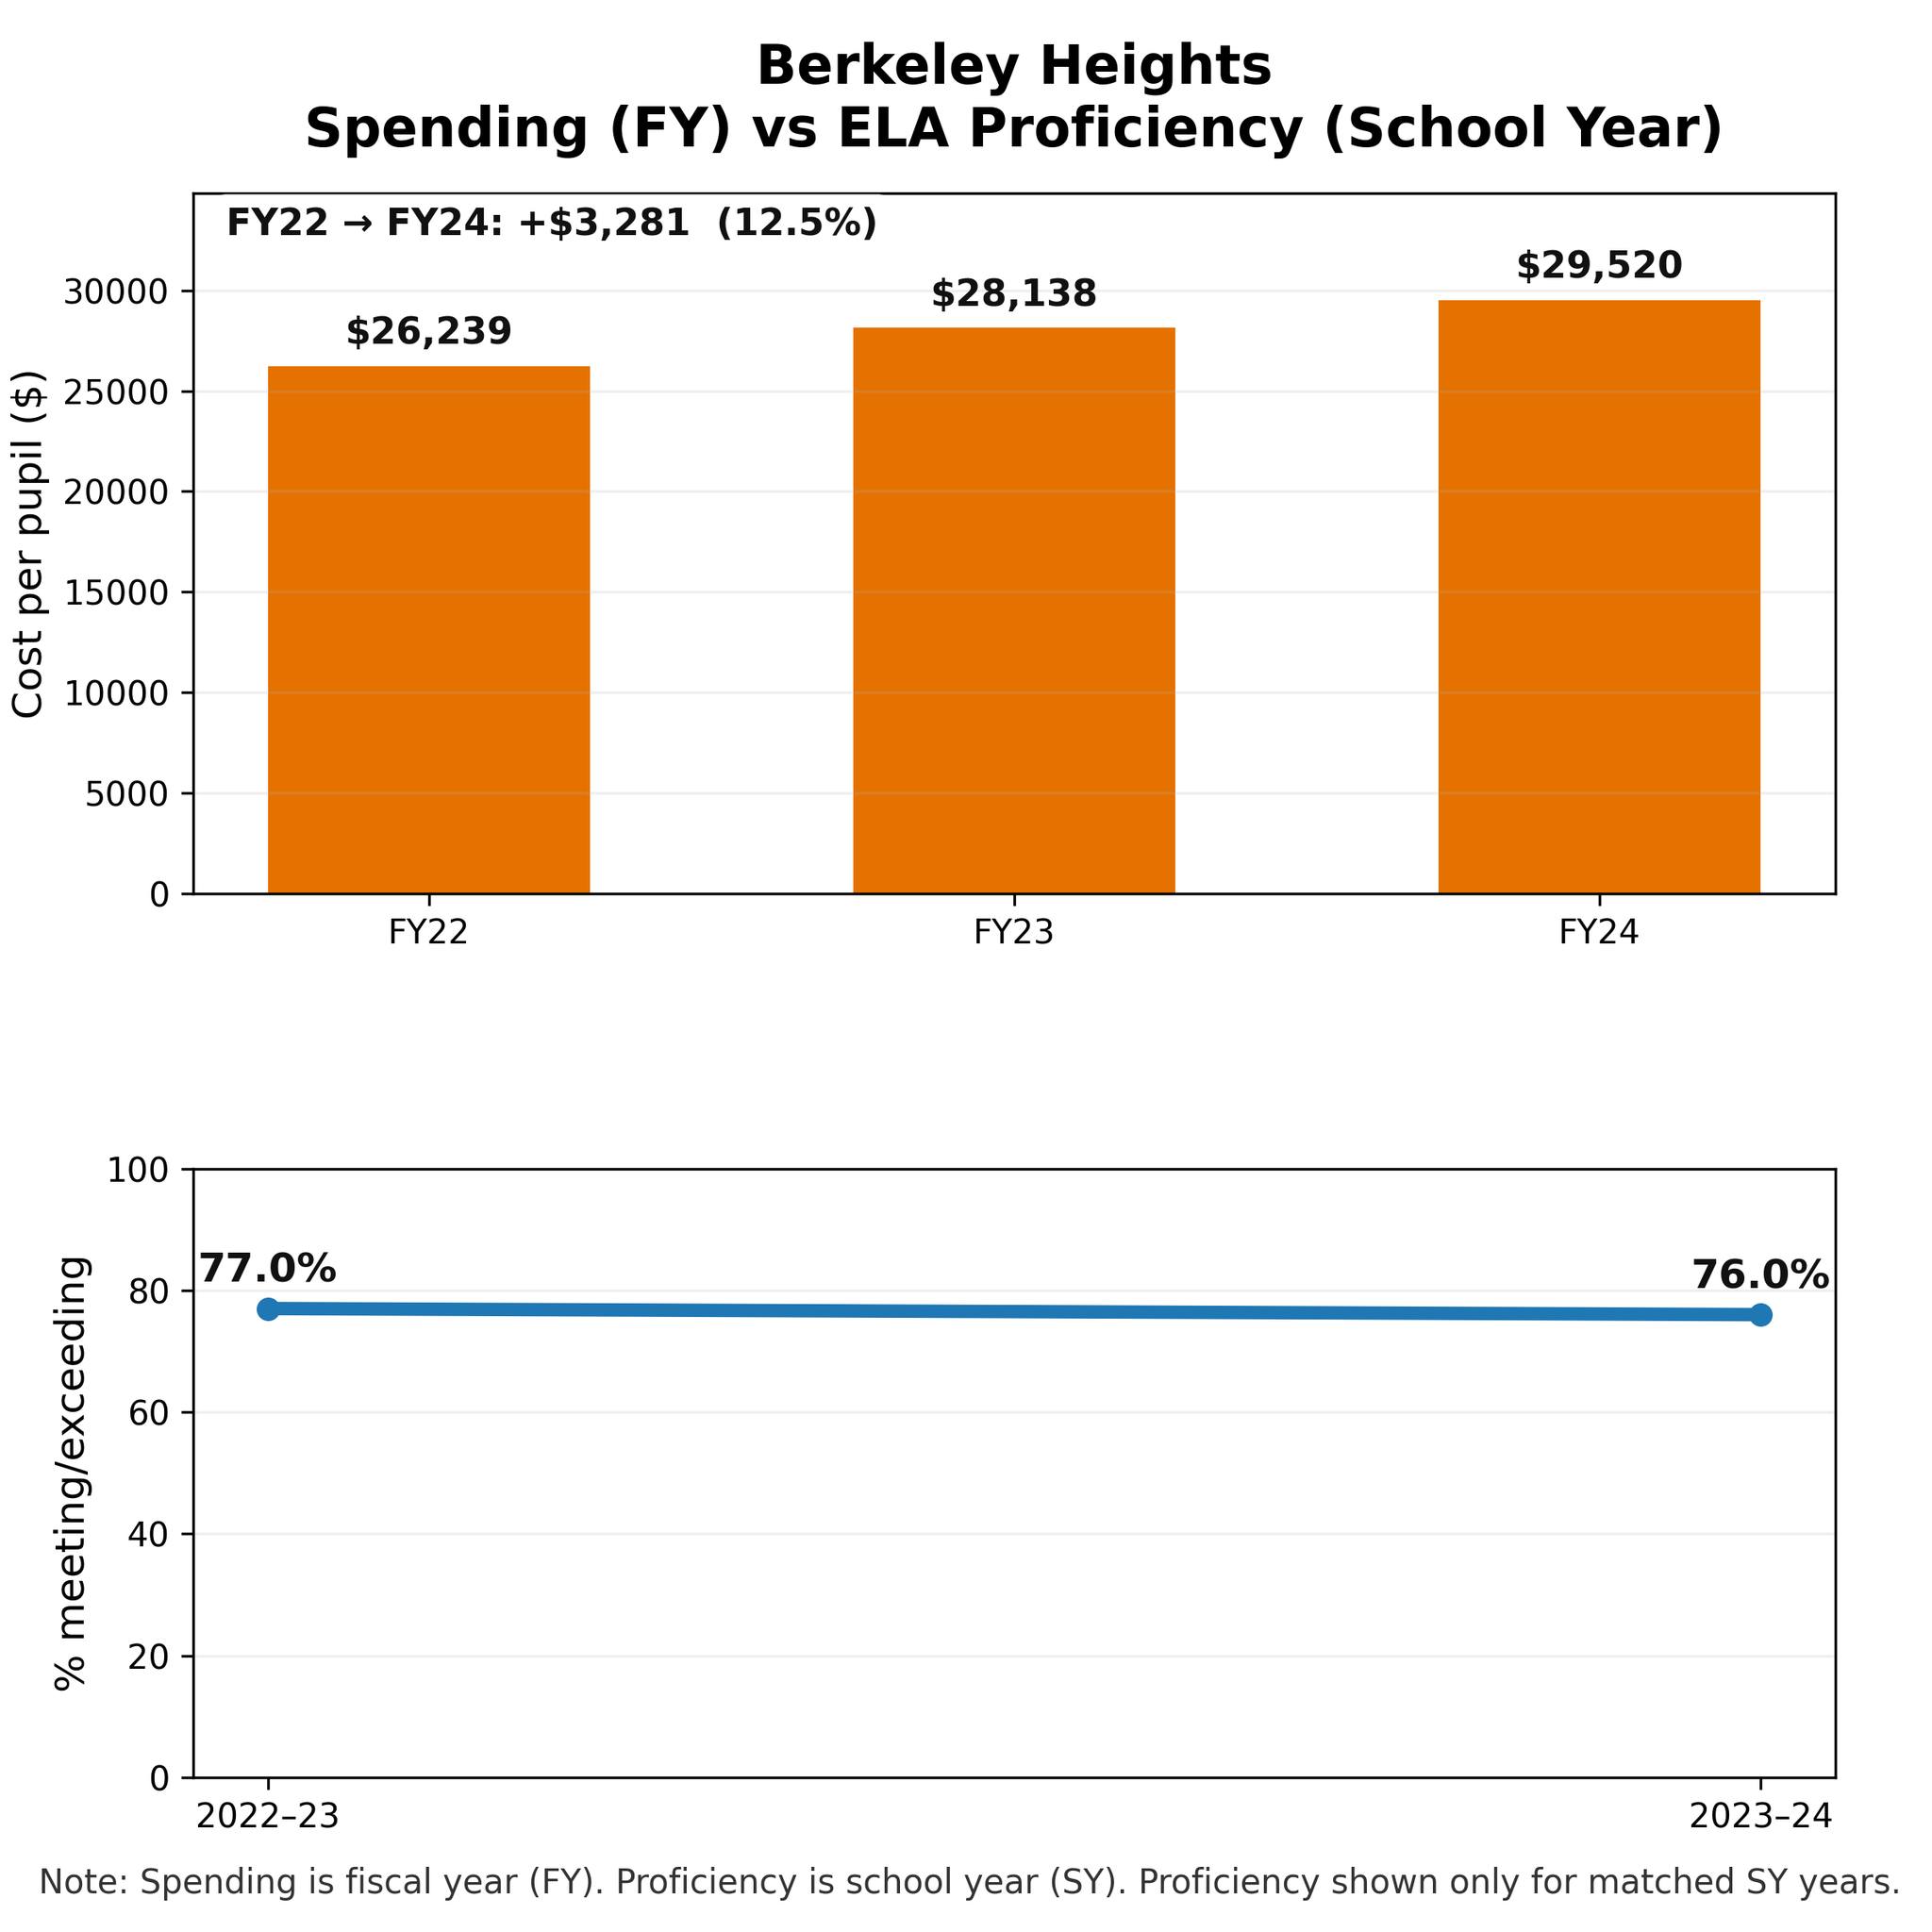
Berkeley Heights has historically had the highest cost per pupil among seven comparable nearby districts but routinely shows up in the bottom third on state proficiency across ELA, Math, and Science when compared to these same schools.
The charts below show spending and outcomes using the same matched years:
Spending (orange bars) is shown by fiscal year: FY22–FY24
Proficiency (blue line) is shown by school year and limited to the years that align with that period: 2022–23 and 2023–24 (Math, Science, and ELA)
This is meant to show direction and change over time.

Over the last few years, Berkeley Heights residents have been loud and clear about wanting tighter budgets that prioritizes learning.
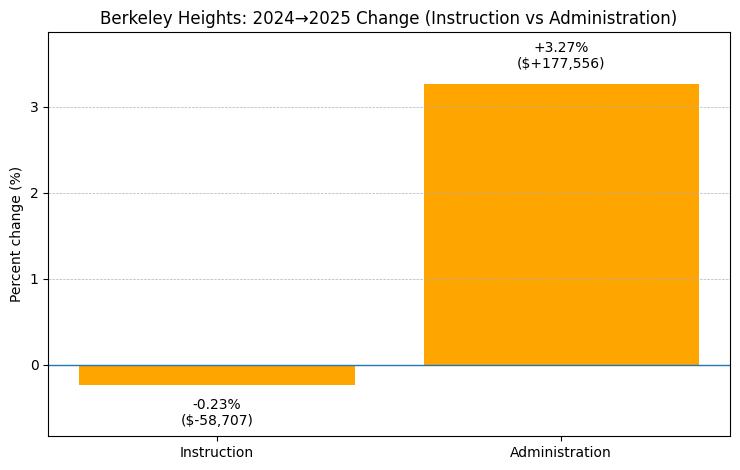
During that time, administration spending dropped sharply from 2022 into 2023/2024.
But 2025 shows a noticeable bounce back up.
At the same time, instruction spending has stayed essentially FLAT from 2022–2025.
Why is admin rebounding while instruction remains flat and enrollment continues to drop?
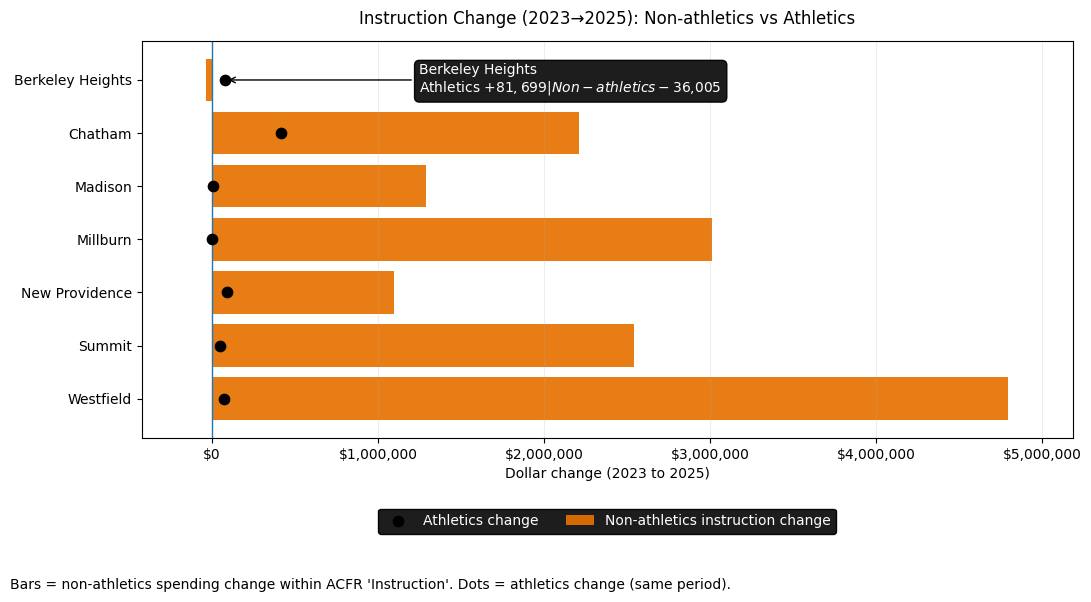
Orange bars are the change in non-athletics spending within the ACFR “Instruction” category from 2023 to 2025. Black dots are the change in athletics.
In most districts, instruction growth is driven mainly by non-athletics instruction, and athletics changes only a little.
Berkeley Heights is different: athletics went up $81,699, while non-athletics instruction went down $36,005. So Berkeley Heights’ net “Instruction” increase over these two years is more than explained by athletics growth, not growth across the rest of instruction.
Back in December, NJ21st reported on yet another surge in security spending.
Our Wiki (https://bit.ly/4u2cjOz) contains a curated list of articles that follow this concerning and expensive trend over the years.