Berkeley Heights School District ACFR Profile
This page is meant to help residents compare Berkeley Heights with six peer districts using verified per-pupil ACFR data. A rank of 1st means the highest per-student spending in that category among the peer group. That is not automatically a sign of strength. In Berkeley Heights’ case, high rankings should raise harder questions about priorities, tradeoffs, and whether spending is lining up with student outcomes.
1. Total District Overview
Berkeley Heights is the highest spender in the peer group on overall cost per pupil and total instruction, while also ranking near the top on administration. That makes the district a useful case study in whether high spending is translating into defensible priorities and strong enough results.
Top-Line Position
- Total Cost Per Pupil: 1st of 7 ($31,572)
- Instruction (All Categories): 1st of 7 ($10,858)
- Total Administration: 2nd of 7
Why That Matters
- If Berkeley Heights is 1st overall on cost per pupil, residents should expect a clear explanation for where the money is going and what the district is getting in return.
- If instruction is 1st, residents should ask why the district still made budget choices that reduced instruction while preserving or elevating other lines.
- If administration is 2nd, residents should ask how much of the district’s high-cost profile is reaching classrooms versus being absorbed by overhead and support structure.
2. Core Instruction & Classroom Spending
Berkeley Heights spends heavily on classroom and instructional support categories, but that has to be viewed alongside the broader budget picture, including the fact that the district was the only one in your peer set with a net loss in instruction in the 2025–2026 budget discussion.
Where Berkeley Heights Ranks
- Regular Programs: 2nd of 7
- Staff Training: 2nd of 7
- Textbooks: 3rd of 7
- Improvement of Instruction: 3rd of 7
What Stands Out
Berkeley Heights is not a low-spending district trying to stretch limited resources. It is already near the top of the group in core instructional spending. That makes later choices to cut or dilute instruction harder to defend, not easier.
3. Special Education Services
Berkeley Heights is a top-tier spender in several special education categories. That may reflect real student need, but it also means the district should be able to clearly explain staffing, service model, and why these costs sit where they do compared with peers.
Where Berkeley Heights Ranks
- Special Education (Total): 1st of 7
- Resource Room: 2nd of 7
- Autism: 1st of 7
- Child Study Teams: 2nd of 7
- Speech, OT, PT & Related Services: 2nd of 7
- Learning & Language Disabilities: 4th of 7
- Other Support (Extra Services): 4th of 7
- Other School Placement: 6th of 7
What Stands Out
Berkeley Heights ranks at or near the top in multiple special education buckets. That does not prove inefficiency, but it does make transparency more important. A district spending this much should be prepared to show residents what those dollars are supporting and how its structure compares with neighboring districts.
4. Student Activities & Support Services
This section is where the spending story becomes harder to ignore. Berkeley Heights ranks 1st in athletics, 1st in guidance, and 1st in health services, even while the district’s budget choices have raised questions about whether non-classroom priorities are being protected at the expense of instruction.
Where Berkeley Heights Ranks
- Athletics: 1st of 7
- Guidance: 1st of 7
- Health Services: 1st of 7
- Educational Media Services (Library): 2nd of 7
- Bilingual Education: 3rd of 7
- Cocurricular Activities: 4th of 7
- Basic Skills / Remedial: 7th of 7
What Stands Out
Berkeley Heights is not just spending heavily overall. It is also choosing to be a top spender in athletics and several support areas while ranking last in this peer group on basic skills and remedial spending. That contrast deserves scrutiny.
5. Administration & Technology
Berkeley Heights is also expensive on the overhead side of the ledger. That is important because a district can post high instructional spending and still have too much of its total cost structure tied up in administration and benefits.
Where Berkeley Heights Ranks
- Gen Admin (Total Sub-Account): 1st of 7
- Employee Benefits: 1st of 7
- Admin Information Tech: 2nd of 7
- Legal Fees: 2nd of 7
- School Administration: 3rd of 7
- Central Services: 4th of 7
- Gen Admin (Misc): 4th of 7
What Stands Out
Berkeley Heights combines a 2nd-place total administration ranking with 1st-place employee benefits and a 1st-place general administration sub-account. That should push residents to ask whether the district’s high per-pupil spending is being diluted by overhead before it ever reaches students.
6. Operations, Safety & Maintenance
Operational costs matter, but they also reveal priorities. Berkeley Heights ranking 1st in security is not inherently a success story. It is another area where residents should expect a concrete explanation for why the district is spending more than peers.
Where Berkeley Heights Ranks
- Security: 1st of 7
- Care & Upkeep of Grounds: 3rd of 7
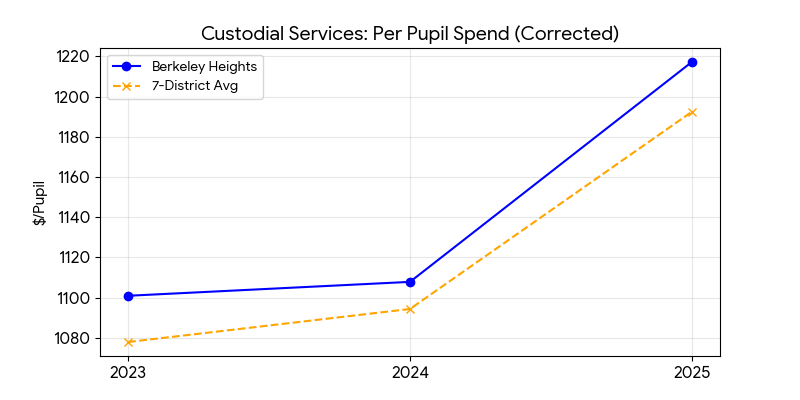
- Custodial Services: 4th of 7
- Transportation: 4th of 7
- Facility Maintenance: 4th of 7
What Stands Out
Security is one of Berkeley Heights’ biggest operational cost outliers. Middle-of-the-pack rankings in transportation, maintenance, and custodial services make that 1st-place security ranking stand out even more.
Trend Charts
These charts show where Berkeley Heights sits relative to its peers over time. On this page, “above average” should not be read as “better.” In many cases it simply means Berkeley Heights is spending more, and residents should decide whether the district has made a convincing case for those choices.
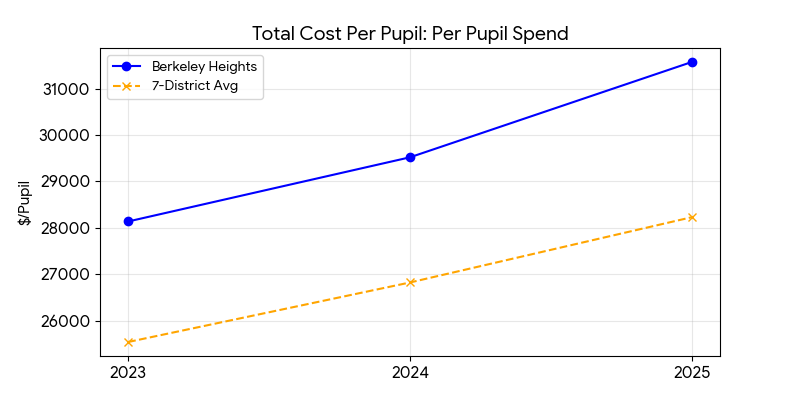
Total Cost Per Pupil
Berkeley Heights ranks 1st of 7 overall, which should intensify scrutiny of results and priorities, not reduce it.
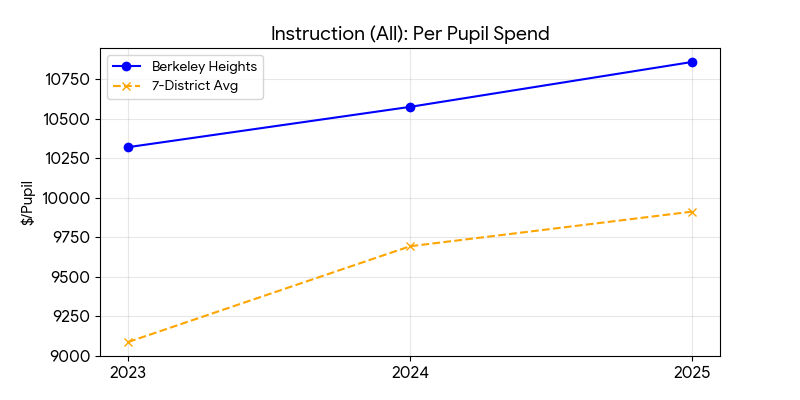
Instruction (All Categories)
Berkeley Heights ranks 1st here too, making later cuts or stagnation in classroom priorities harder to excuse.
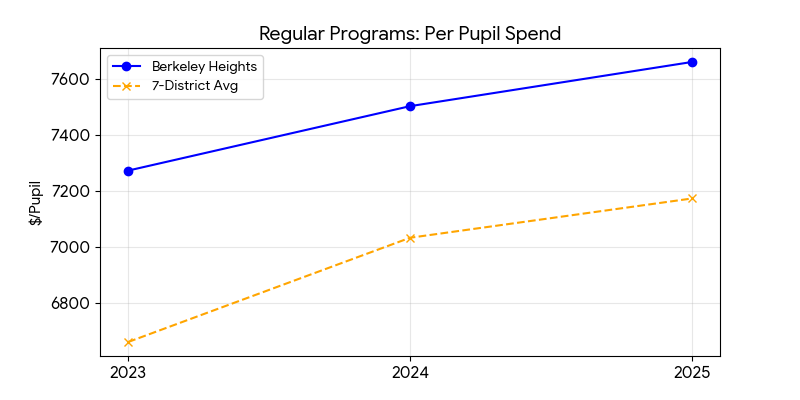
Regular Programs
Near-top spending in regular instruction raises the question of what residents are getting for that premium.
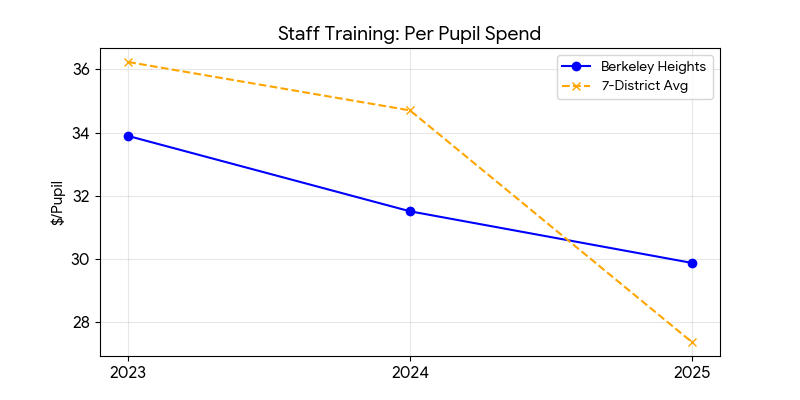
Staff Training
This is another upper-tier category for Berkeley Heights, which should be tied to visible classroom value and outcomes.
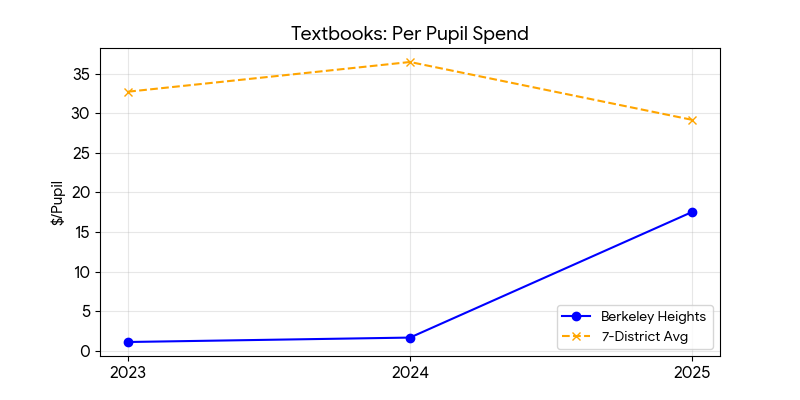
Textbooks
Berkeley Heights ranks 3rd of 7 here, another reminder that this is not a district operating from scarcity.
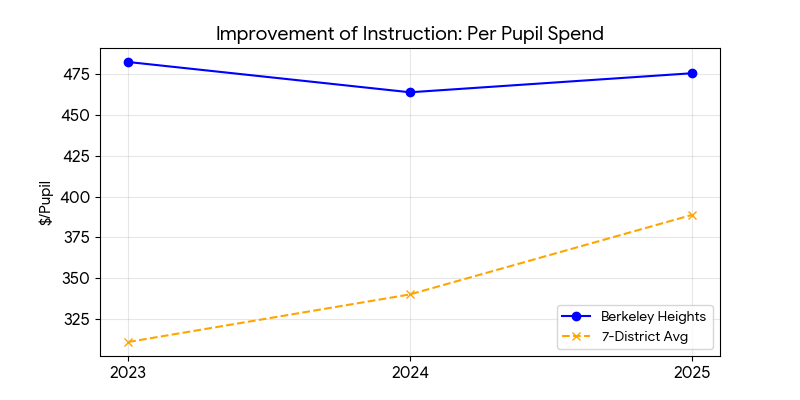
Improvement of Instruction
Upper-tier spending in instructional support should be weighed against the district’s actual academic trajectory.
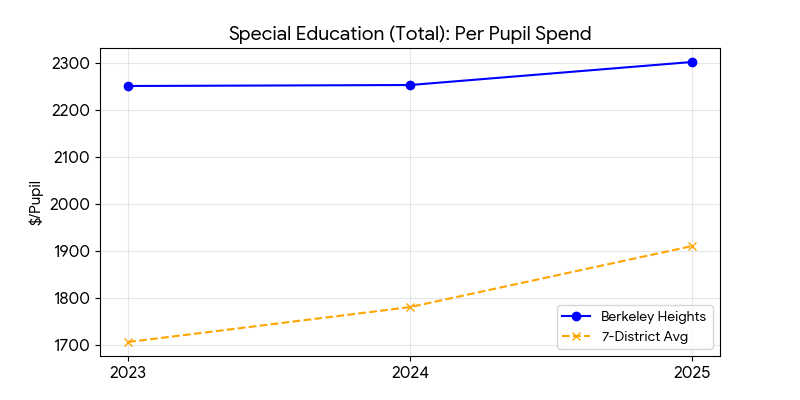
Special Education (Total)
Berkeley Heights ranks 1st of 7, making transparency about structure and need especially important.
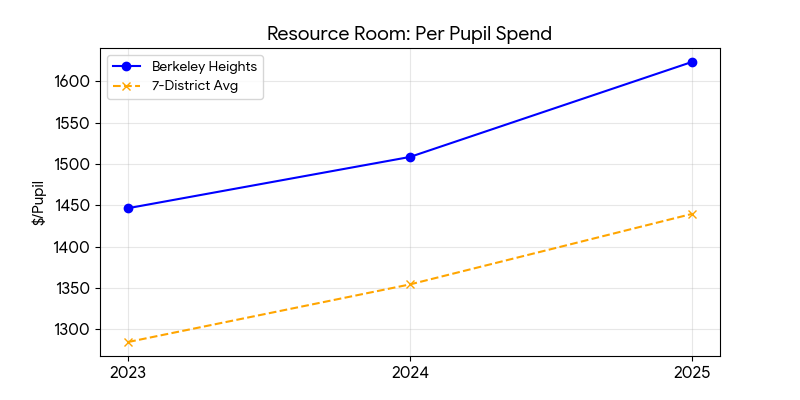
Resource Room
Near-top spending here may reflect real service obligations, but the district should be able to explain the difference from peers.
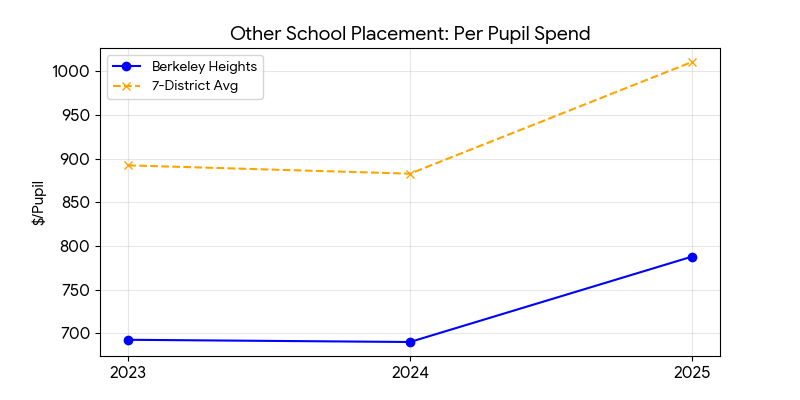
Other School Placement
This is one of Berkeley Heights’ lower-ranked categories, showing that not every line runs high.
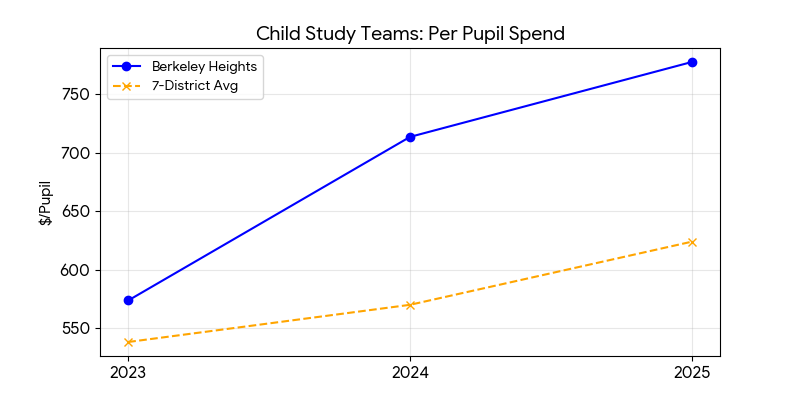
Child Study Teams
Berkeley Heights again lands near the top, adding to the district’s broader high-cost profile.
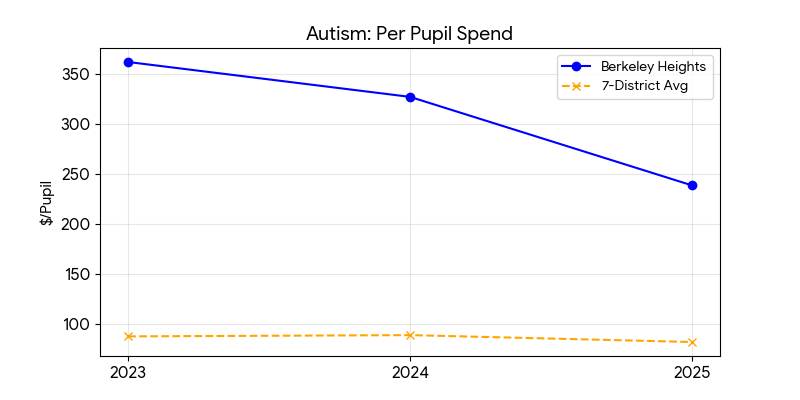
Autism
1st of 7 in this category. Residents should ask what model and staffing choices sit behind that ranking.
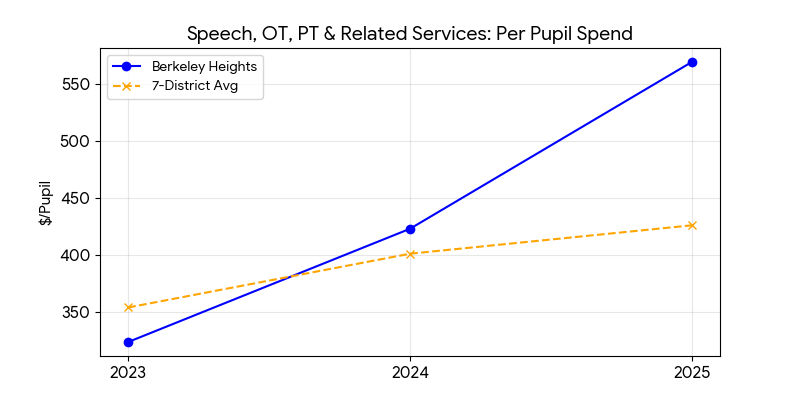
Speech, OT, PT & Related Services
Another top-tier category that warrants explanation, not applause.
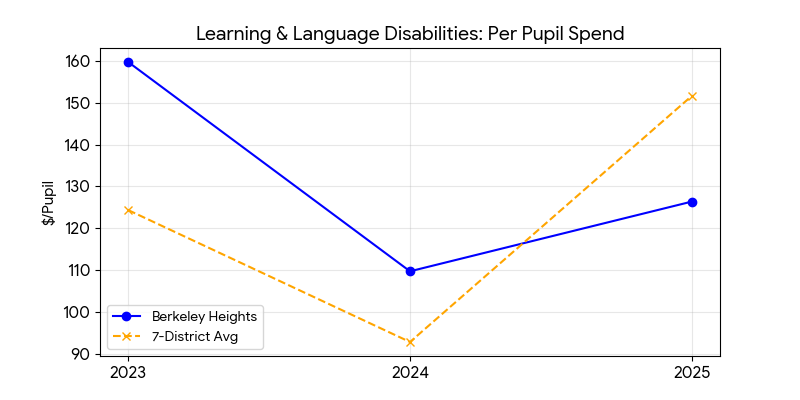
Learning & Language Disabilities
Middle-tier by comparison, which helps show where Berkeley Heights is and is not an outlier.
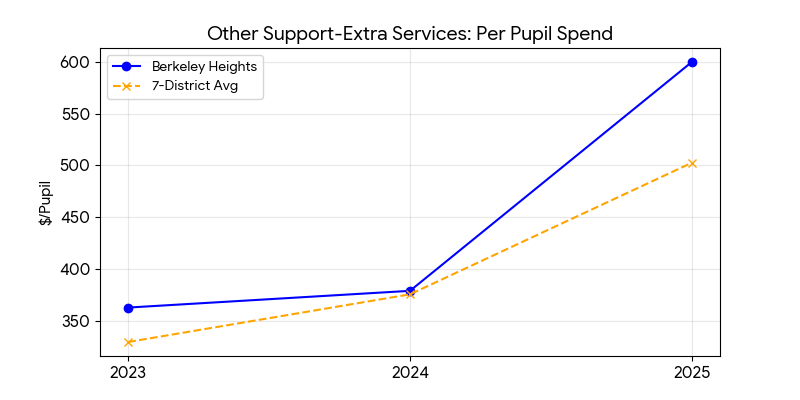
Other Support (Extra Services)
Not one of the district’s biggest spending outliers, but still part of the larger cost picture.
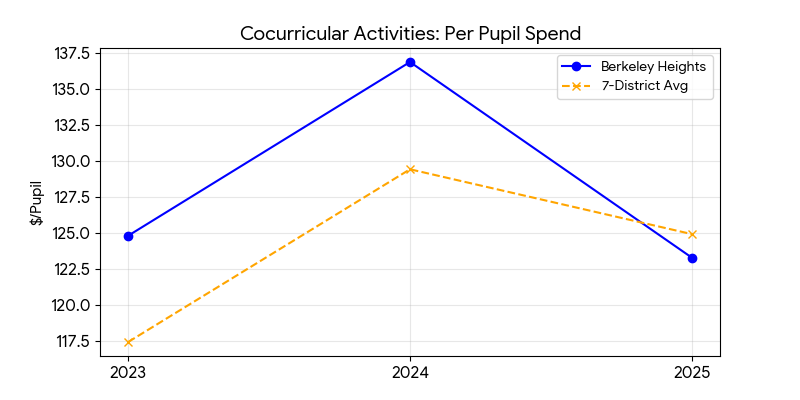
Cocurricular Activities
Mid-range here, but overshadowed by Berkeley Heights’ much higher athletics ranking.
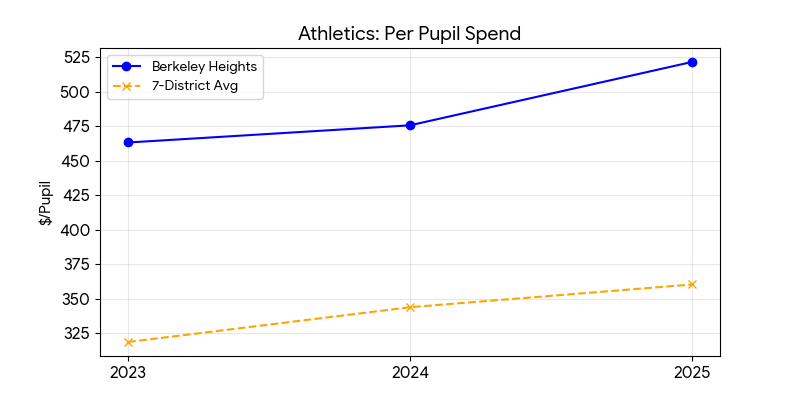
Athletics
1st of 7. Given your reporting on instruction cuts, this is a category residents should examine very closely.
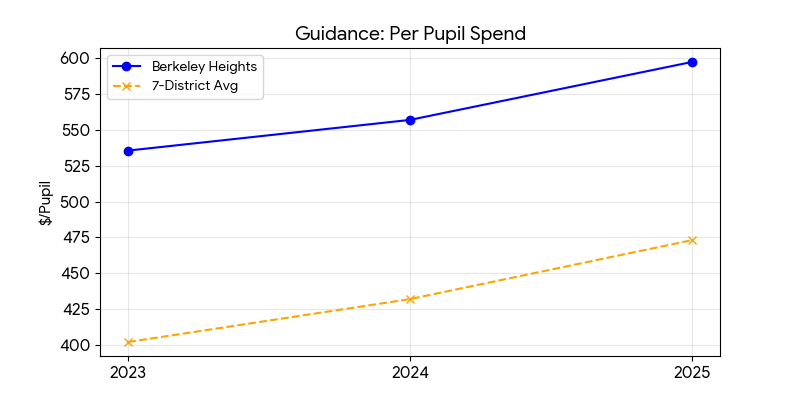
Guidance
Another 1st-place ranking that adds to the case that Berkeley Heights is paying a premium across multiple non-core categories.
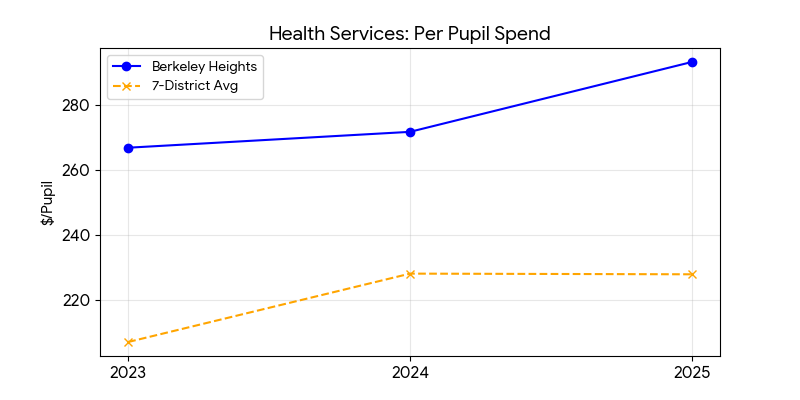
Health Services
Berkeley Heights is also 1st here, reinforcing that its high-cost profile is broad, not isolated.
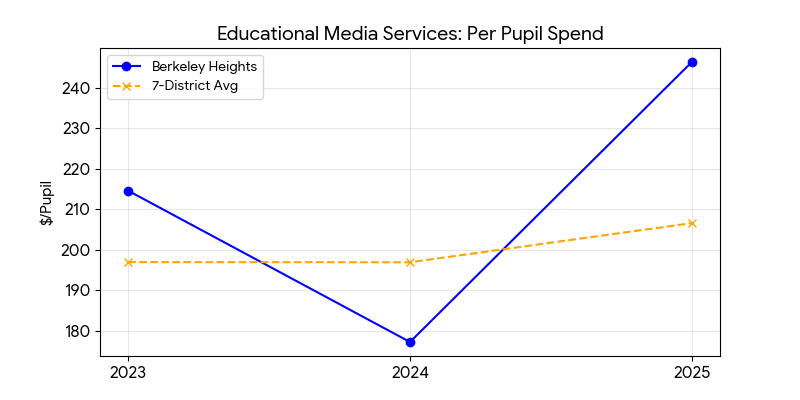
Educational Media Services
2nd of 7. Another upper-tier support category for a district already spending at the top overall.
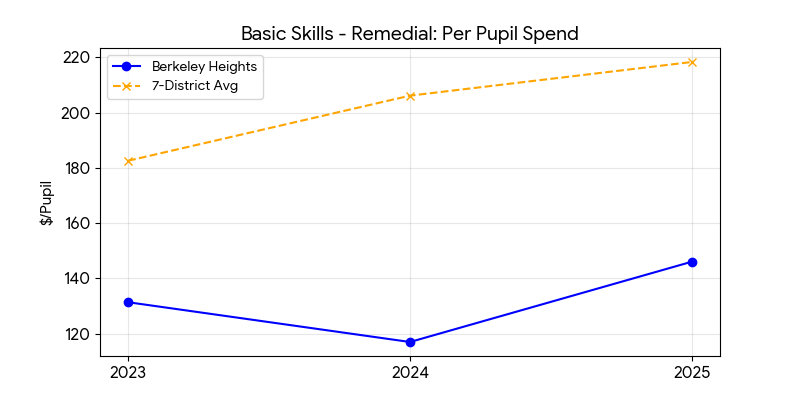
Basic Skills / Remedial
7th of 7. That is a striking contrast with Berkeley Heights’ much higher spending in athletics and several support lines.
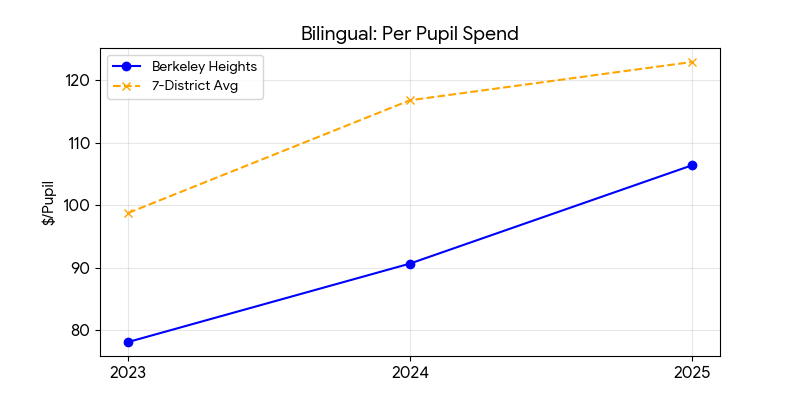
Bilingual Education
Upper-middle here, but not one of the district’s biggest outliers.
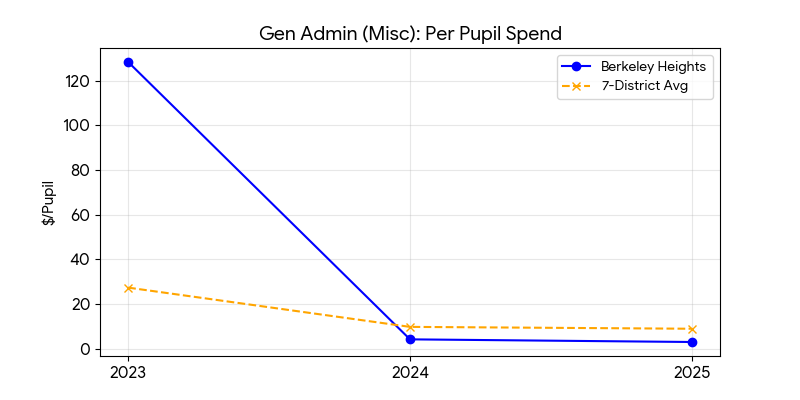
Gen Admin (Misc)
Not the highest line on its own, but part of a broader pattern of elevated administrative cost.

School Administration
Berkeley Heights is upper-tier here as well, adding to the overhead side of the ledger.
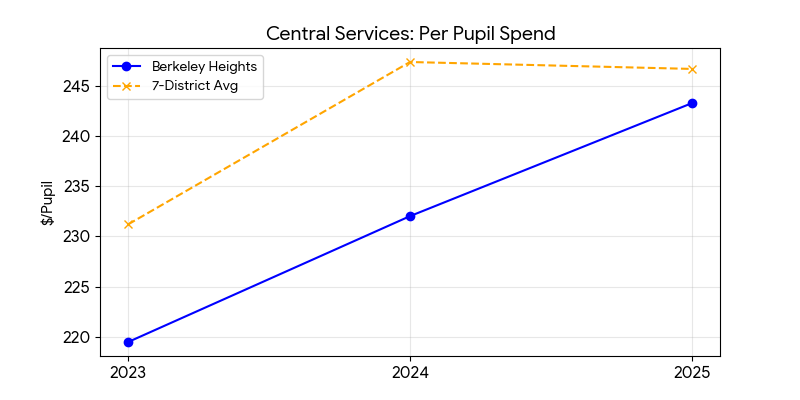
Central Services
More middle-of-the-pack, but still part of a district-wide high-spending structure.
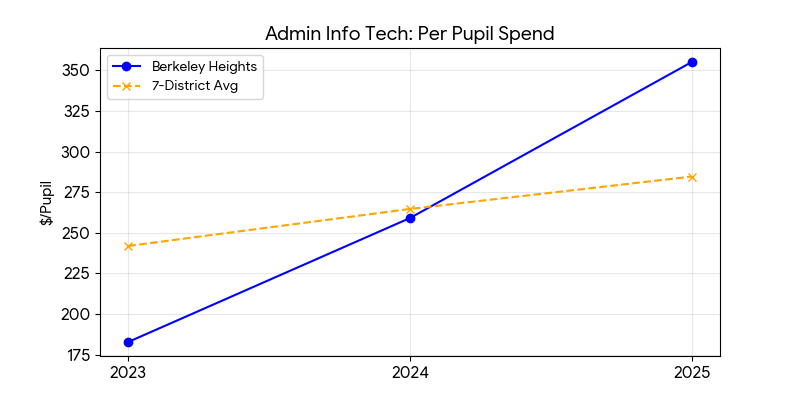
Admin Information Tech
2nd of 7, with a major 2025 jump that deserves explanation.
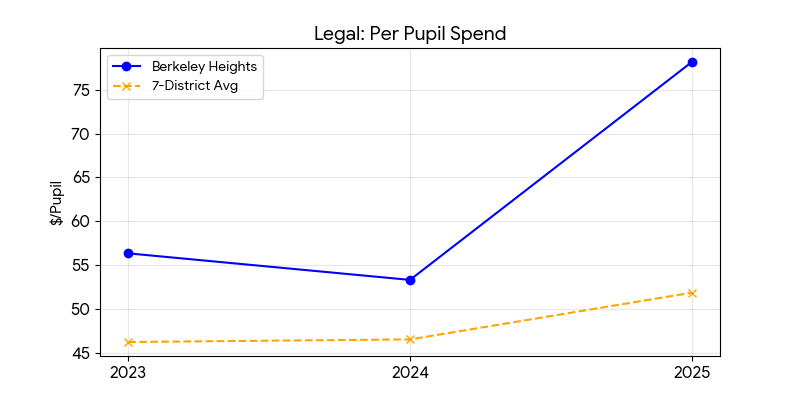
Legal Fees
Upper-tier legal spending is another cost area residents should not ignore.
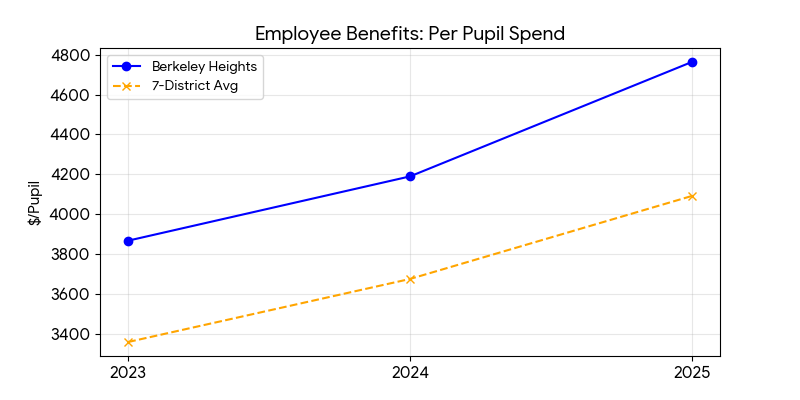
Employee Benefits
1st of 7 and a major driver of Berkeley Heights’ cost profile.
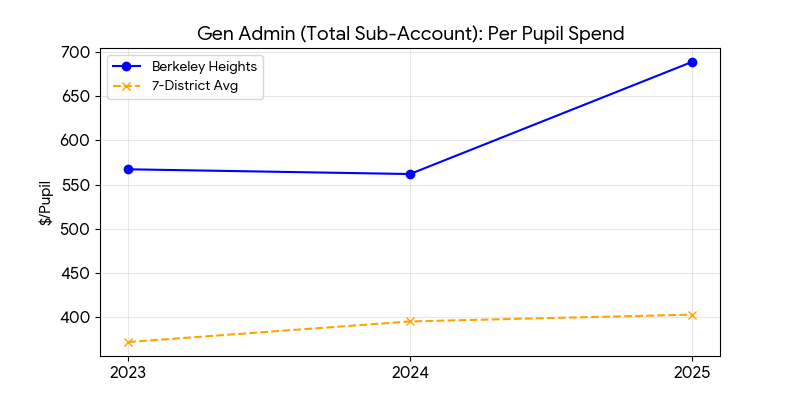
Gen Admin (Total Sub-Account)
Another 1st-place ranking on the overhead side.
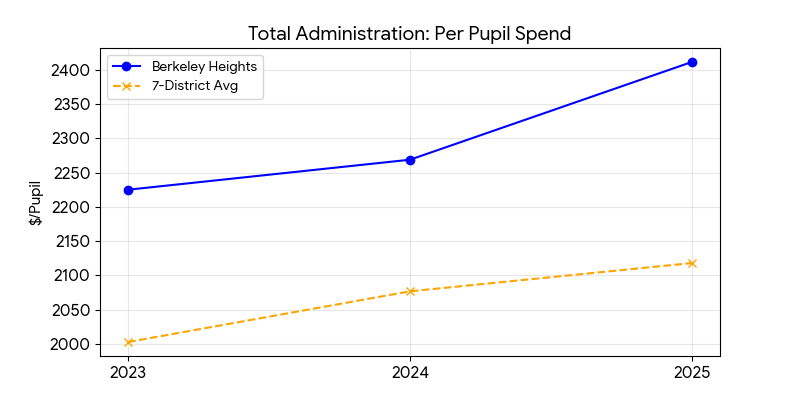
Total Administration
2nd of 7, reinforcing that Berkeley Heights is not only expensive in the classroom but also near the top in overhead.
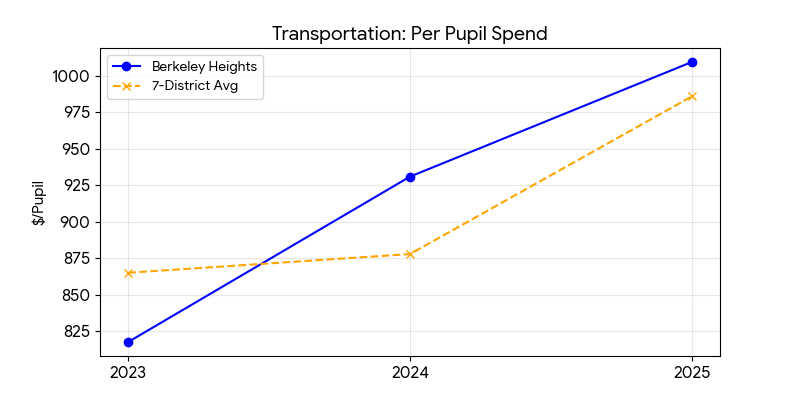
Transportation
More middle-tier here, which makes some of the district’s higher-ranked cost areas stand out more sharply.
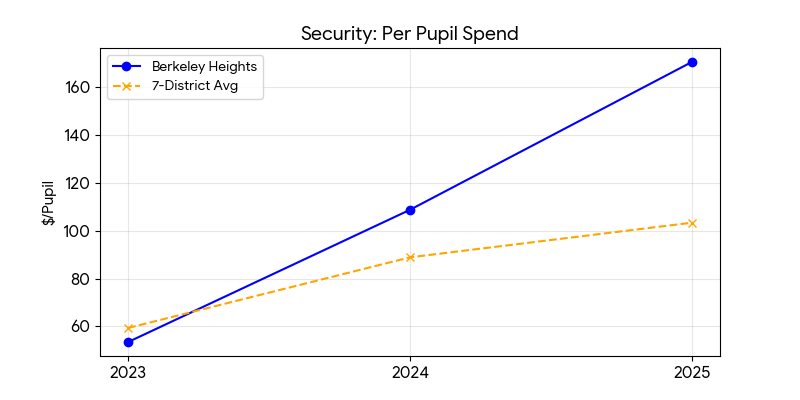
Security
1st of 7. This is a spending outlier that should be explained with specifics.
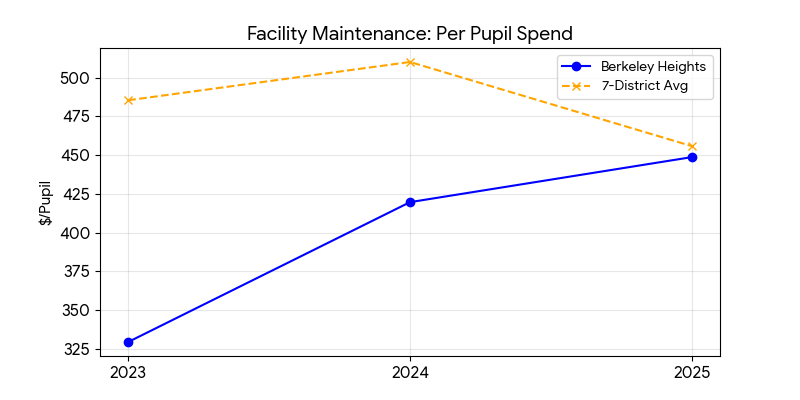
Facility Maintenance
Middle-tier here, not one of Berkeley Heights’ strongest spending outliers.
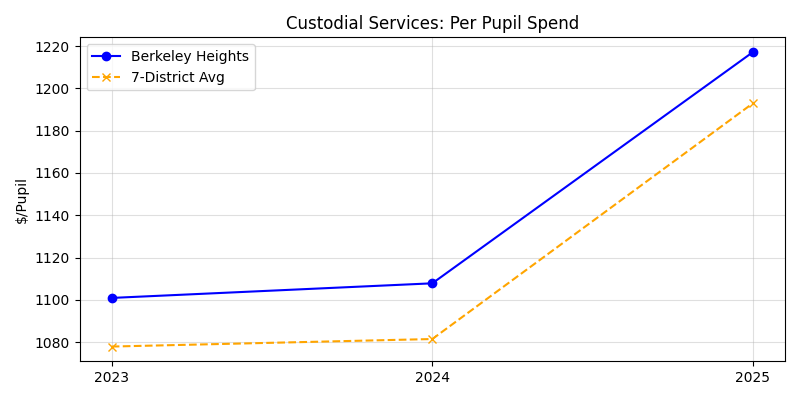
Custodial Services
Middle-of-the-pack which again highlights that the larger story is concentrated in other categories.
Care & Upkeep of Grounds
Upper-middle, but not as striking as security, athletics, administration, or benefits.