Legal But Opaque Part 2: A Case Study of the Berkeley Heights Recreation Hire
In part one of this single thread analysis, NJ21st examined how public contracts, political relationships, and decision-making structures can intersect...
7-Agency Dashboard: Municipal Use of Force Trends (2021–2025)
The report takes a look at 401 use of force incidents reported by the following police departments between 2021 through...

nj21st 2025 Property Tax Dashboards
We have updated our Property Tax Dashboards to include 2025 Data released by the NJ Department of Community Affairs. ...
2025 Year End Newsletter
A look back at our most-read reporting, editors’ picks, financial report and audience growth. In 2025, NJ21st covered floods, school...
2025_review
What We Covered in 2025 A short year-end series highlighting the stories NJ21st readers turned to most in 2025 and...
2024-2025 7-District Dashboard – A Preliminary Look at Next Year’s School Performance Reports
Every year we provide a preliminary look at what the April School Performance reports will look like based on the...

Legal But Opaque: A Case Study Mapping the Political Economy of Union County Governance
Harbor Consultants, based in Cranford, has been operating on two fronts in Union County… municipal contractor and political donor. Both...

Building Blind: Is New Jersey’s Development Boom Overwhelming Schools and Flooding Homes?
If you want to know where the state is growing, don’t listen to speeches. Follow the permits. The NJ DCA...
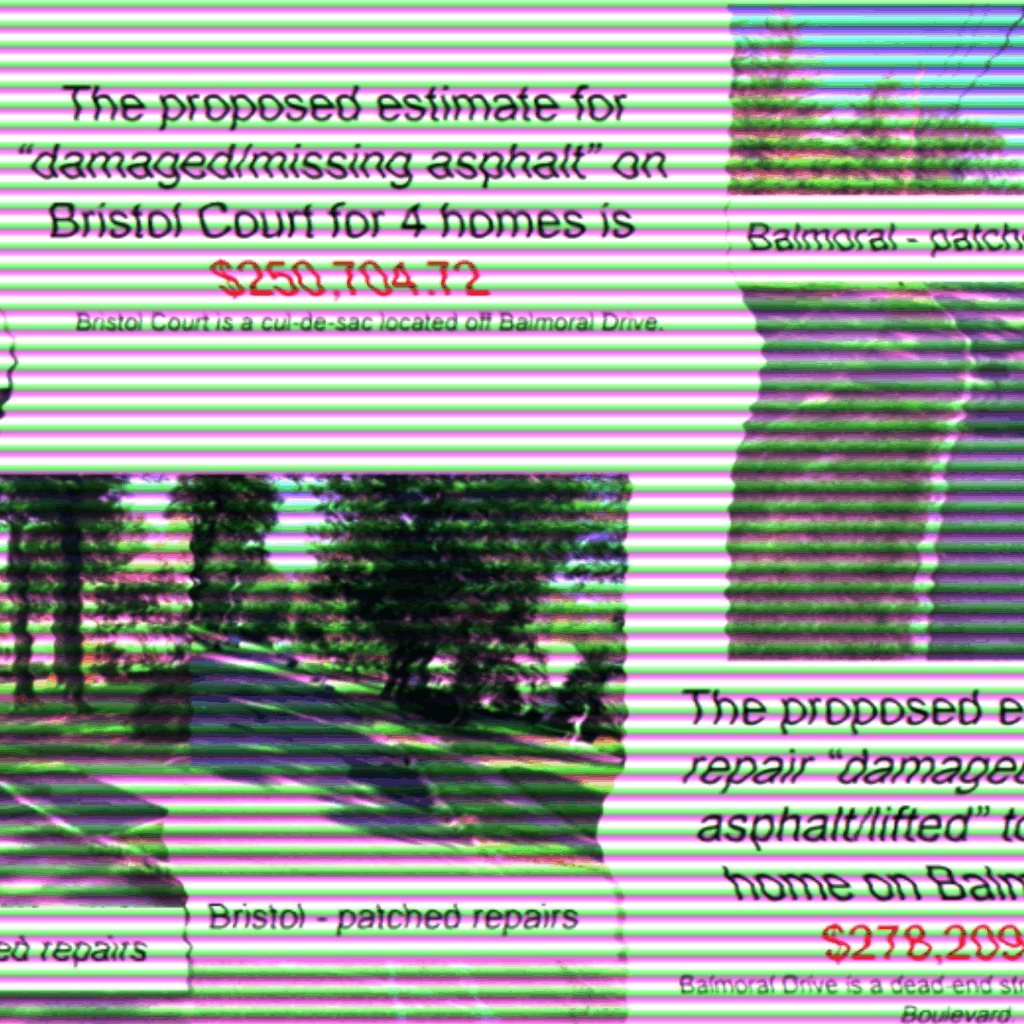
NJ21st Investigates Berkeley Heights Storm Damage Assessment
Emergency Bond Spending in Berkeley Heights- Storm Recovery or Misplaced Priorities? by Laura Kapuscinski I visited the majority of specific...
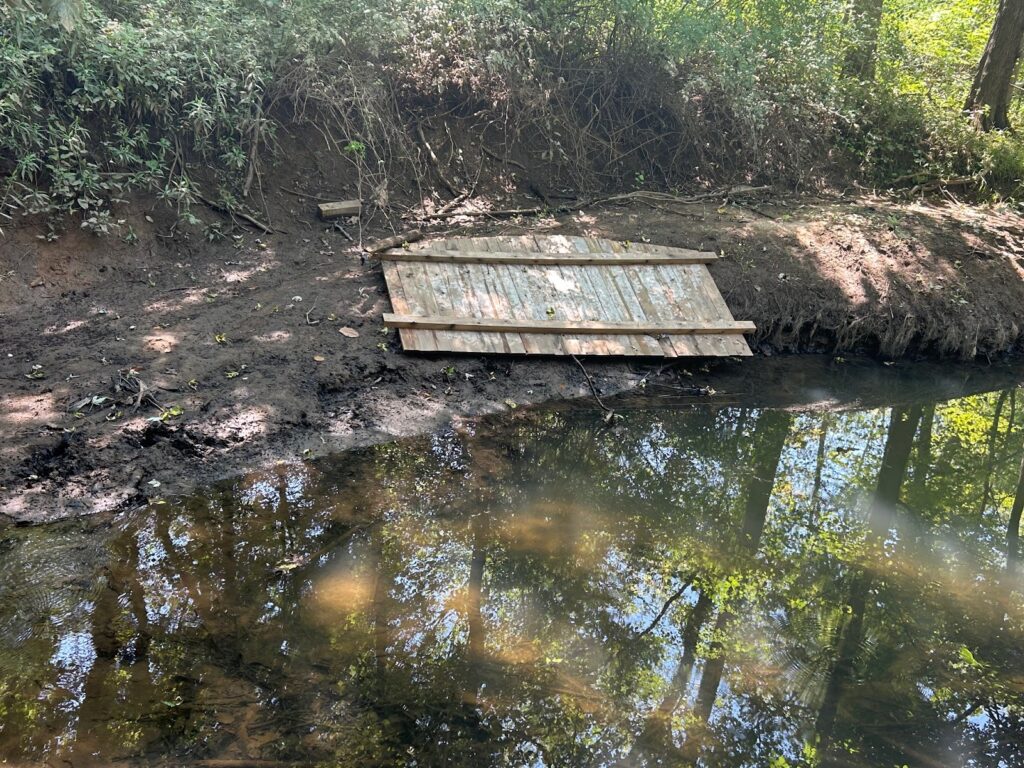
Debris Chokes Passaic River: Post-Storm Visit Raises Questions for Berkeley Heights Mayor and Council
Debris Chokes Passaic River: Post-Storm Visit Raises Questions for Berkeley Heights Mayor and Council -Michael Leblond Last week’s town council...