What 10 Years of Wage Data Tell Us About Living in New Jersey
Over the past decade, wages in New Jersey have gone up—but in many cases, not enough to keep pace with...
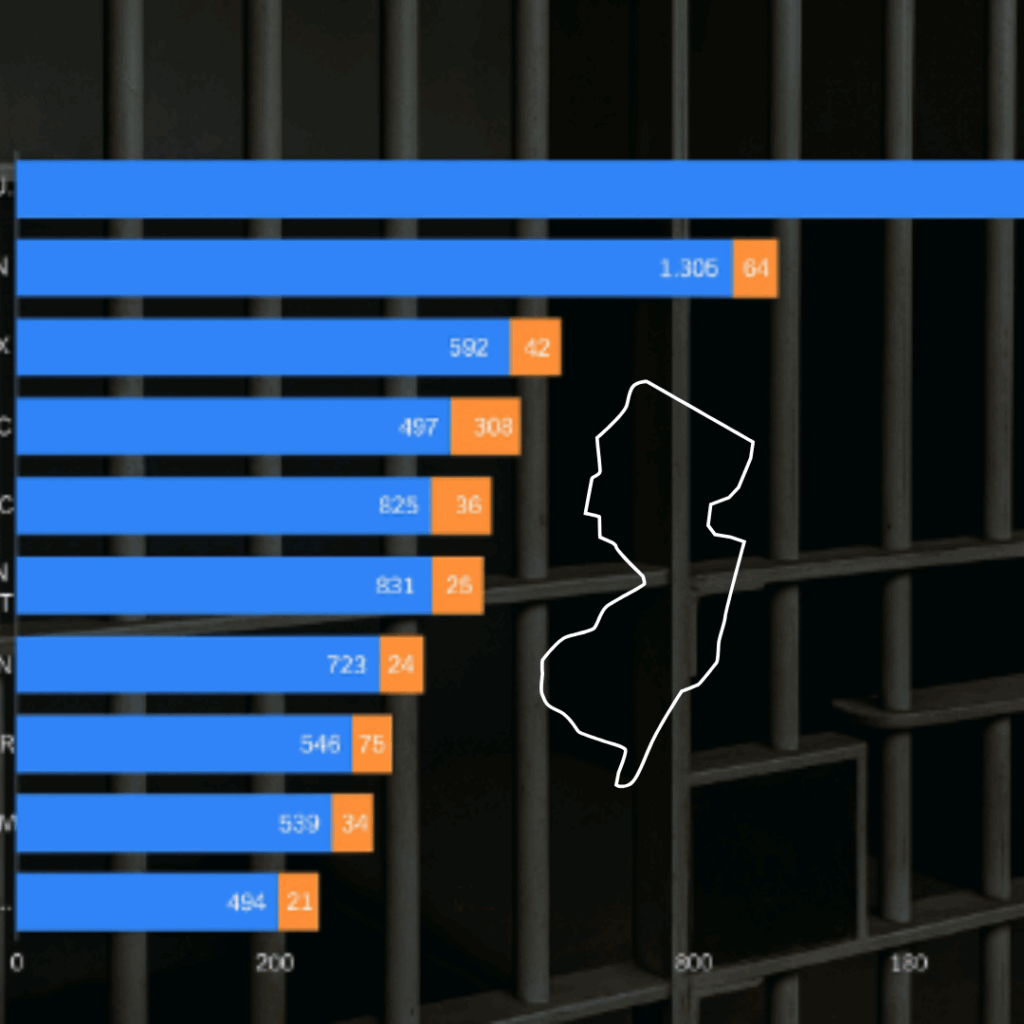
Statewide Justice Trends – Visualizing New Jersey’s Prison Landscape
Beyond the raw figures of New Jersey’s justice system are countless individual lives, each deeply shaped by everything from where...
From Social Services to Software: A Breakdown of NJ State Vendor Spending
New Jersey spent more than $3.1 billion on vendors during Fiscal Year 2024 — paying for everything from social services...
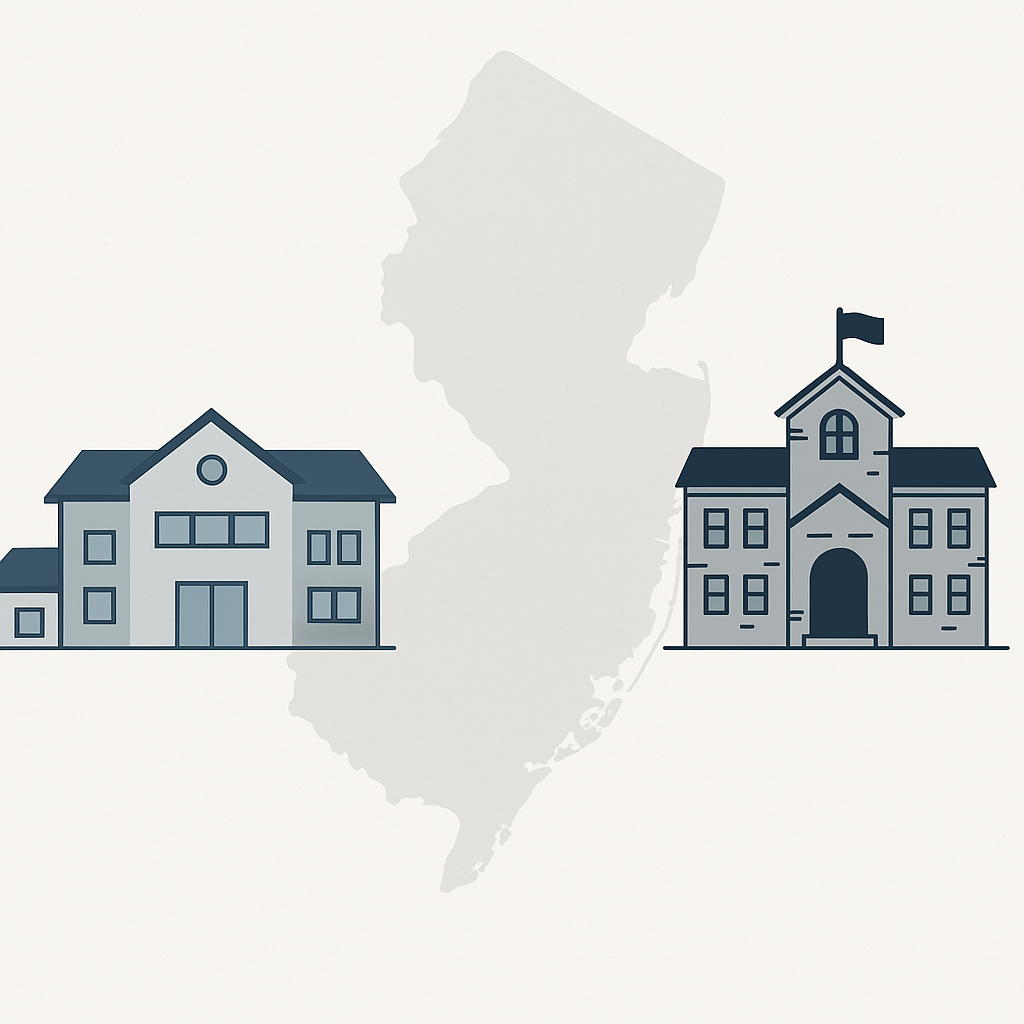
A Tale of Two Systems: Comparing City and Suburban School Districts in New Jersey
In New Jersey, public education is shaped not only by state standards and funding formulas, but by local context —...

Out-of-School Placement Rates in NJ Special Education: By Year and Subgroup
This report presents a multi-year overview of special education placement patterns in New Jersey from 2020 to 2024, focusing on...
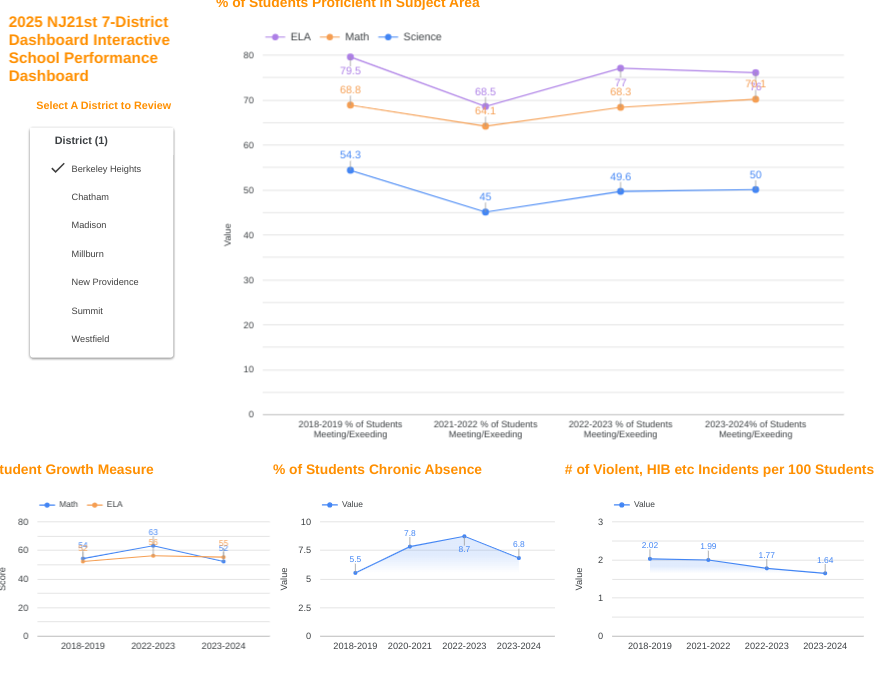
2025 NJ21st 7-District Interactive School Performance Dashboard
We are pleased to announce the launch of NJ21st’s interactive dashboard, developed to help users explore school performance data for...
2025 NJ21st 7-District Interactive School Performance Dashboard
Data on Dashboard based on 2023-2024 NJ School Performance Reports Return to Main Page
Berkeley Heights 2023-2024 NJ School Performance Report Drill Down
How each Berkeley Heights School measured up on the 2023-2024 NJ Performance Reports The recently published 2023-2024 NJ School Performance...
2025 7-District Dashboard – NJ School Performance Report Comparisons
NJ School Performance Report Comparisons for Berkeley Heights, New Providence, Millburn, Westfield, Chatham, Madison and Summit. The following analysis draws...

Concentrated Influence: Following the Money in NJ Politics (2019–2024) Part 1
State Level Data and Insights Last year, NJ21st published a multi-part series tracking the flow of grey money into County...