Chatham School District ACFR Profile
This page is designed to help residents walk into budget meetings with a grounded, apples-to-apples view of how Chatham compares with the six other districts on our ACFR dashboard. The rankings below are based on verified 2025 per-pupil figures unless otherwise noted. A rank of 1st means the highest per-student spending in that category among the peer group.
1. Total District Overview
Start here. This is the simplest way to frame the conversation: where Chatham sits overall and how much of that footprint appears to be driven by instruction versus overhead and support categories.
Top-Line Position
- Total Cost Per Pupil: 4th of 7
- Instruction (Total): 3rd of 7
- Total Administration: 4th of 7
Questions Residents Can Ask
- If Chatham is 4th overall, what are the biggest categories pushing total cost up?
- If instruction ranks 3rd, where does the district believe those dollars are producing value?
- If total administration is 4th, what parts of district overhead have grown the most and why?
2. Core Instruction & Classroom Spending
This section looks at general education classroom spending and some of the support lines that districts often cite when discussing academic quality.
Where Chatham Ranks
- Regular Programs: 3rd of 7
- Staff Training: 1st of 7
- Textbooks: 6th of 7
- Improvement of Instruction: 5th of 7
What Stands Out
Chatham is toward the upper end on regular classroom instruction and clearly at the top of the peer group on instructional staff training. At the same time, textbook spending is near the bottom and improvement-of-instruction spending sits in the lower half of the group.
3. Special Education Services
Chatham shows above-average pressure in several special education categories. That does not automatically mean overspending, but it does make these lines worth understanding clearly.
Where Chatham Ranks
- Special Education (Total): 2nd of 7
- Resource Room: 1st of 7
- Other School Placement: 3rd of 7
- Child Study Teams: 4th of 7
- Autism: tied for 6th of 7
- Speech, OT, PT & Related Services: 6th of 7
- Learning & Language Disabilities: 7th of 7
- Extra Services (Other Support): 5th of 7
What Stands Out
Chatham is especially high in total special education spending and resource room spending, while appearing much lower in some narrower line items like speech-related services and learning/language disabilities. That does not necessarily mean less service. It may reflect differences in coding, delivery model, staffing structure, student mix, or reliance on other buckets.
4. Student Activities & Support Services
These are the categories that shape student experience outside the core academic classroom, from clubs and athletics to counseling, health services, media, remedial support, and bilingual programming.
Where Chatham Ranks
- Cocurricular Activities: 1st of 7
- Athletics: 3rd of 7
- Guidance: 2nd of 7
- Health Services: 3rd of 7
- Educational Media Services: 5th of 7
- Basic Skills / Remedial: 3rd of 7
- Bilingual Education: 7th of 7
What Stands Out
Chatham is at the top of the peer group in cocurricular activity spending and near the top in guidance. Athletics and health services are also on the higher side. Bilingual education, by contrast, is at the bottom of the group.
5. Administration & Technology
This section helps residents separate different kinds of overhead. “Administration” is not one thing. Some lines are high, some are low, and some need to be read very carefully.
Where Chatham Ranks
- Support Services (General Admin - Misc): 2nd of 7
- Support Services (School Administration): 5th of 7
- Central Services: 3rd of 7
- Administrative Info Tech: 4th of 7
- Legal Fees: 5th of 7
- Employee Benefits: 5th of 7
- Support Services (Total General Admin): 7th of 7
What Stands Out
This is one of the easier places for residents to get tripped up. Chatham is 4th in total administration overall, but a narrower general-admin sub-account ranks last, while another general-admin misc line ranks 2nd. In other words, the answer depends heavily on which account is being discussed.
6. Operations, Safety & Maintenance
These are the “running the place” costs: transportation, safety, buildings, custodial services, and grounds.
Where Chatham Ranks
- Transportation: 1st of 7
- Security: 2nd of 7
- Facility Maintenance: 3rd of 7
- Custodial Services: 2nd of 7
- Care and Upkeep of Grounds: 7th of 7
What Stands Out
Transportation is a major cost driver for Chatham relative to the peer group. Security and custodial services are also near the top. Grounds spending, on the other hand, is at the bottom.
Trend Charts
These visualizations let residents see not just where Chatham ranks in 2025, but where spending has been moving over time relative to the seven-district average.
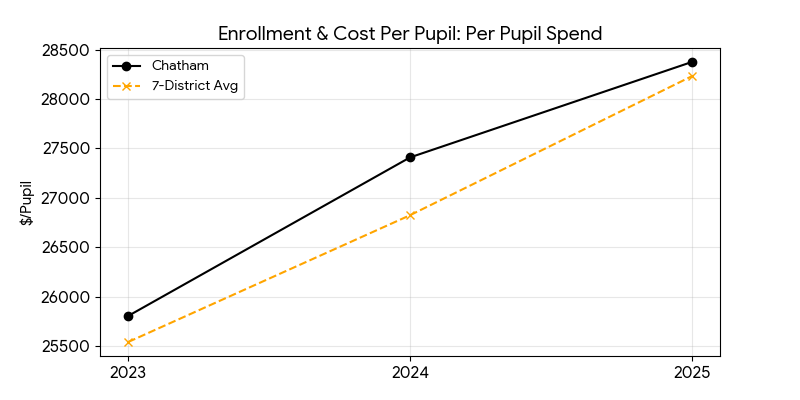
Total Cost Per Pupil
Chatham sits 4th of 7 overall and remains slightly above the peer average in 2025.
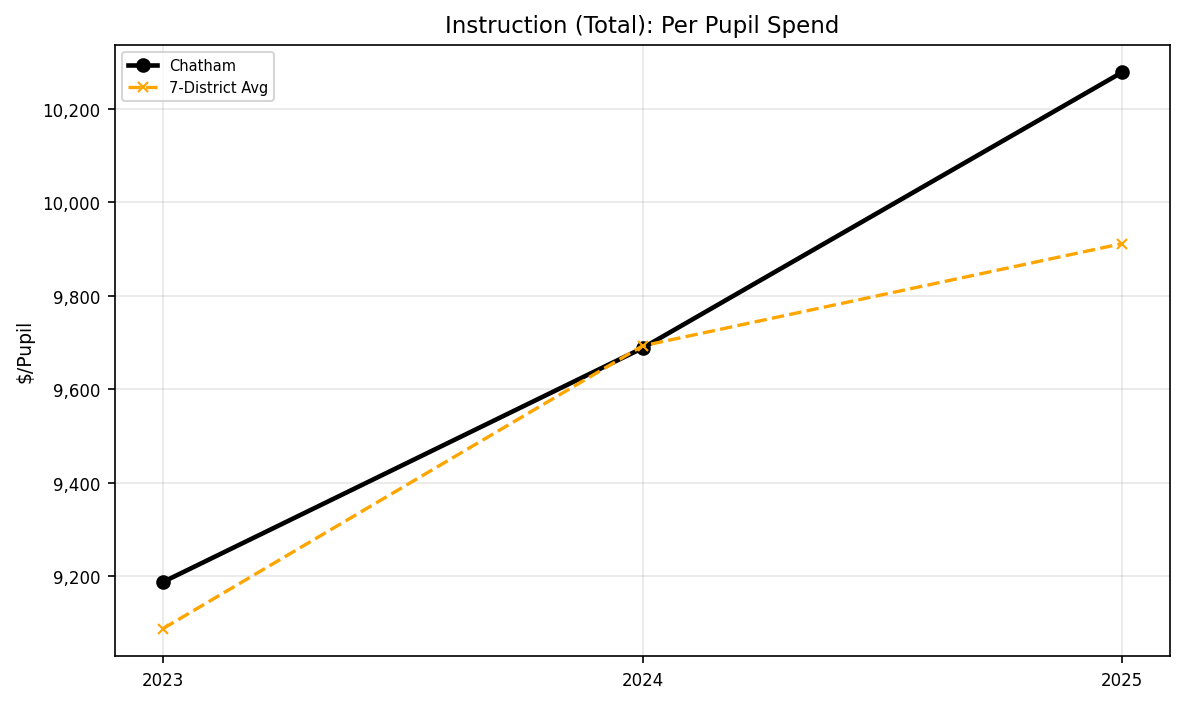
Instruction (Total)
Instruction spending trends upward and finishes 3rd of 7 in 2025.
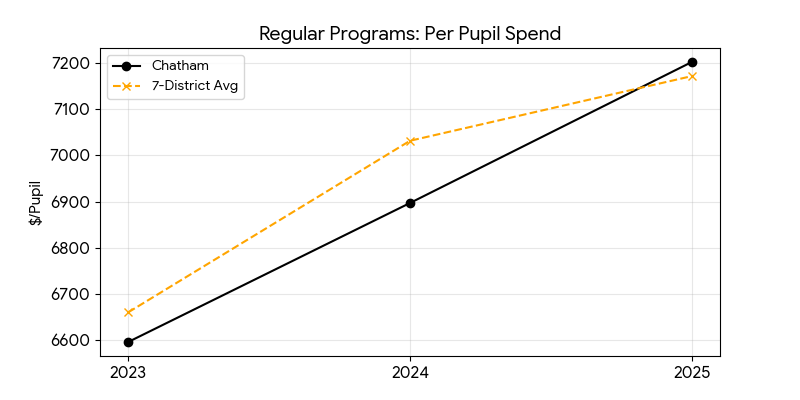
Regular Programs
Chatham is in the upper tier of the group on regular classroom spending.
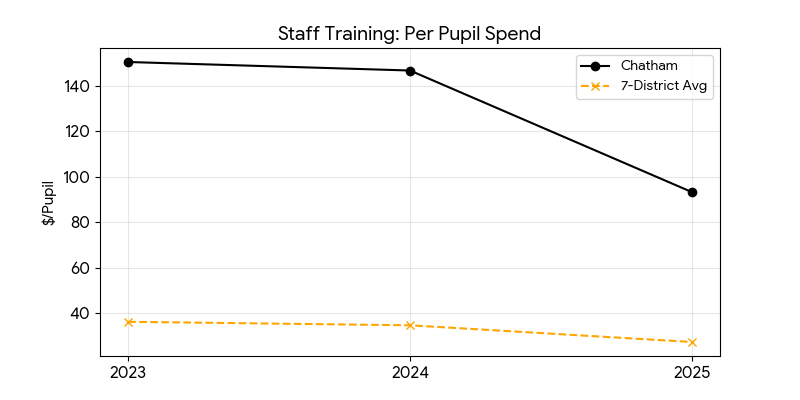
Staff Training
Chatham is 1st of 7 here, well above the peer average.
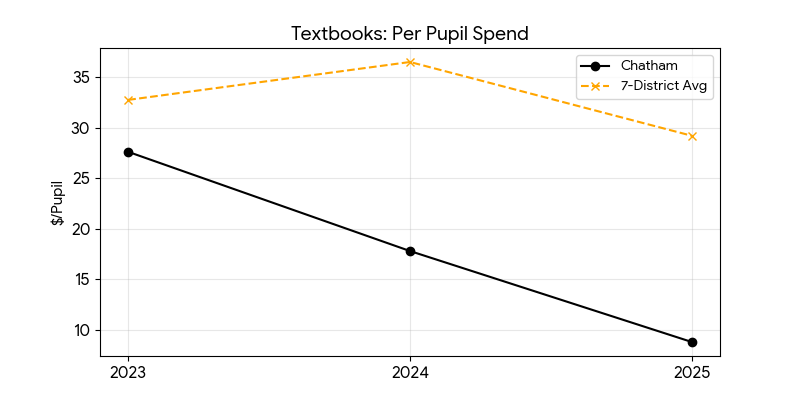
Textbooks
Textbook spending is toward the bottom of the peer group in 2025.
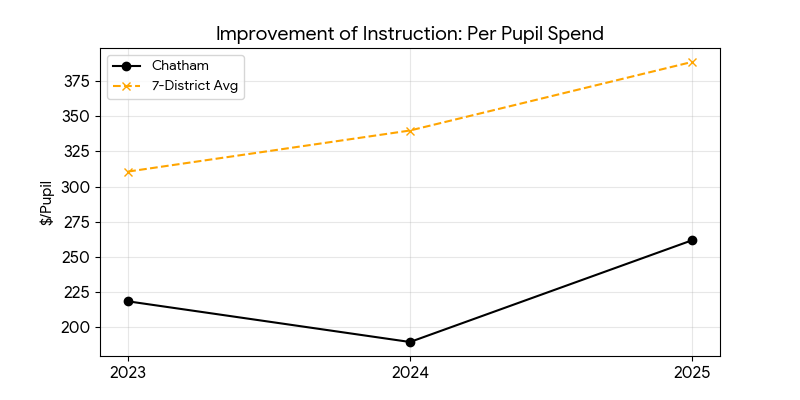
Improvement of Instruction
Chatham sits in the lower half of the group despite a 2025 rebound.
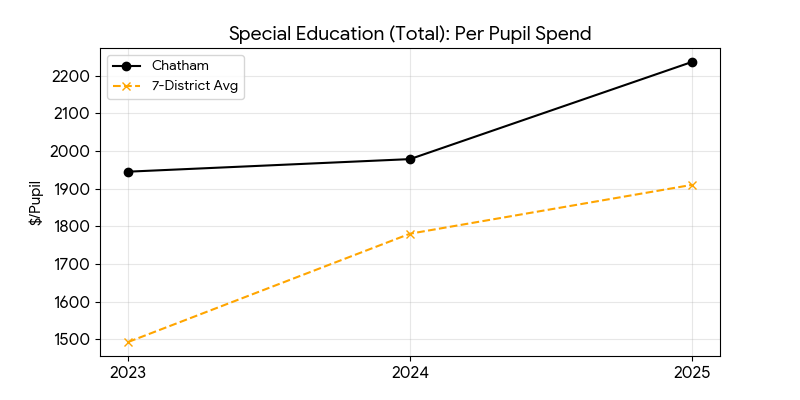
Special Education (Total)
Chatham ranks near the top of the peer group in overall special education spending.
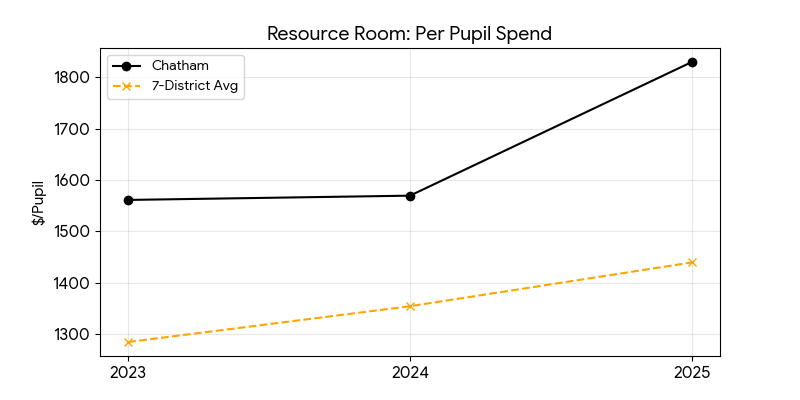
Resource Room
Chatham ranks 1st of 7 in 2025 and is notably above the average line.
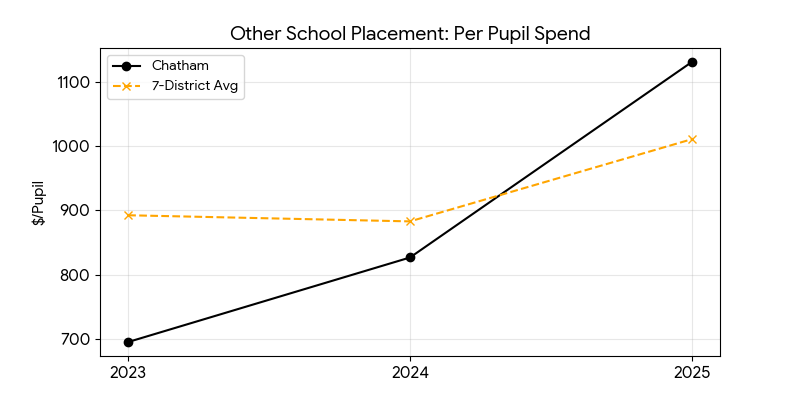
Other School Placement
Out-of-district placement spending rises sharply by 2025.
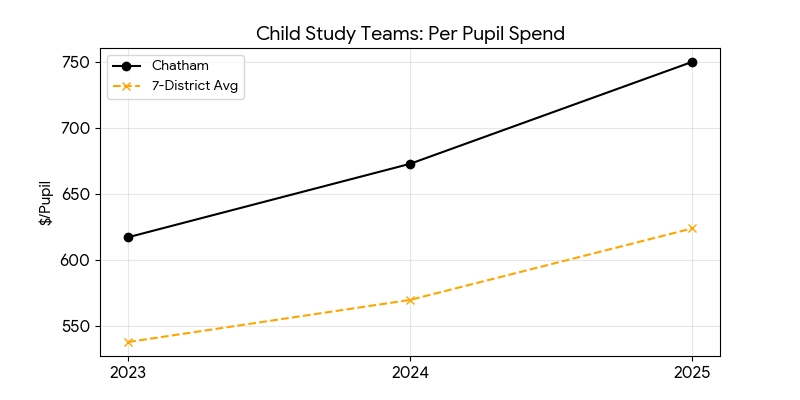
Child Study Teams
Chatham is above the peer average and 4th of 7 in 2025.
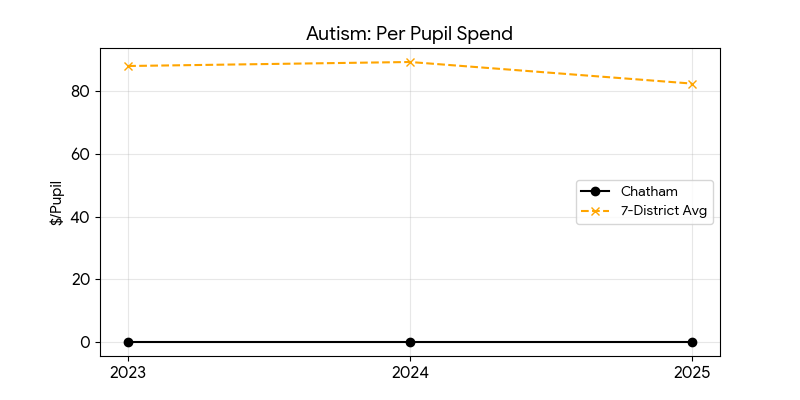
Autism
Chatham is tied for last at $0 per pupil in this specific line item.
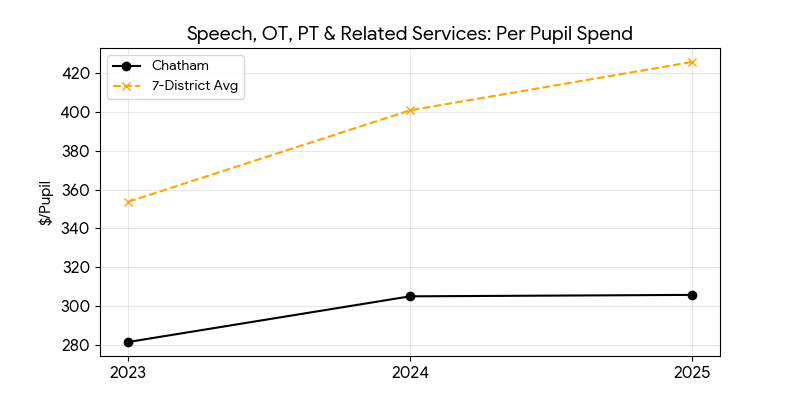
Speech, OT, PT & Related Services
Chatham is in the lower end of the peer group in this category.
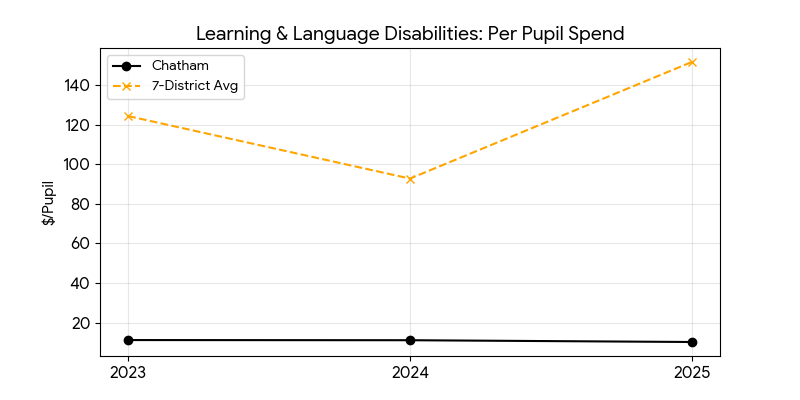
Learning & Language Disabilities
Chatham ranks last among the seven districts in this bucket.
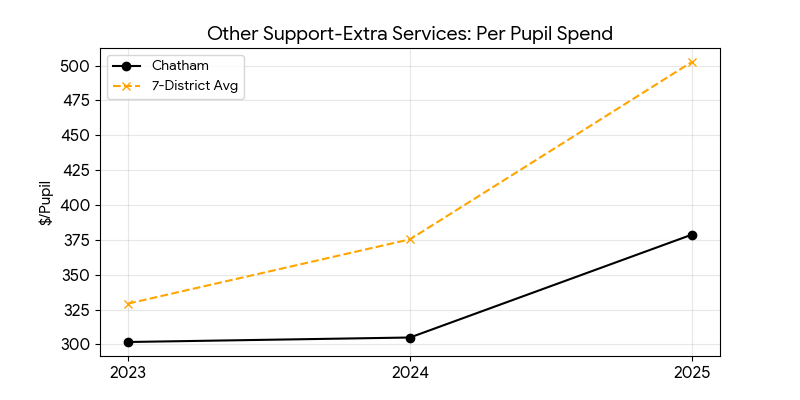
Other Support - Extra Services
Chatham remains below the peer average even after a 2025 increase.
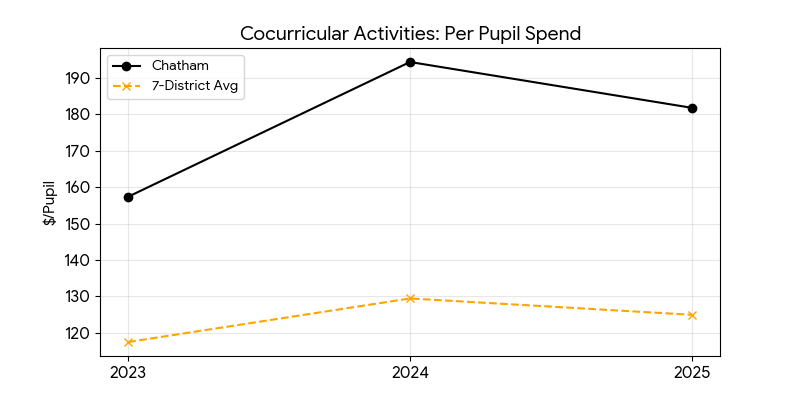
Cocurricular Activities
Chatham leads the peer group in this category.
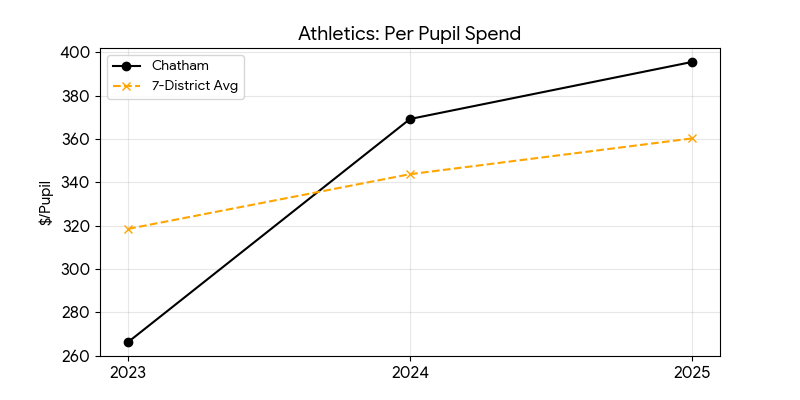
Athletics
Chatham ranks 3rd of 7 and finishes above the group average.
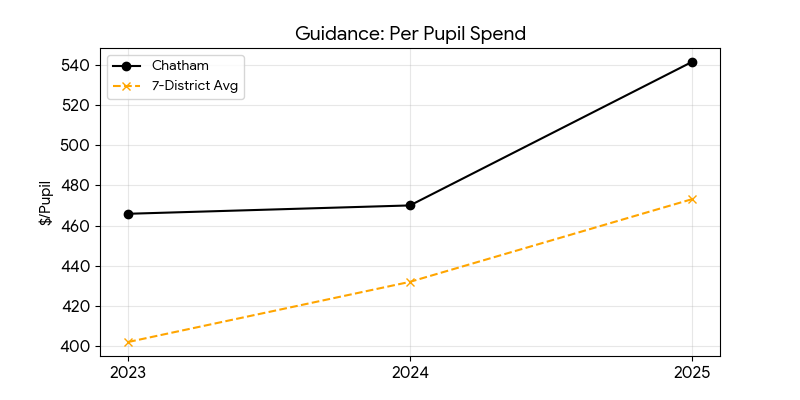
Guidance
Guidance is a relatively high-spend category for Chatham.
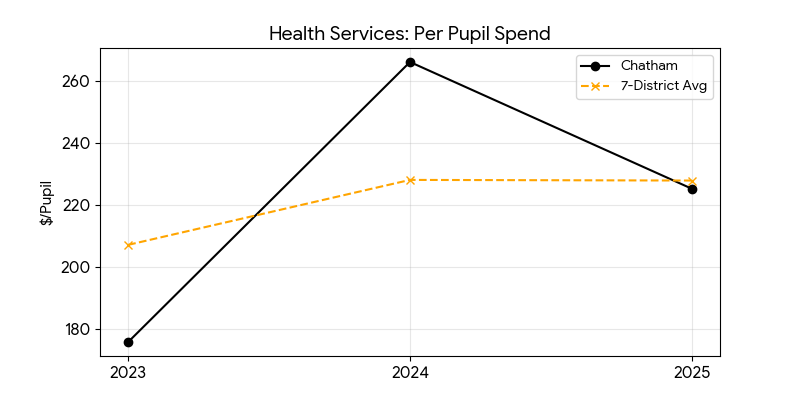
Health Services
Chatham finishes 3rd of 7 in 2025.
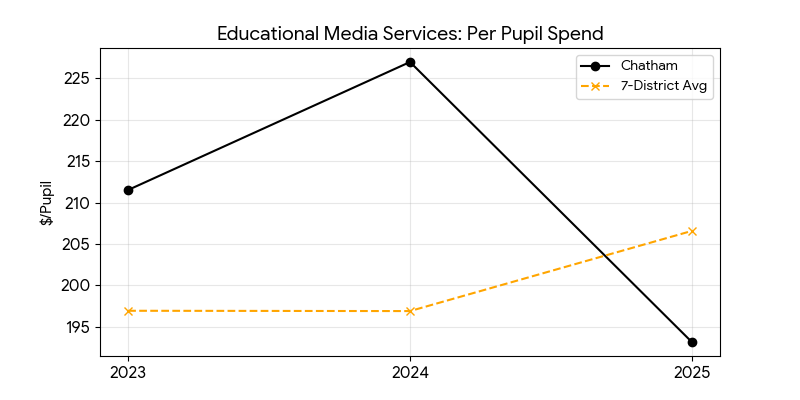
Educational Media Services
Library/media spending ends below the average line in 2025.
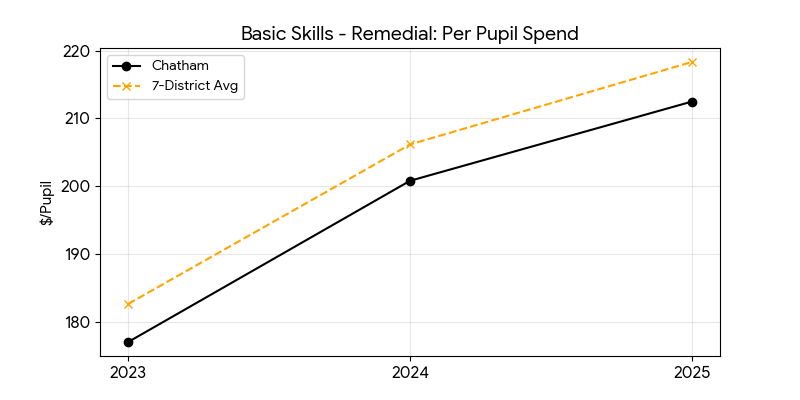
Basic Skills / Remedial
Chatham is above average and ranks 3rd of 7.
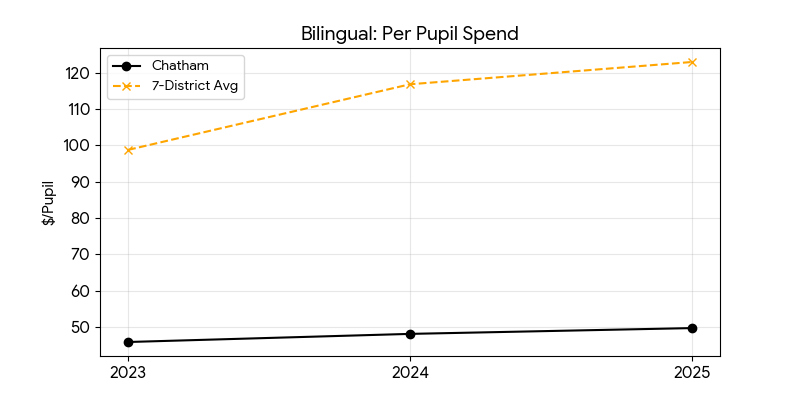
Bilingual Education
Chatham ranks last in the peer group in this line item.
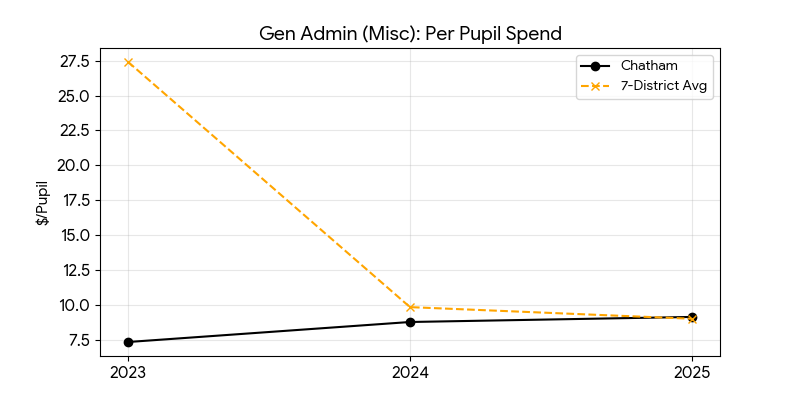
General Admin - Misc
This narrower general-admin line places Chatham 2nd of 7 in 2025.
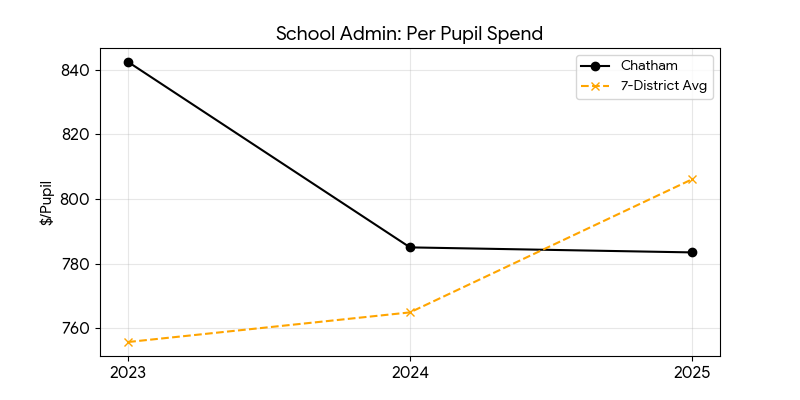
School Administration
School-admin spending is mid-to-lower pack relative to peers.
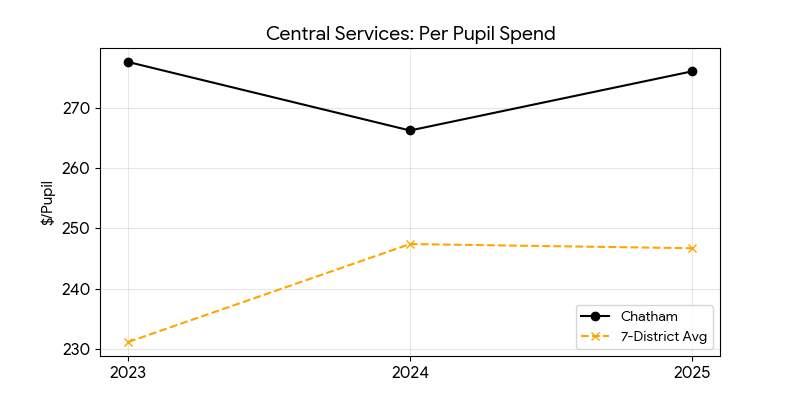
Central Services
Central services sit above the group average in all shown years.
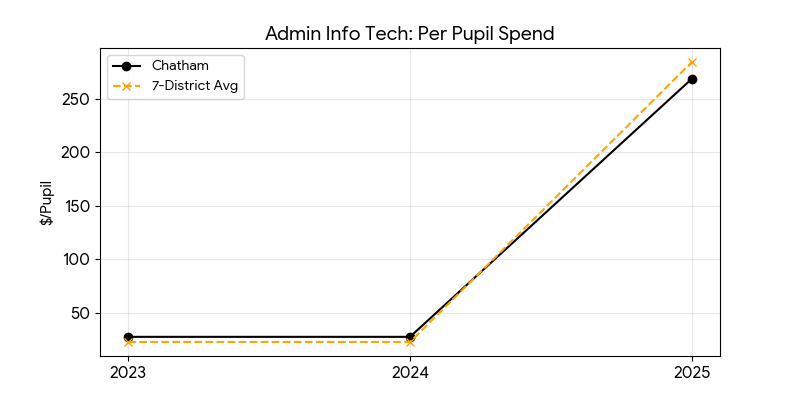
Administrative Info Tech
This line jumps sharply in 2025 for both Chatham and the peer average.
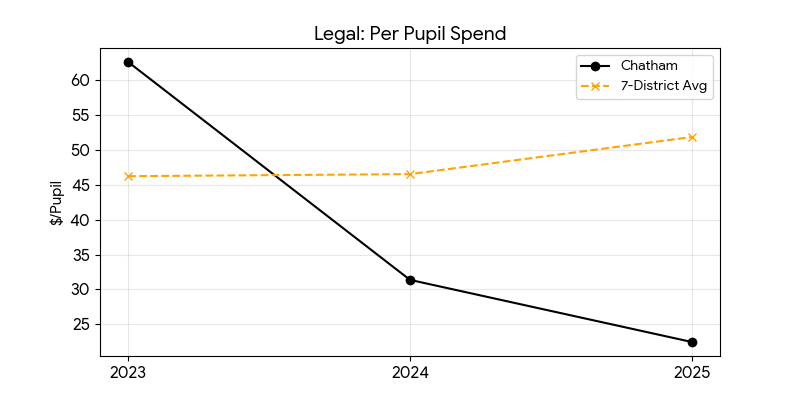
Legal Fees
Chatham trends down and lands below the peer average in 2025.
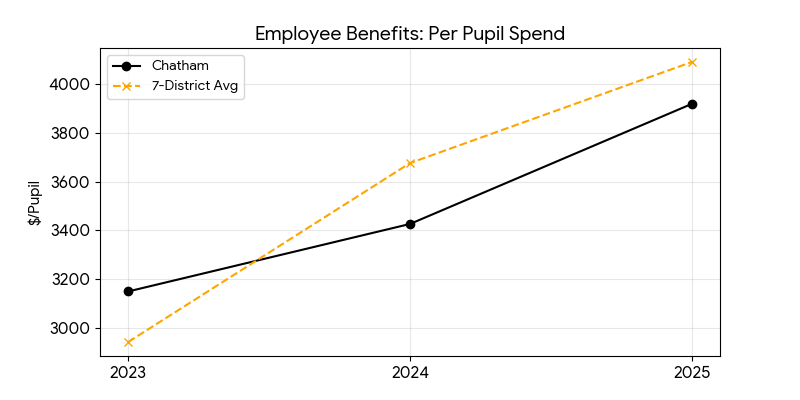
Employee Benefits
Benefits spending rises sharply by 2025, though Chatham still sits below the average line.
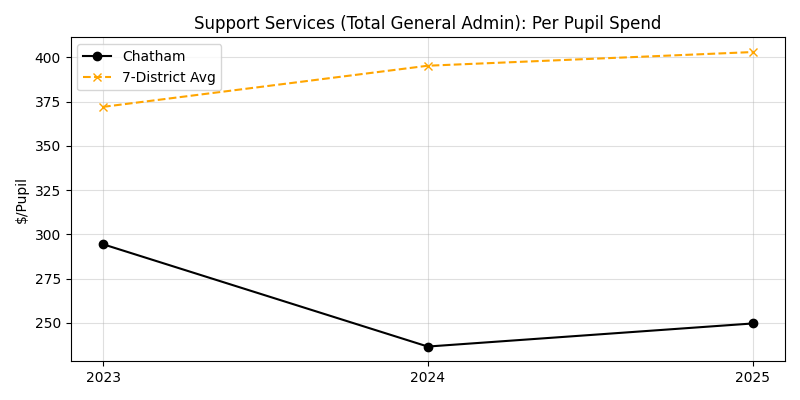
Support Services (Total General Admin)
This narrower support-services administration sub-account places Chatham 7th of 7 in 2025.
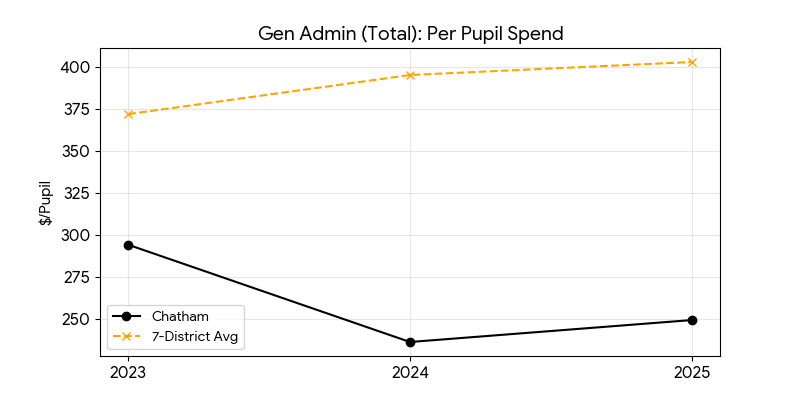
Total Administration
Total administration places Chatham 4th of 7 in 2025.
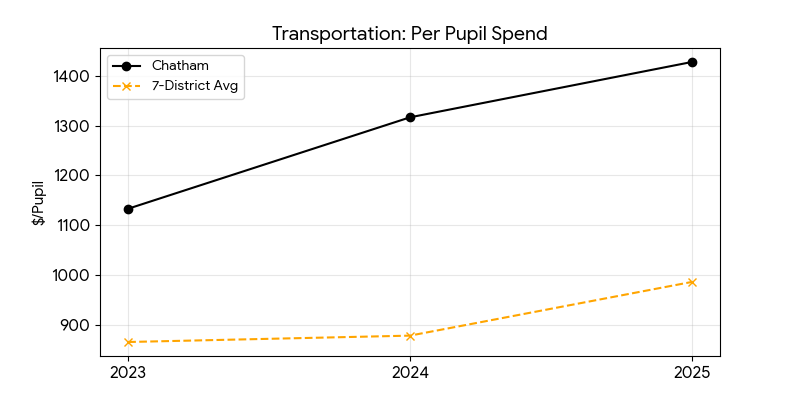
Transportation
Transportation is one of Chatham’s clearest high-cost categories and ranks 1st of 7.
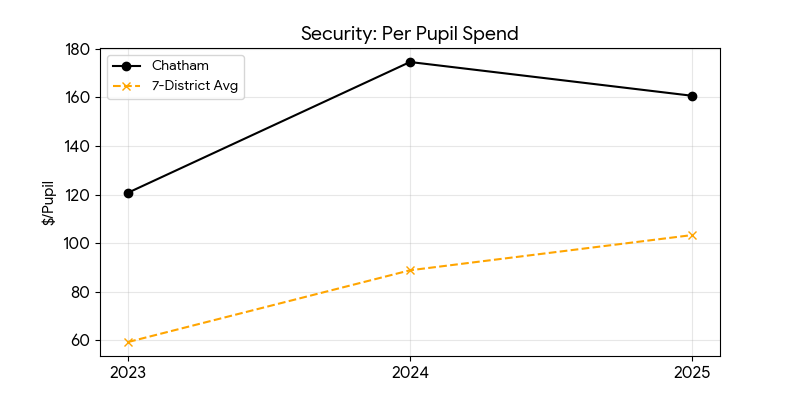
Security
Security spending is also elevated relative to peers.
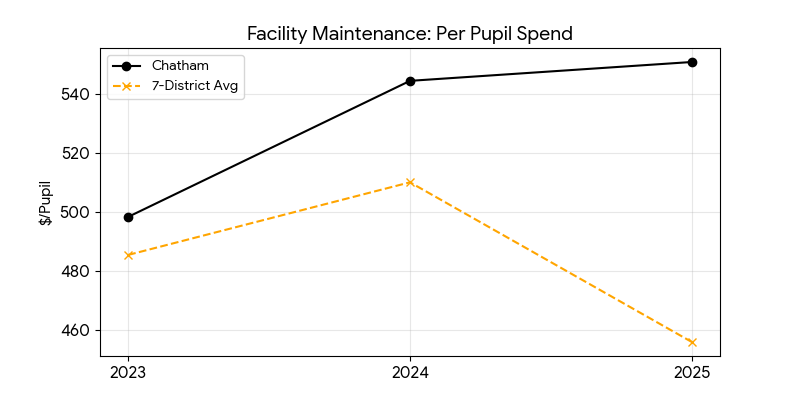
Facility Maintenance
Chatham ranks 3rd of 7 and remains above the peer average in 2025.
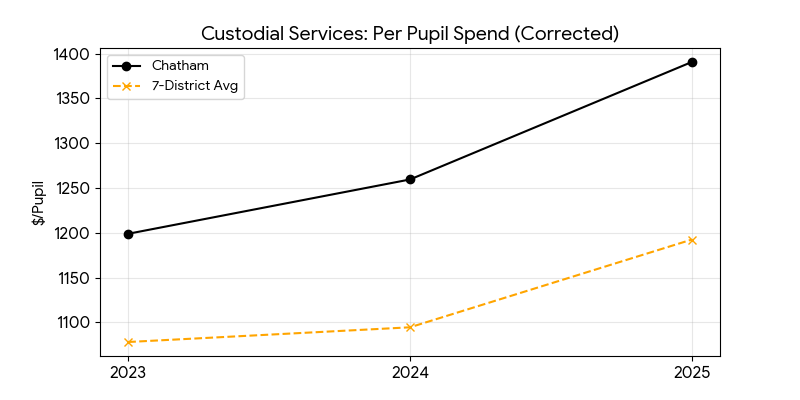
Custodial Services
Chatham ranks 2nd of 7 here.
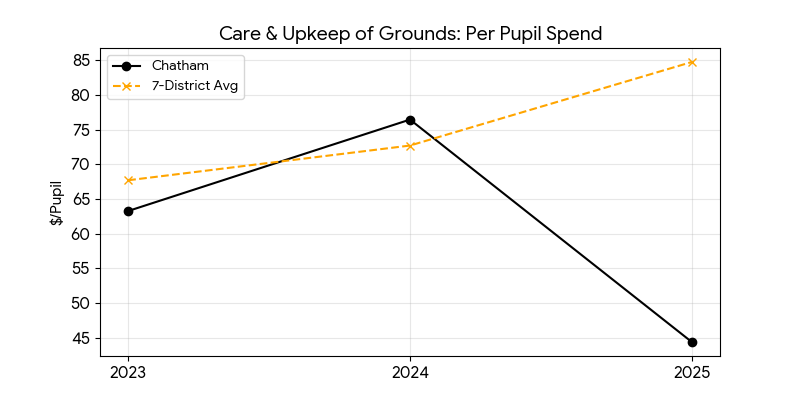
Care & Upkeep of Grounds
Chatham drops to the bottom of the group in this category by 2025.