Millburn School District ACFR Profile
This page is designed to help residents walk into budget discussions with a cleaner apples-to-apples view of how Millburn compares with the six other districts on our ACFR dashboard. The rankings below are based on verified 2025 per-pupil figures unless otherwise noted. A rank of 1st means the highest per-student spending in that category among the seven-district peer group.
1. Total District Overview
Millburn sits near the top of the peer group overall. Its profile is driven by high core instructional spending and several upper-tier operating and administrative categories, even though some support-service lines rank much lower.
Top-Line Position
- Total Cost Per Pupil: 2nd of 7 ($30,187)
- Instruction (All Categories): 2nd of 7 ($10,573)
- Total Administration: 3rd of 7
Questions Residents Can Ask
- If Millburn is 2nd overall and 2nd in instruction, which categories most clearly drive its position above most peers?
- Which top-ranked lines reflect durable priorities, and which may reflect coding or one-time cost structure?
- Where has Millburn moved furthest away from the peer average over time?
2. Core Instruction & Classroom Spending
This section captures broad classroom spending and related instructional support categories. Millburn’s classroom profile is one of the stronger ones in the peer group, but rank alone still does not prove value.
Where Millburn Ranks
- Regular Programs: 1st of 7
- Staff Training: 3rd of 7
- Textbooks: 2nd of 7
- Improvement of Instruction: 4th of 7
What Stands Out
Millburn is especially high in core classroom spending itself. It ranks 1st of 7 in regular programs, 2nd of 7 in textbooks, and 2nd of 7 in instruction overall. If academic results are strong, that profile may be easier to defend than high non-classroom spending. But residents should still ask what the district believes those dollars are producing.
3. Special Education Services
Millburn’s special education profile is much more mixed than its instructional profile, with some middle-tier and lower-tier rankings despite high overall district spending.
Where Millburn Ranks
- Special Education (Total): 6th of 7
- Resource Room: 6th of 7
- Autism: 3rd of 7
- Child Study Teams: 3rd of 7
- Speech, OT, PT & Related Services: 5th of 7
- Learning & Language Disabilities: 6th of 7
- Other Support (Extra Services): 2nd of 7
- Other School Placement: 5th of 7
What Stands Out
Millburn is not a top-tier spender in total special education. It ranks 6th of 7 in total special education, resource room, and learning/language disabilities, even though it ranks 2nd of 7 in other support (extra services) and 3rd of 7 in both autism and child study teams. That suggests the district’s cost profile here is concentrated in selected buckets rather than running high across the board.
4. Student Activities & Support Services
These categories show how Millburn compares on counseling, student activities, health services, library/media, bilingual support, and remedial services.
Where Millburn Ranks
- Athletics: 7th of 7
- Guidance: 6th of 7
- Health Services: 6th of 7
- Educational Media Services (Library): 7th of 7
- Bilingual Education: 4th of 7
- Cocurricular Activities: 5th of 7
- Basic Skills / Remedial: 2nd of 7
What Stands Out
This is one of Millburn’s weaker sections relative to peers. Athletics and educational media services both rank 7th of 7, while guidance and health services each rank 6th of 7. Basic skills/remedial is the notable exception at 2nd of 7. That gives Millburn a different profile from districts that spend heavily across a broader set of non-classroom categories.
5. Administration & Technology
Millburn’s administrative profile includes some clearly elevated lines, but those should be treated as costs to explain, not strengths to admire.
Where Millburn Ranks
- Gen Admin (Total Sub-Account): 5th of 7
- Employee Benefits: 6th of 7
- Admin Information Tech: 6th of 7
- Legal Fees: 6th of 7
- School Administration: 1st of 7
- Central Services: 2nd of 7
- Gen Admin (Misc): 5th of 7
What Stands Out
Millburn ranks 1st of 7 in school administration and 2nd of 7 in central services, but it is much lower in admin information tech, legal fees, employee benefits, and the broader gen admin total bucket. That makes this a layered administrative profile, not a simple across-the-board overhead pattern.
6. Operations, Safety & Maintenance
These categories capture the cost of transporting students, maintaining buildings and grounds, security, and custodial operations. High rankings here are costs to justify, not accomplishments by themselves.
Where Millburn Ranks
- Care & Upkeep of Grounds: 2nd of 7
- Transportation: 3rd of 7
- Facility Maintenance: 1st of 7
- Security: 3rd of 7
- Custodial Services: 1st of 7
What Stands Out
Facility maintenance and custodial services are Millburn’s clearest operations outliers, with grounds and transportation also ranking near the top. Those are not wins on their own. They are cost signals that deserve explanation, especially in a district already ranking near the top overall.
Trend Charts
These charts show not just where Millburn ranks in 2025, but how its spending has moved over time relative to the seven-district average.
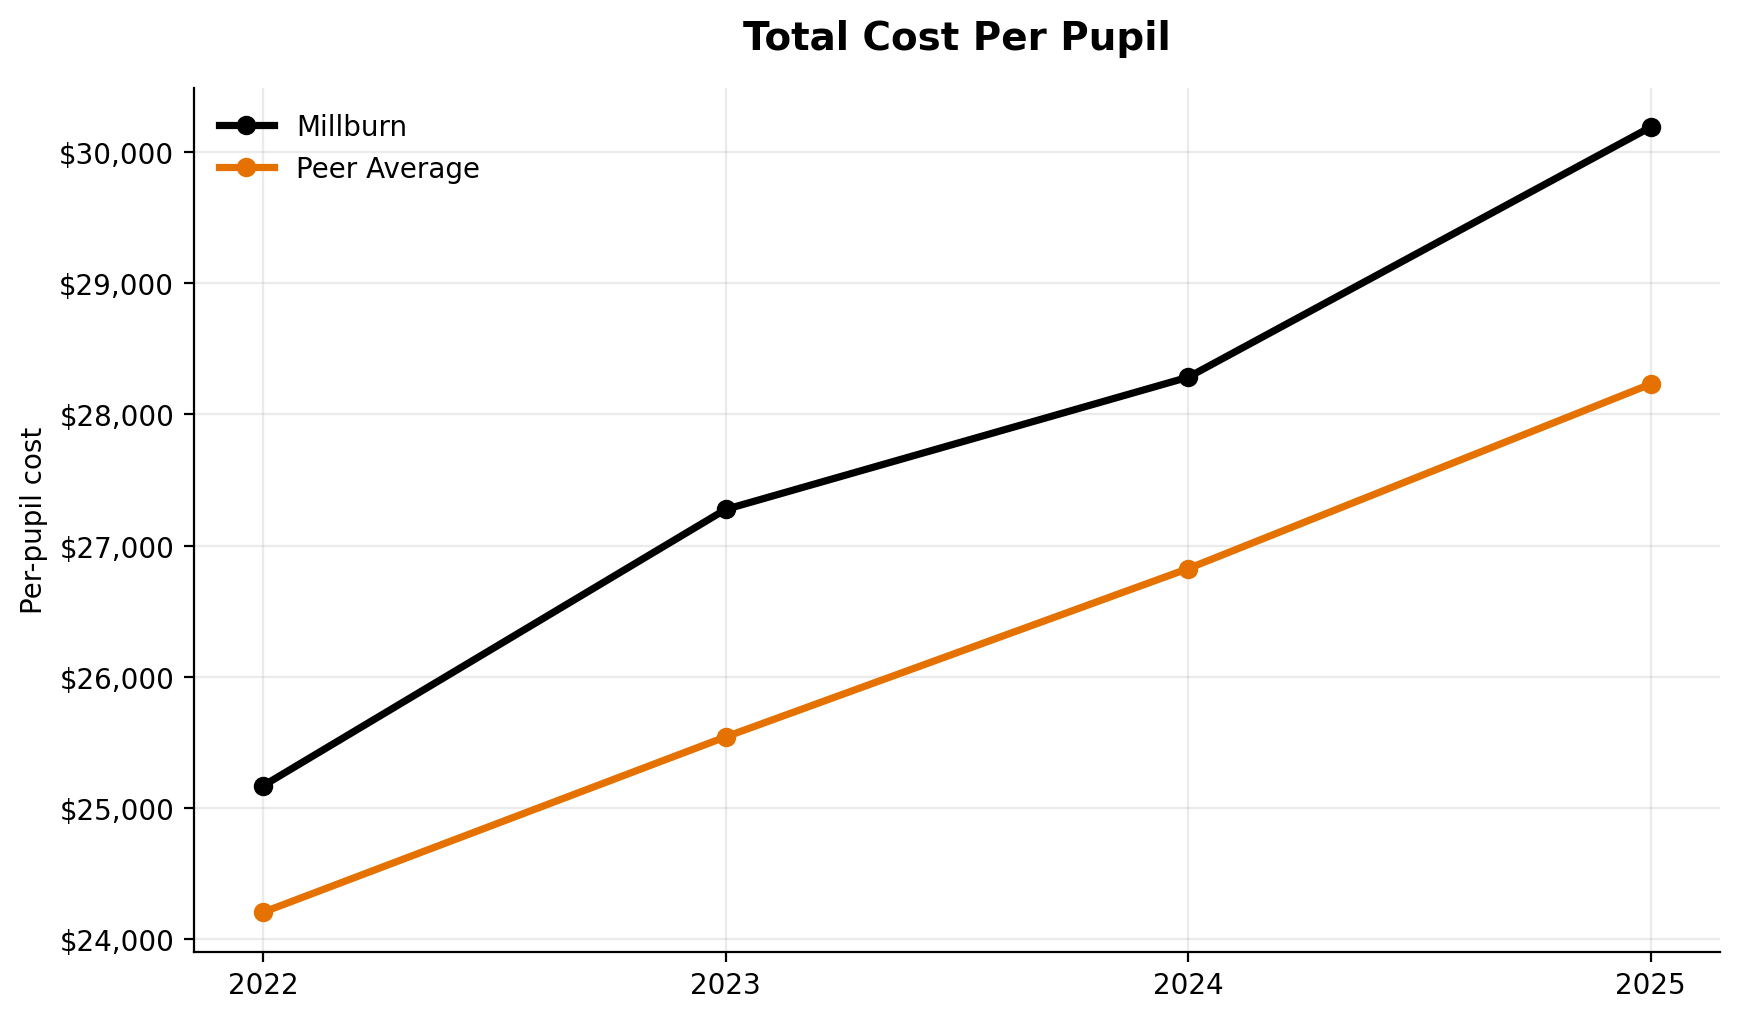
Total Cost Per Pupil
Millburn ranks 2nd of 7 overall on total per-pupil cost.
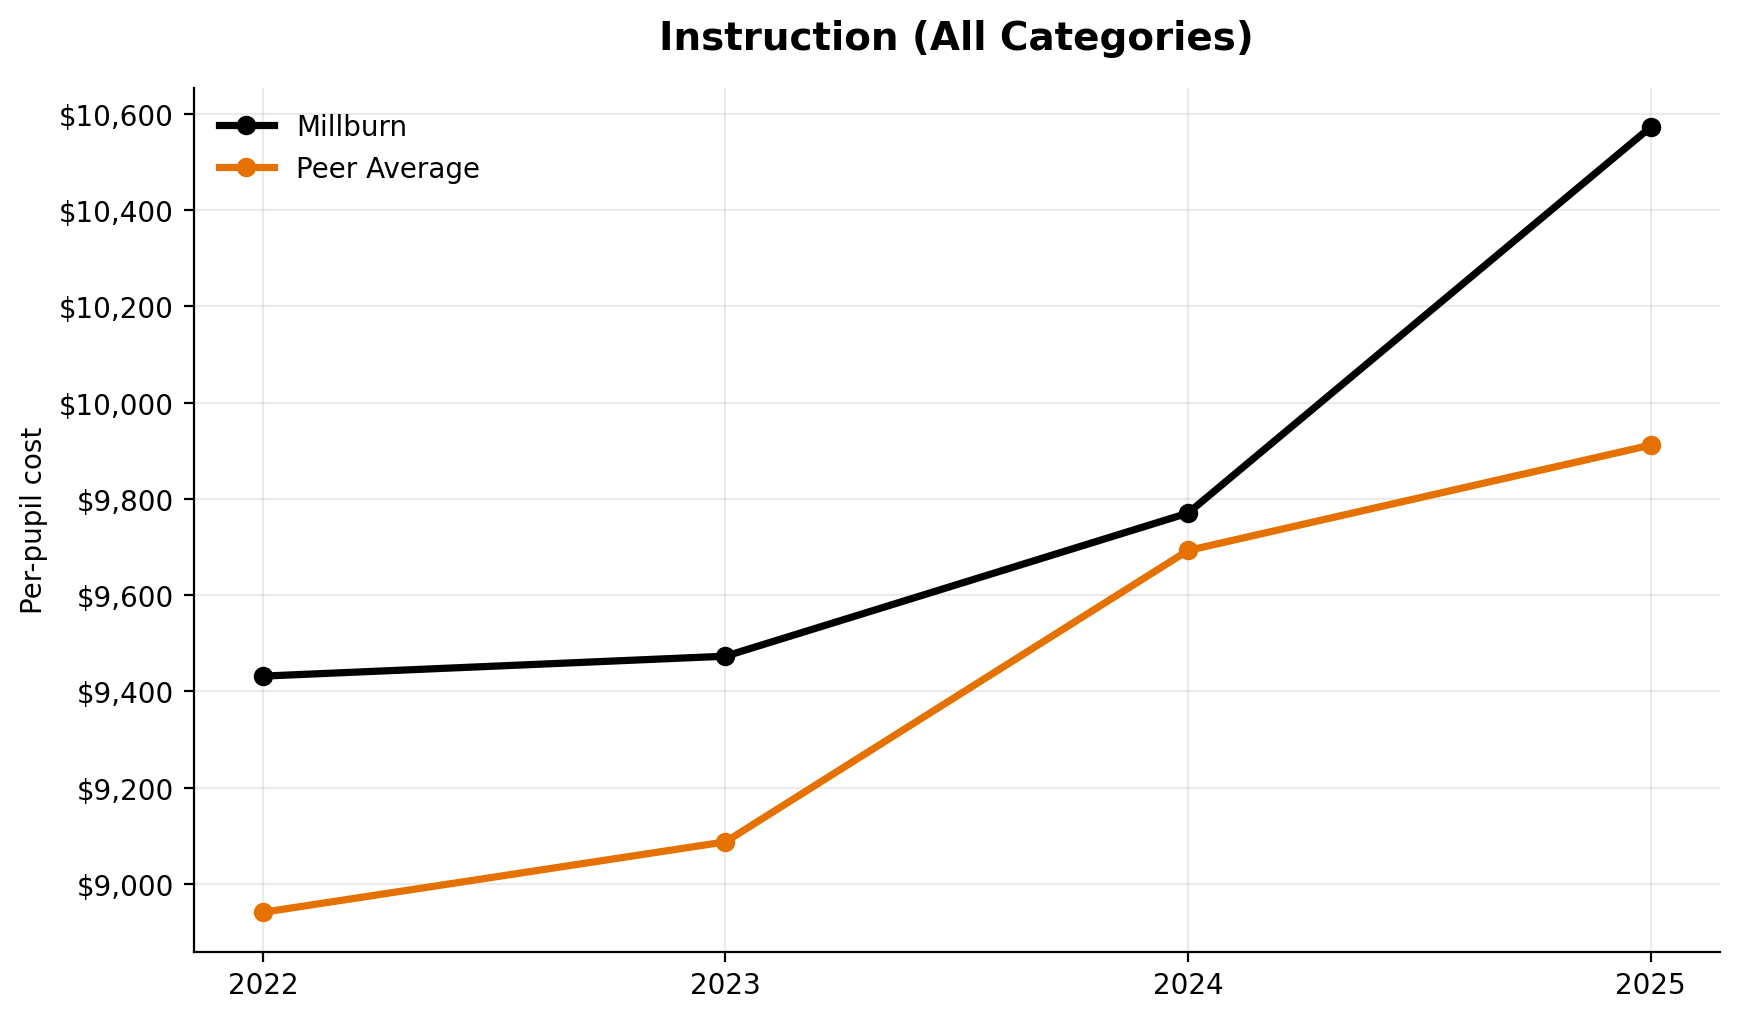
Instruction (All Categories)
Total instruction ranks 2nd of 7 in 2025.
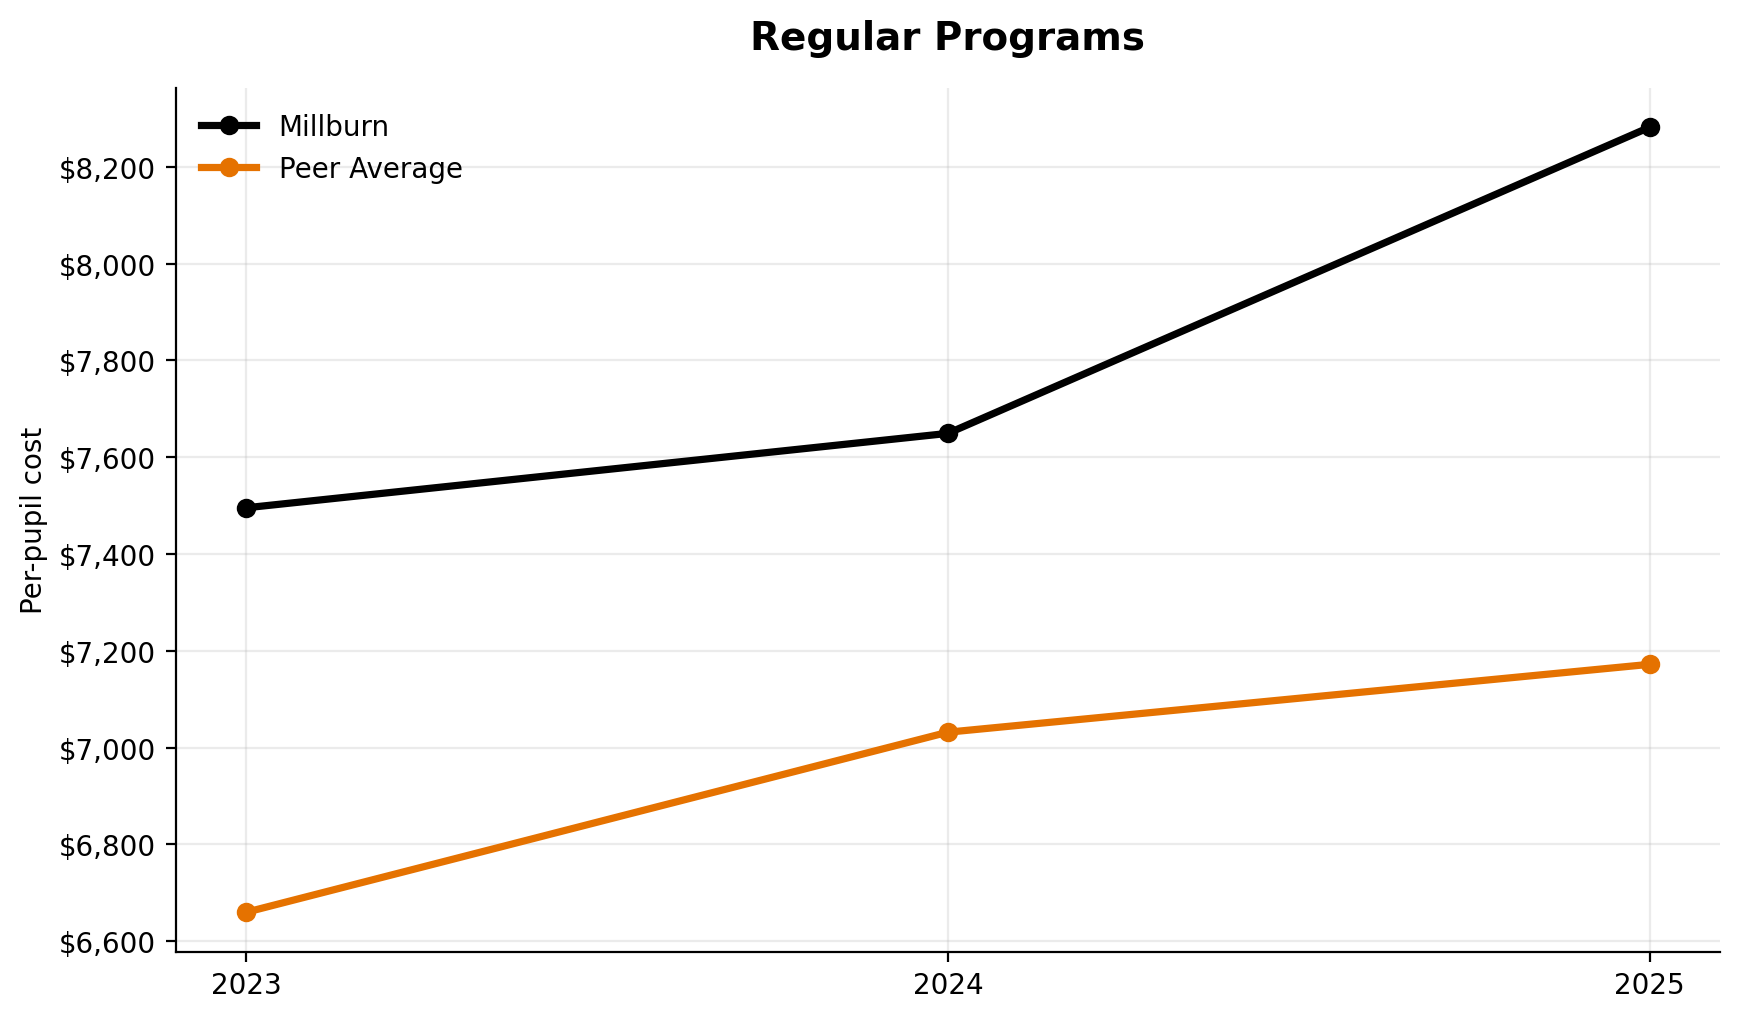
Regular Programs
Millburn ranks 1st of 7 in regular classroom instruction.
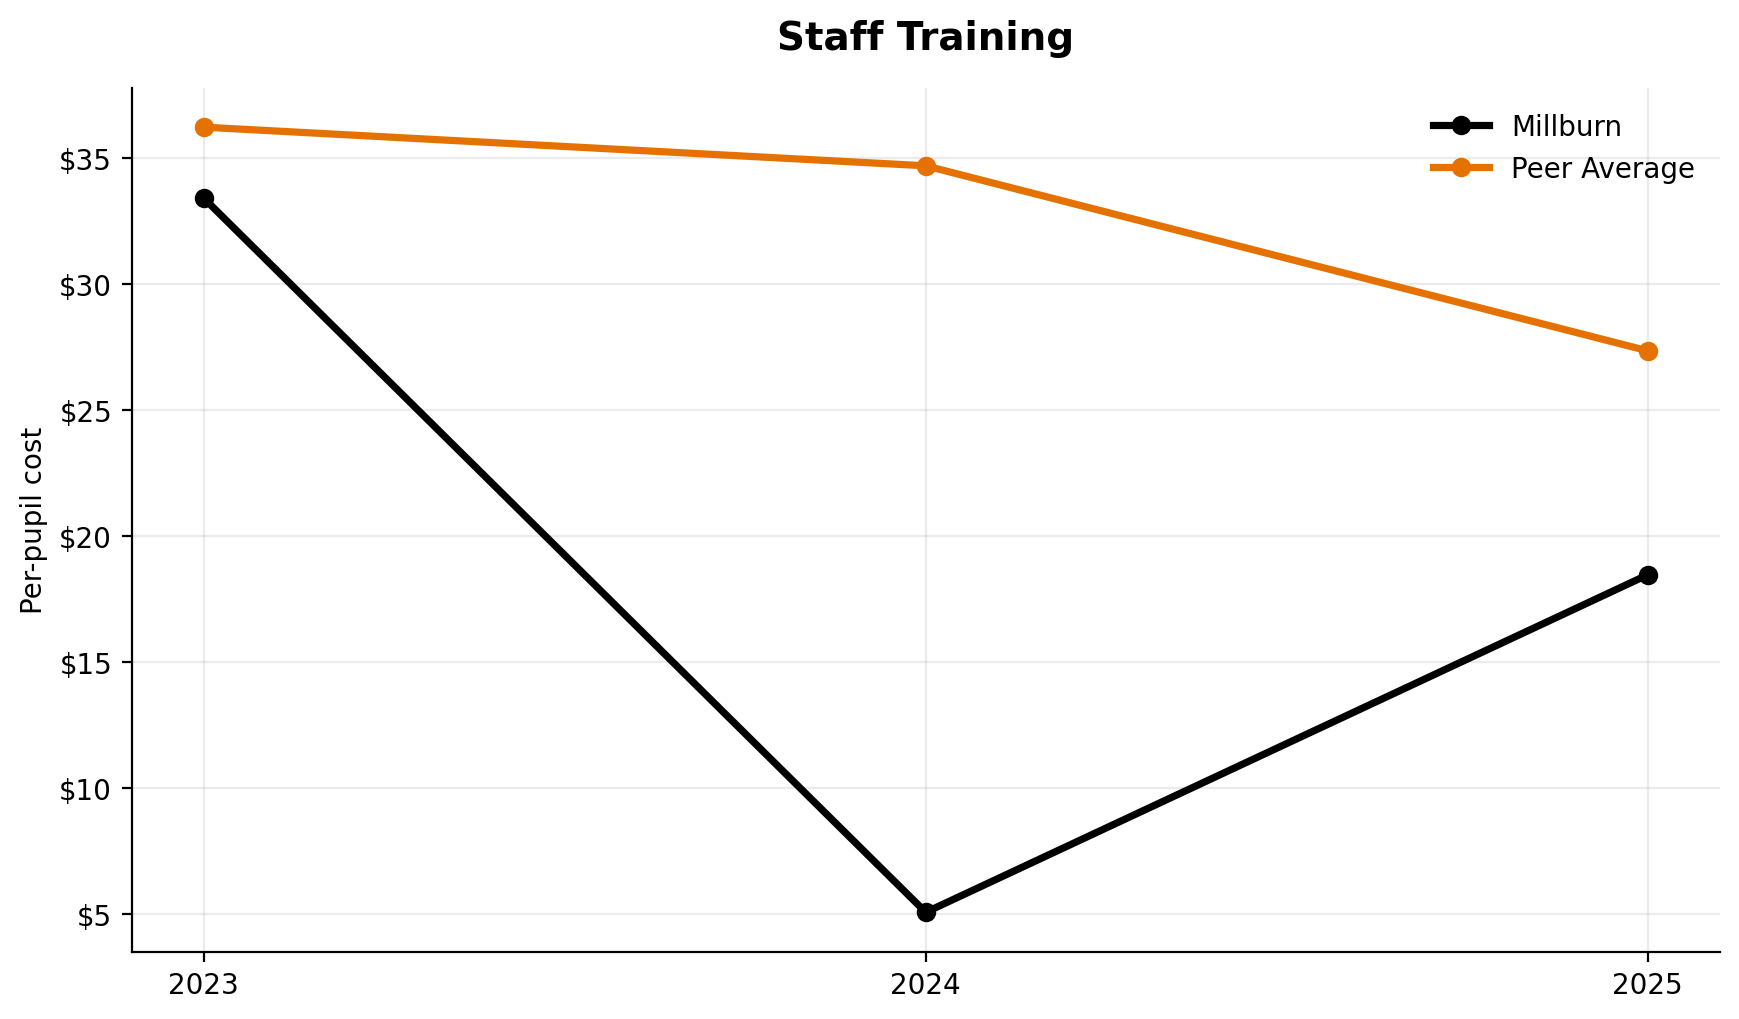
Staff Training
Staff training lands 3rd of 7.
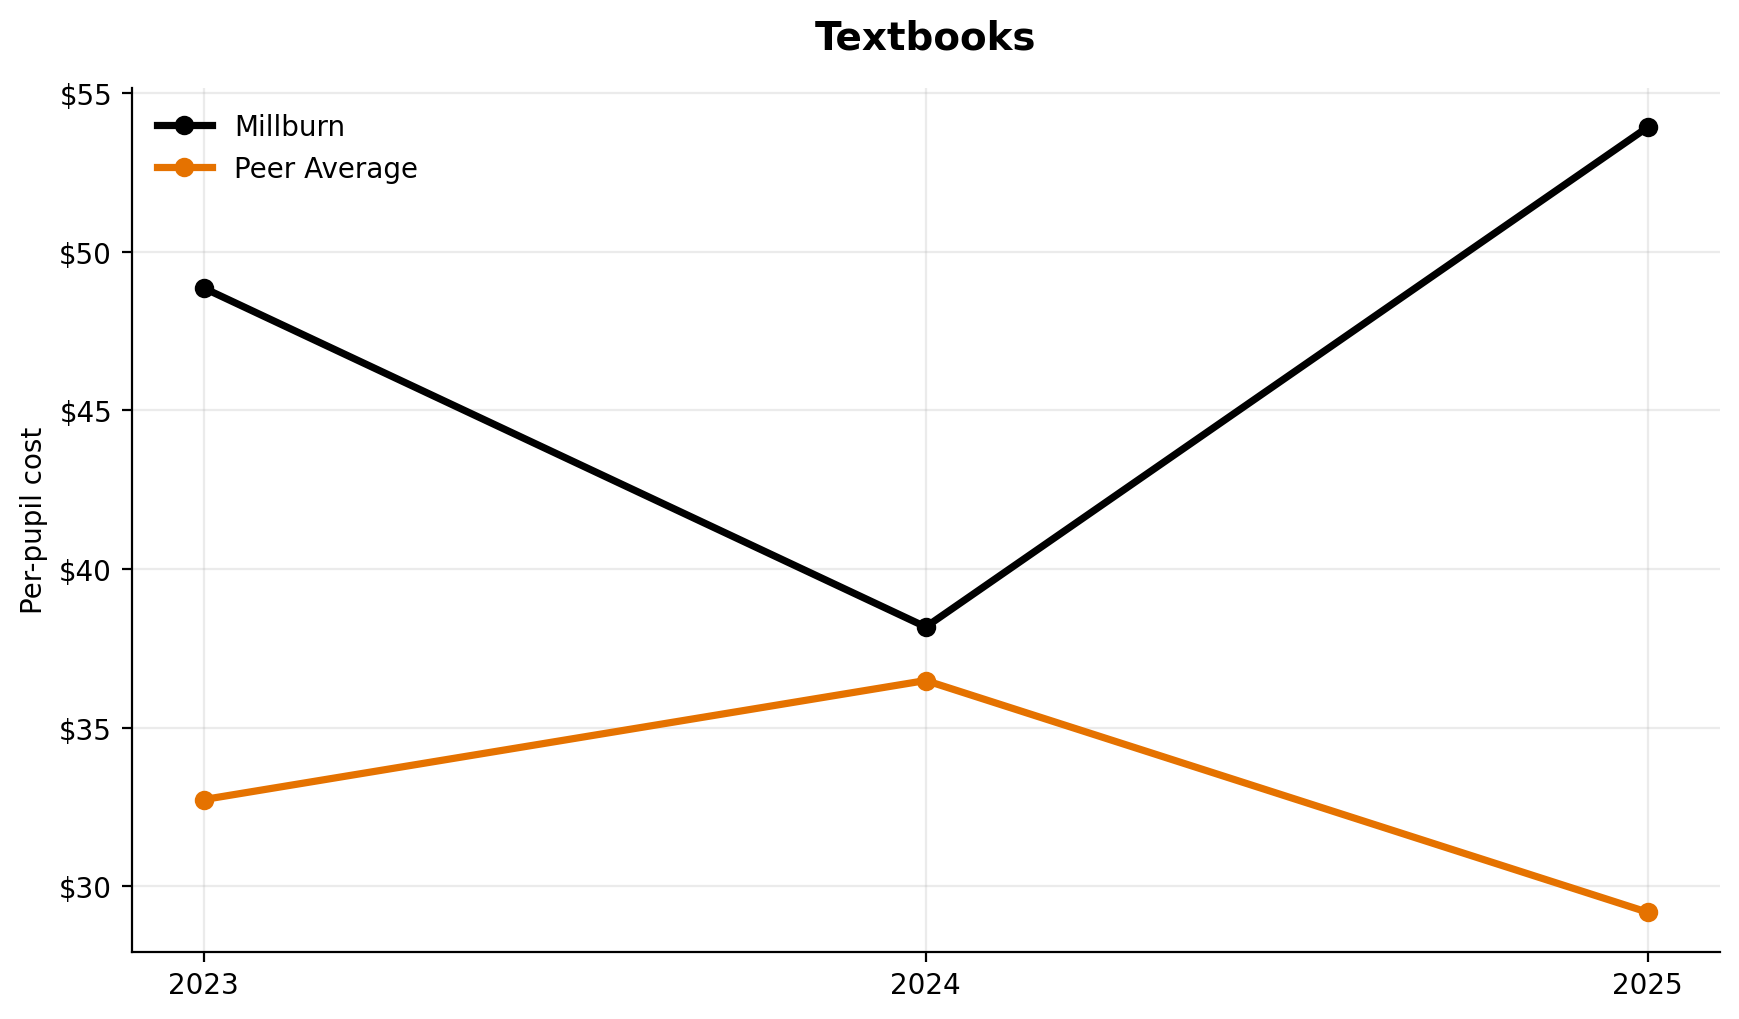
Textbooks
Textbook spending ranks 2nd of 7.
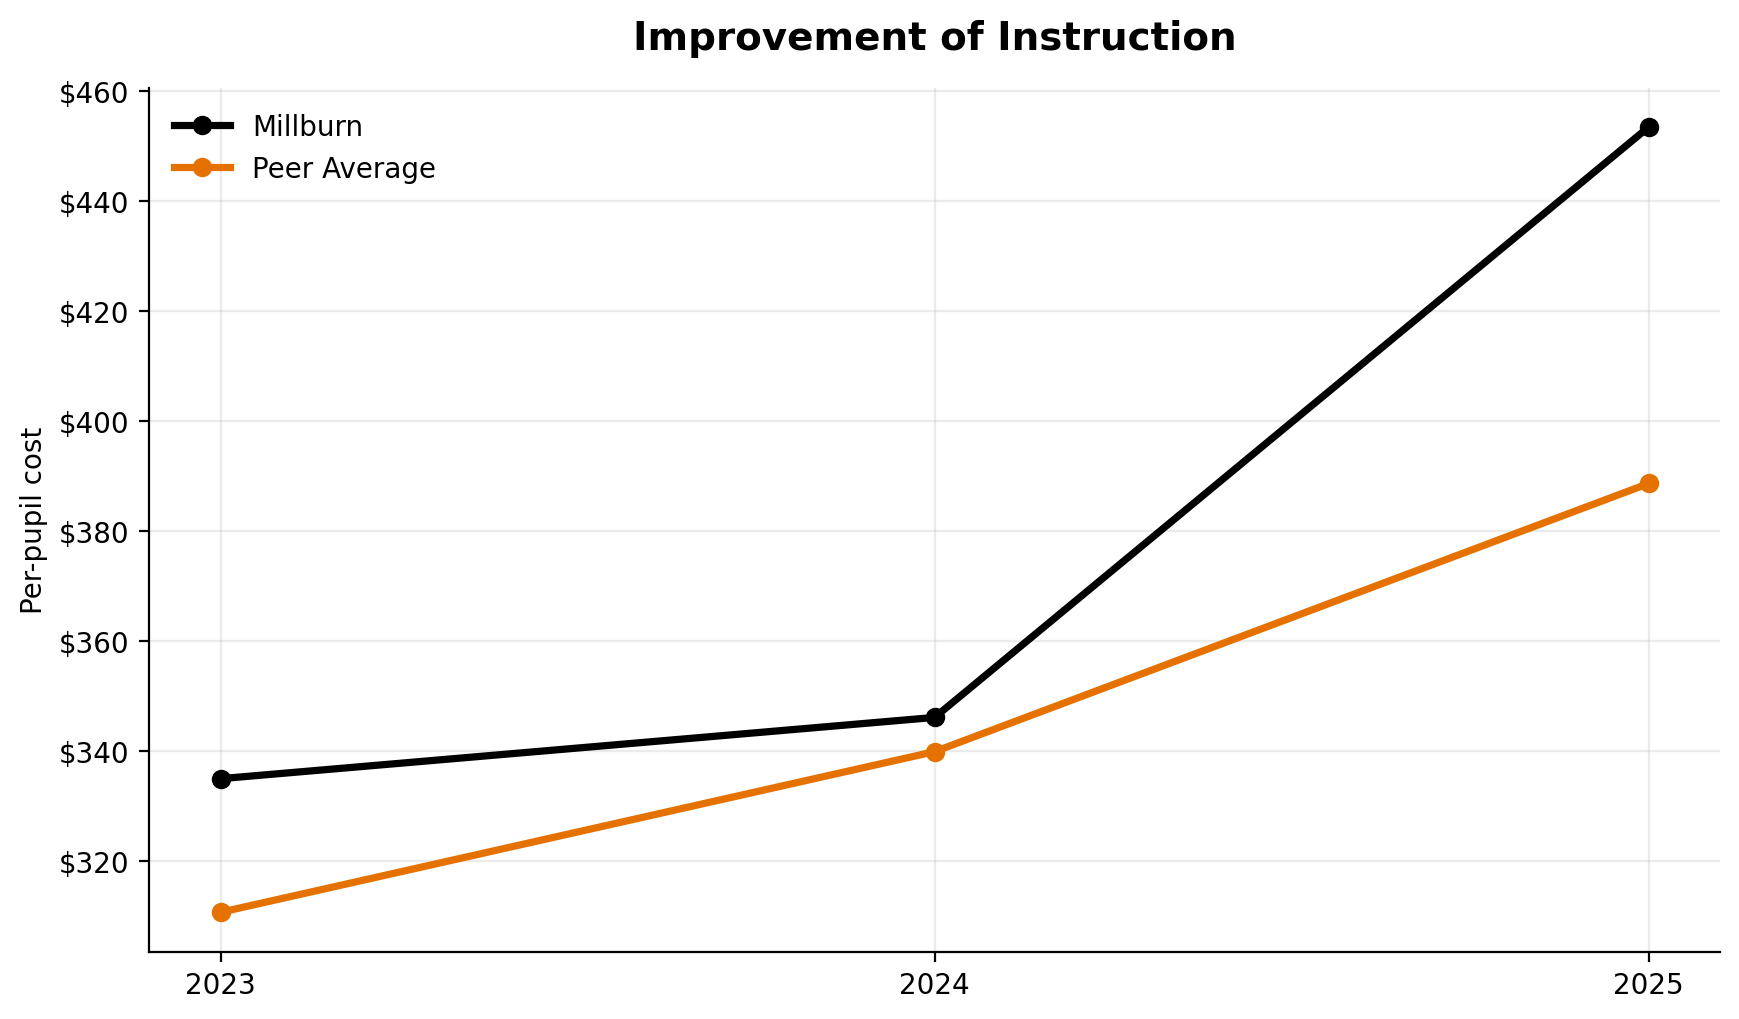
Improvement of Instruction
Millburn ranks 4th of 7 in this category.
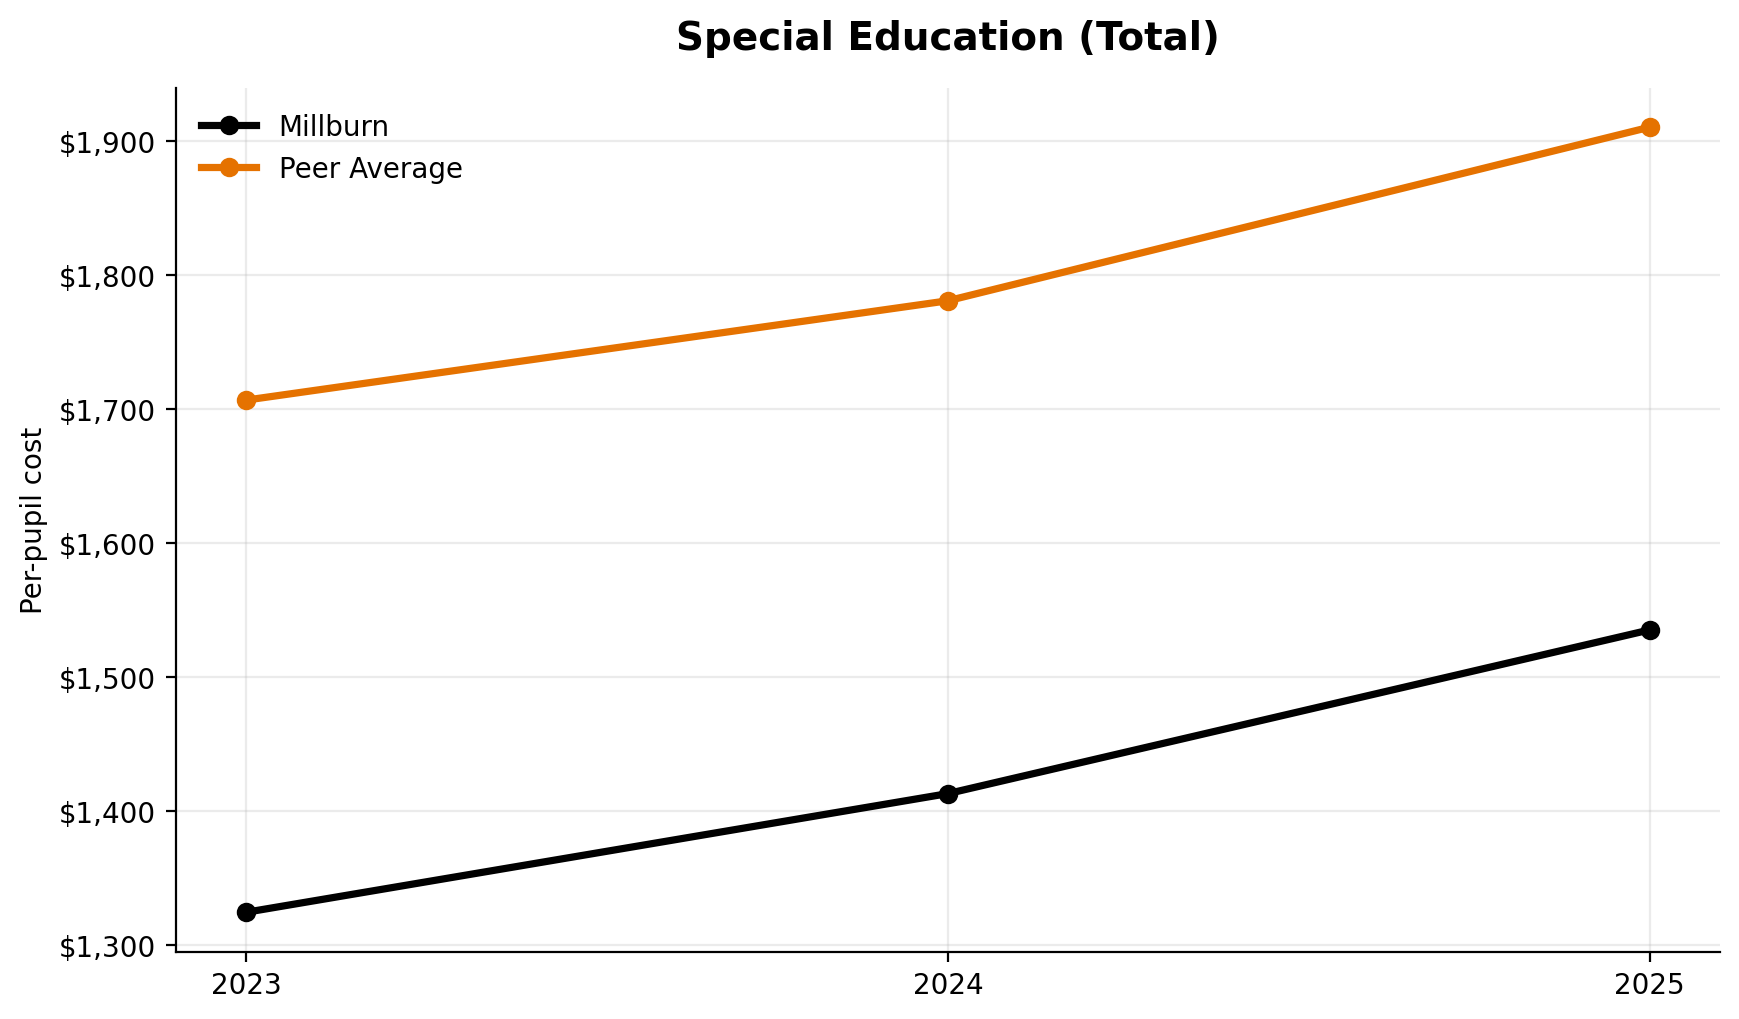
Special Education (Total)
Total special education ranks 6th of 7.
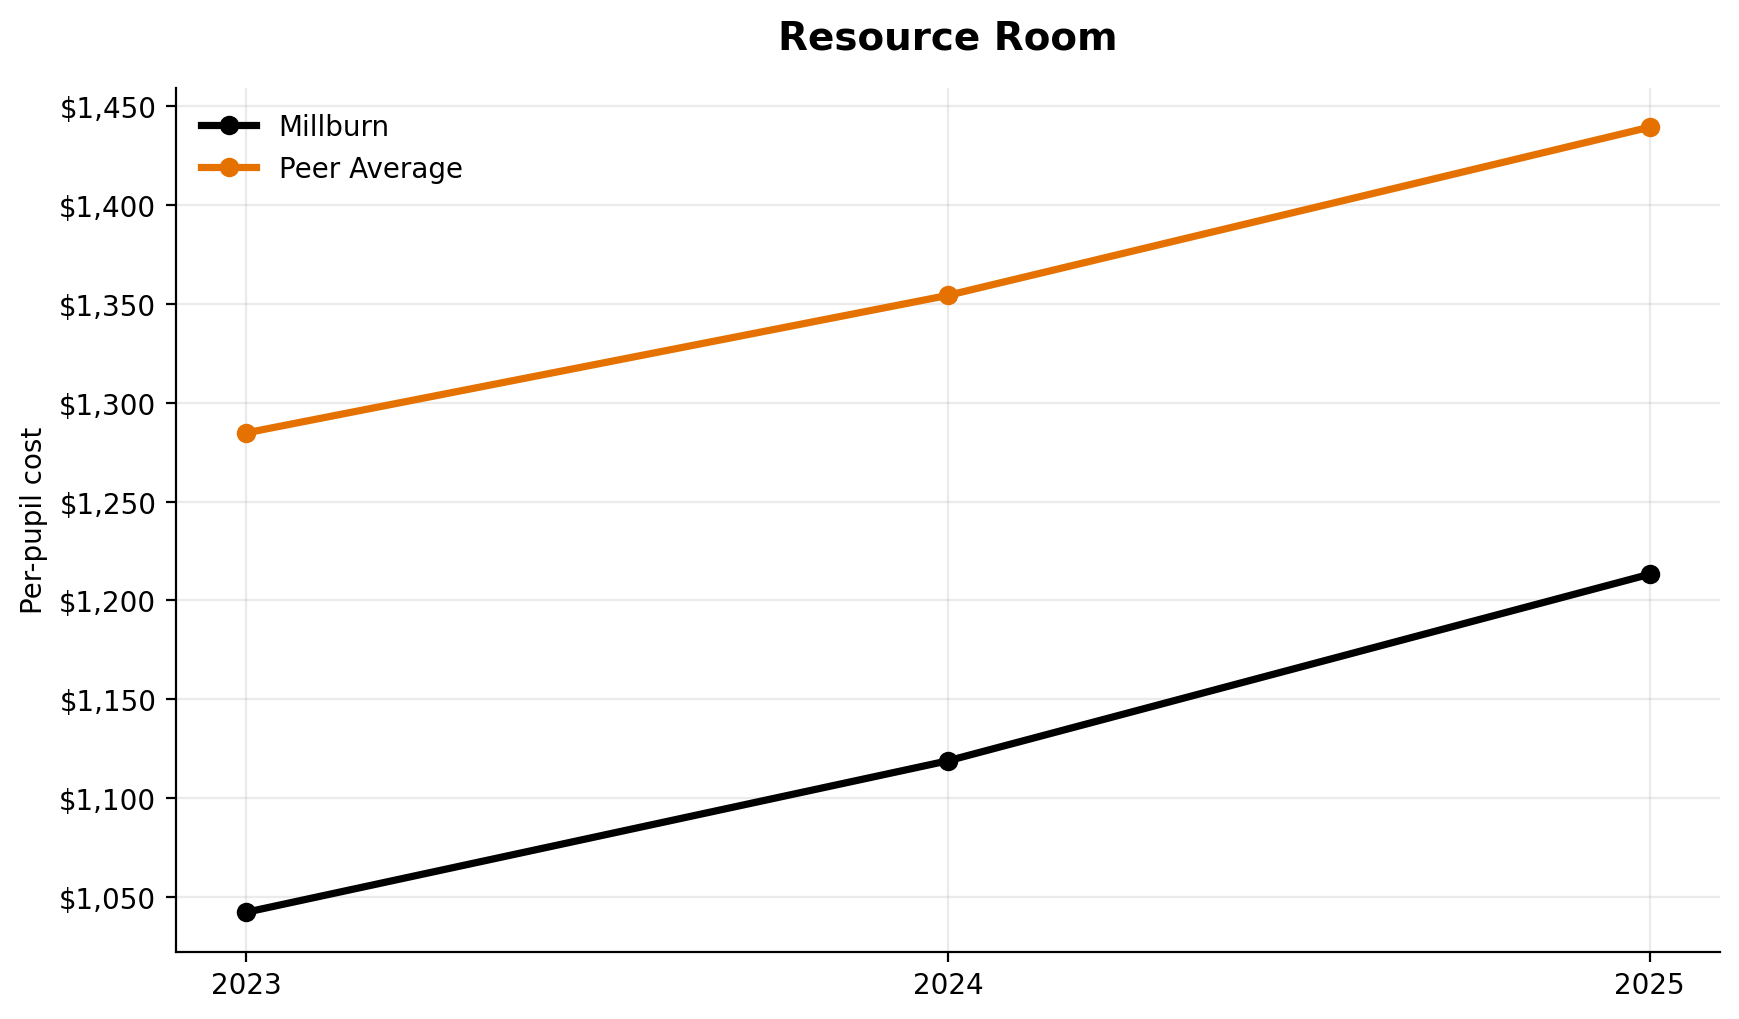
Resource Room
Resource room spending ranks 6th of 7.
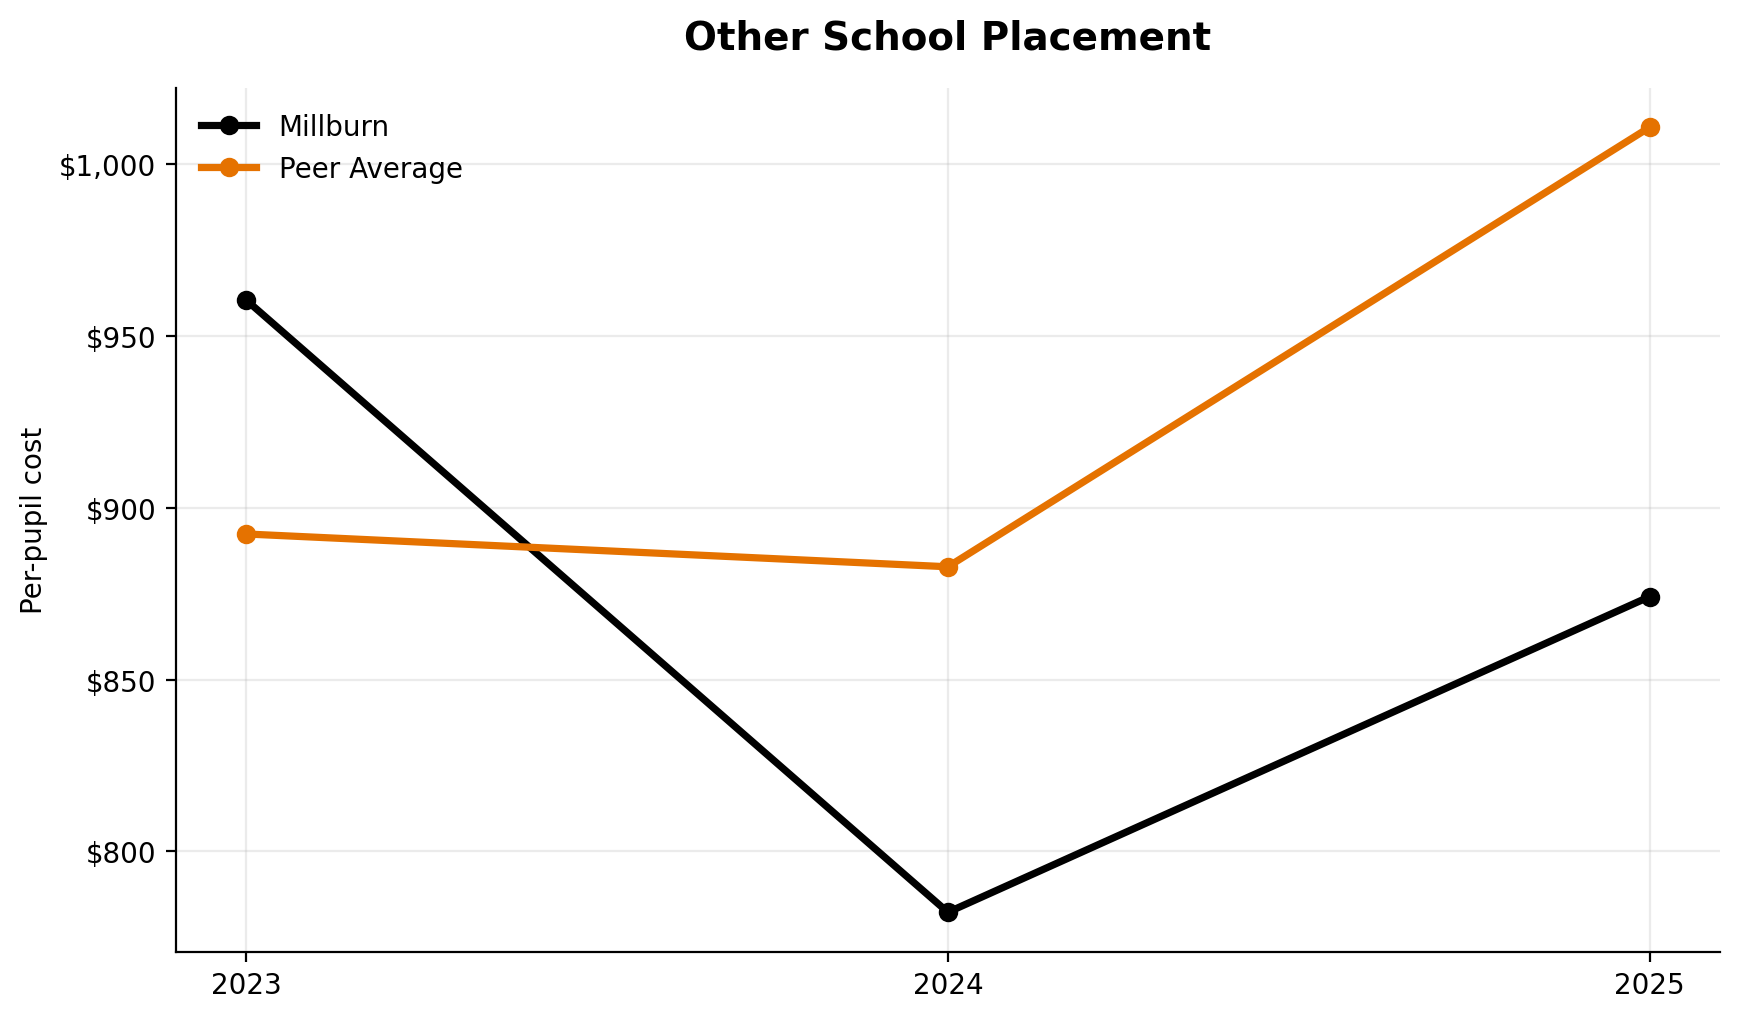
Other School Placement
Out-of-district placement ranks 5th of 7.
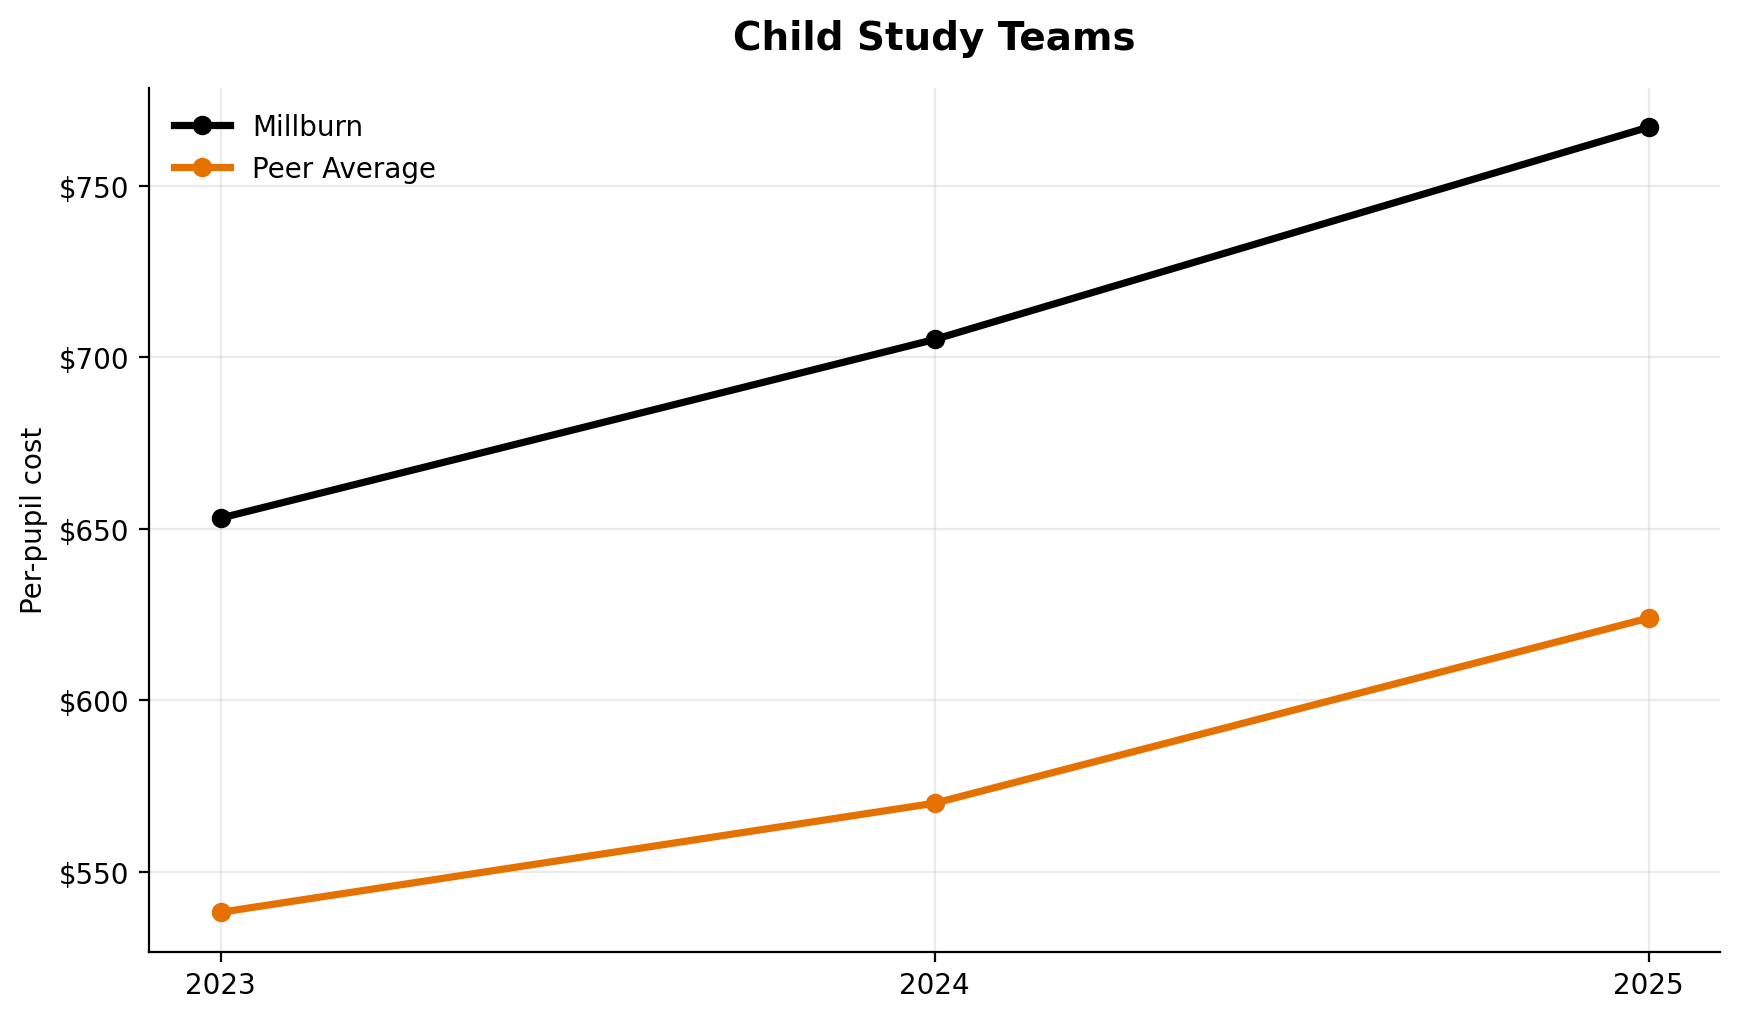
Child Study Teams
Millburn ranks 3rd of 7 in child study teams.
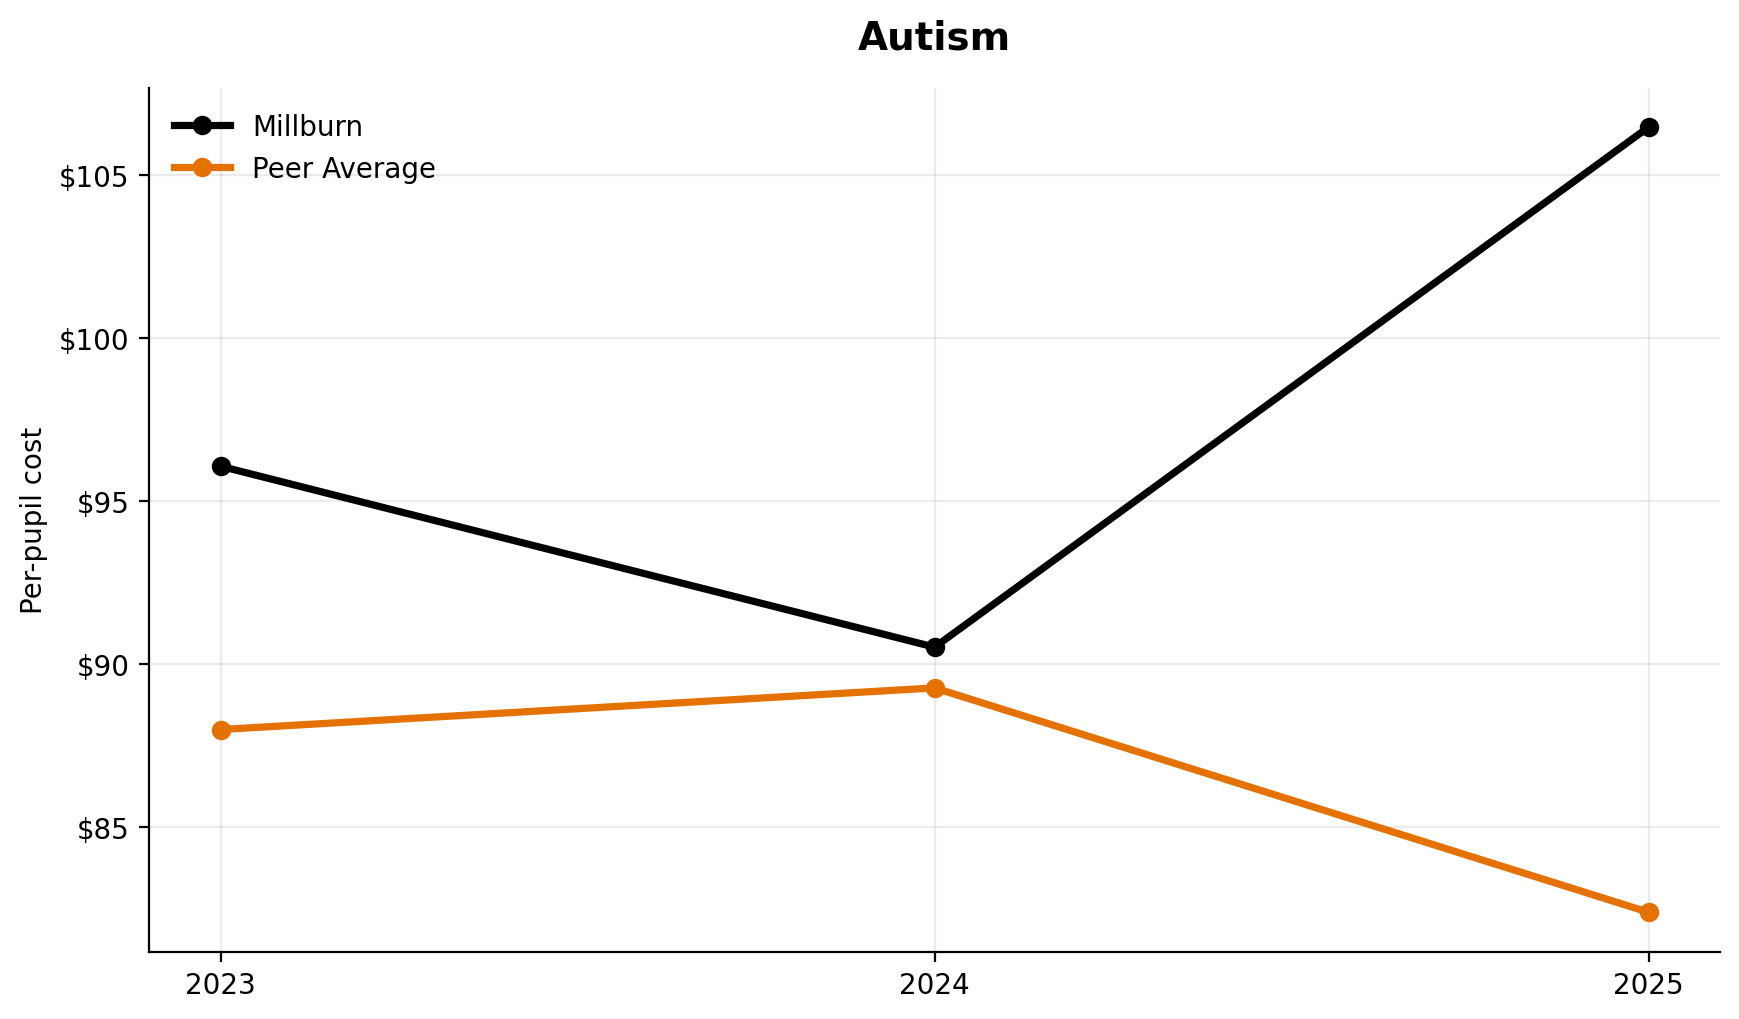
Autism
Autism services rank 3rd of 7.
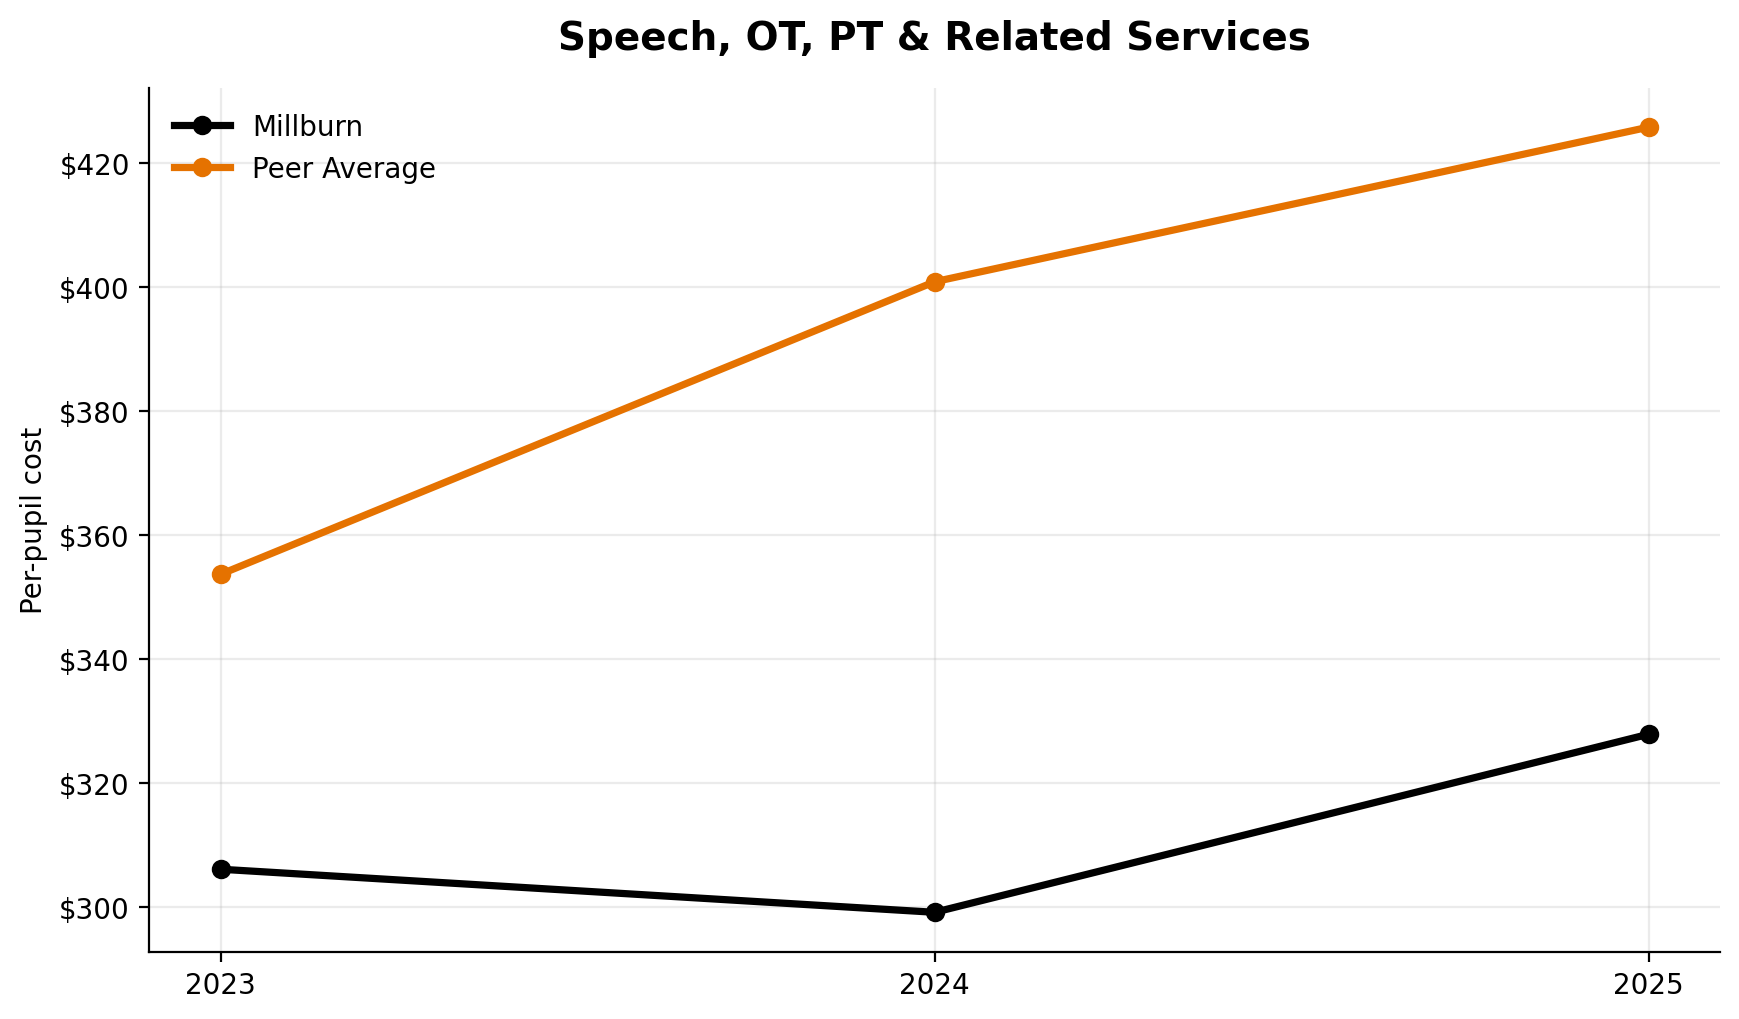
Speech, OT, PT & Related Services
Speech-related services rank 5th of 7.
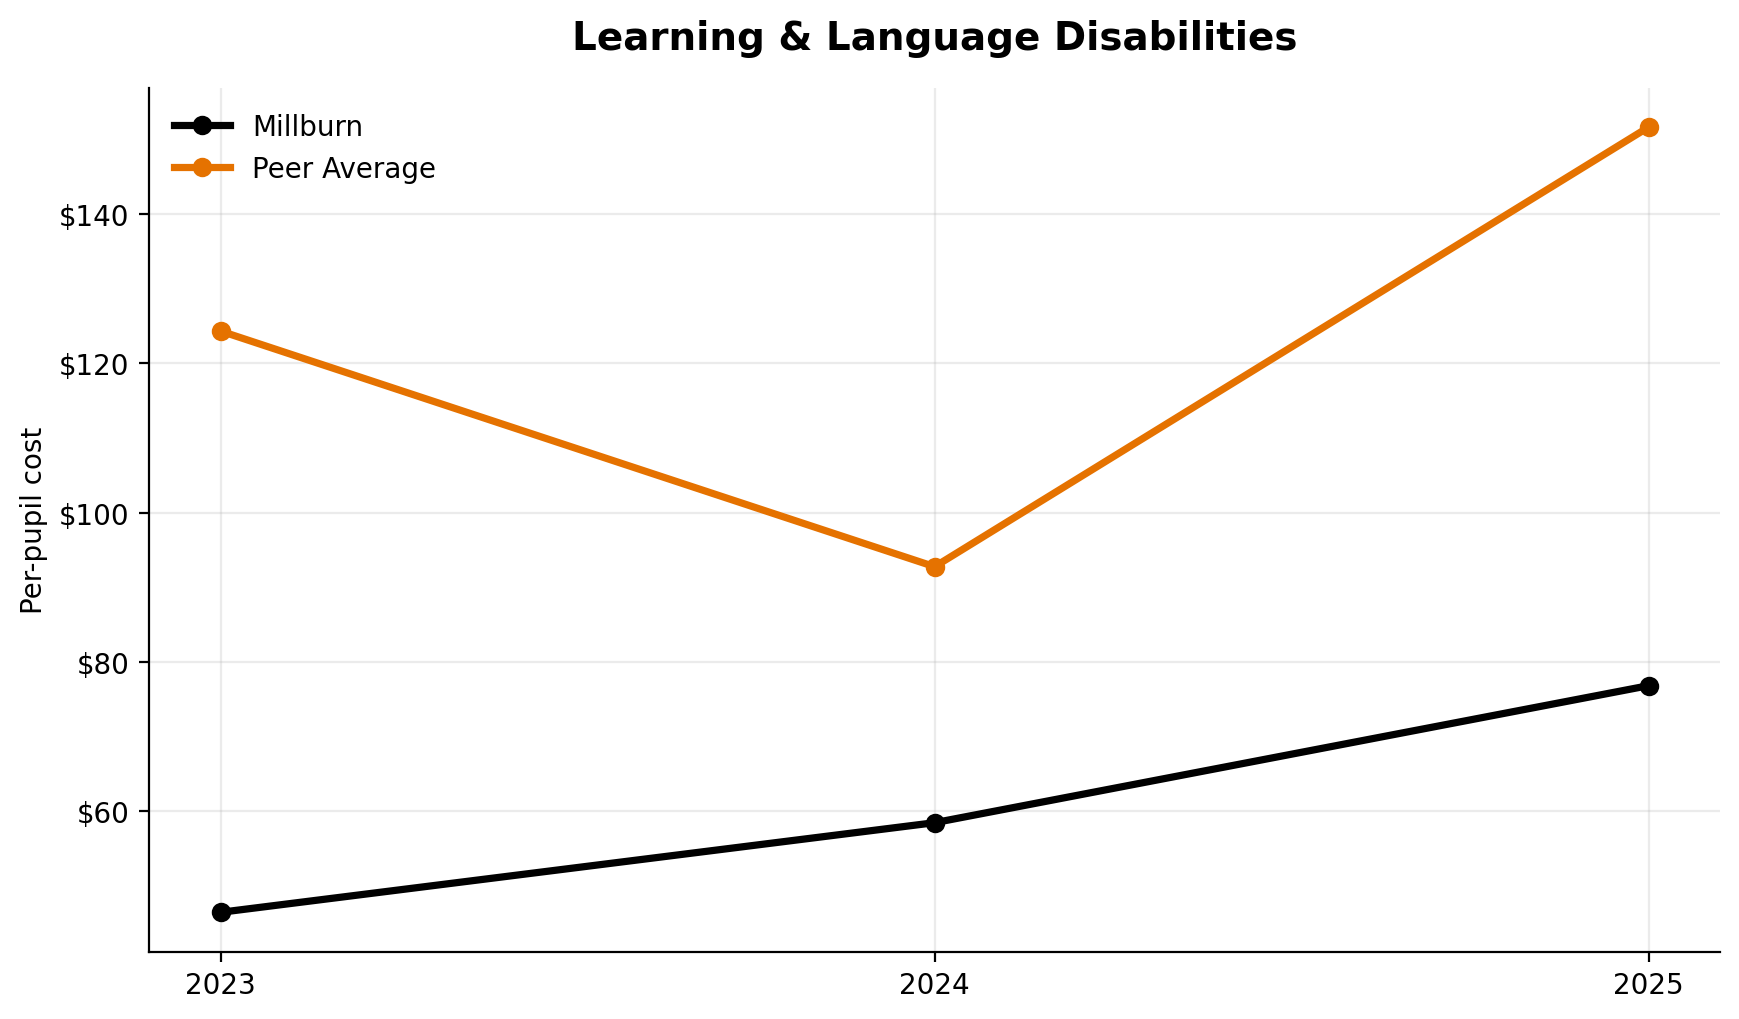
Learning & Language Disabilities
Millburn ranks 6th of 7 here.
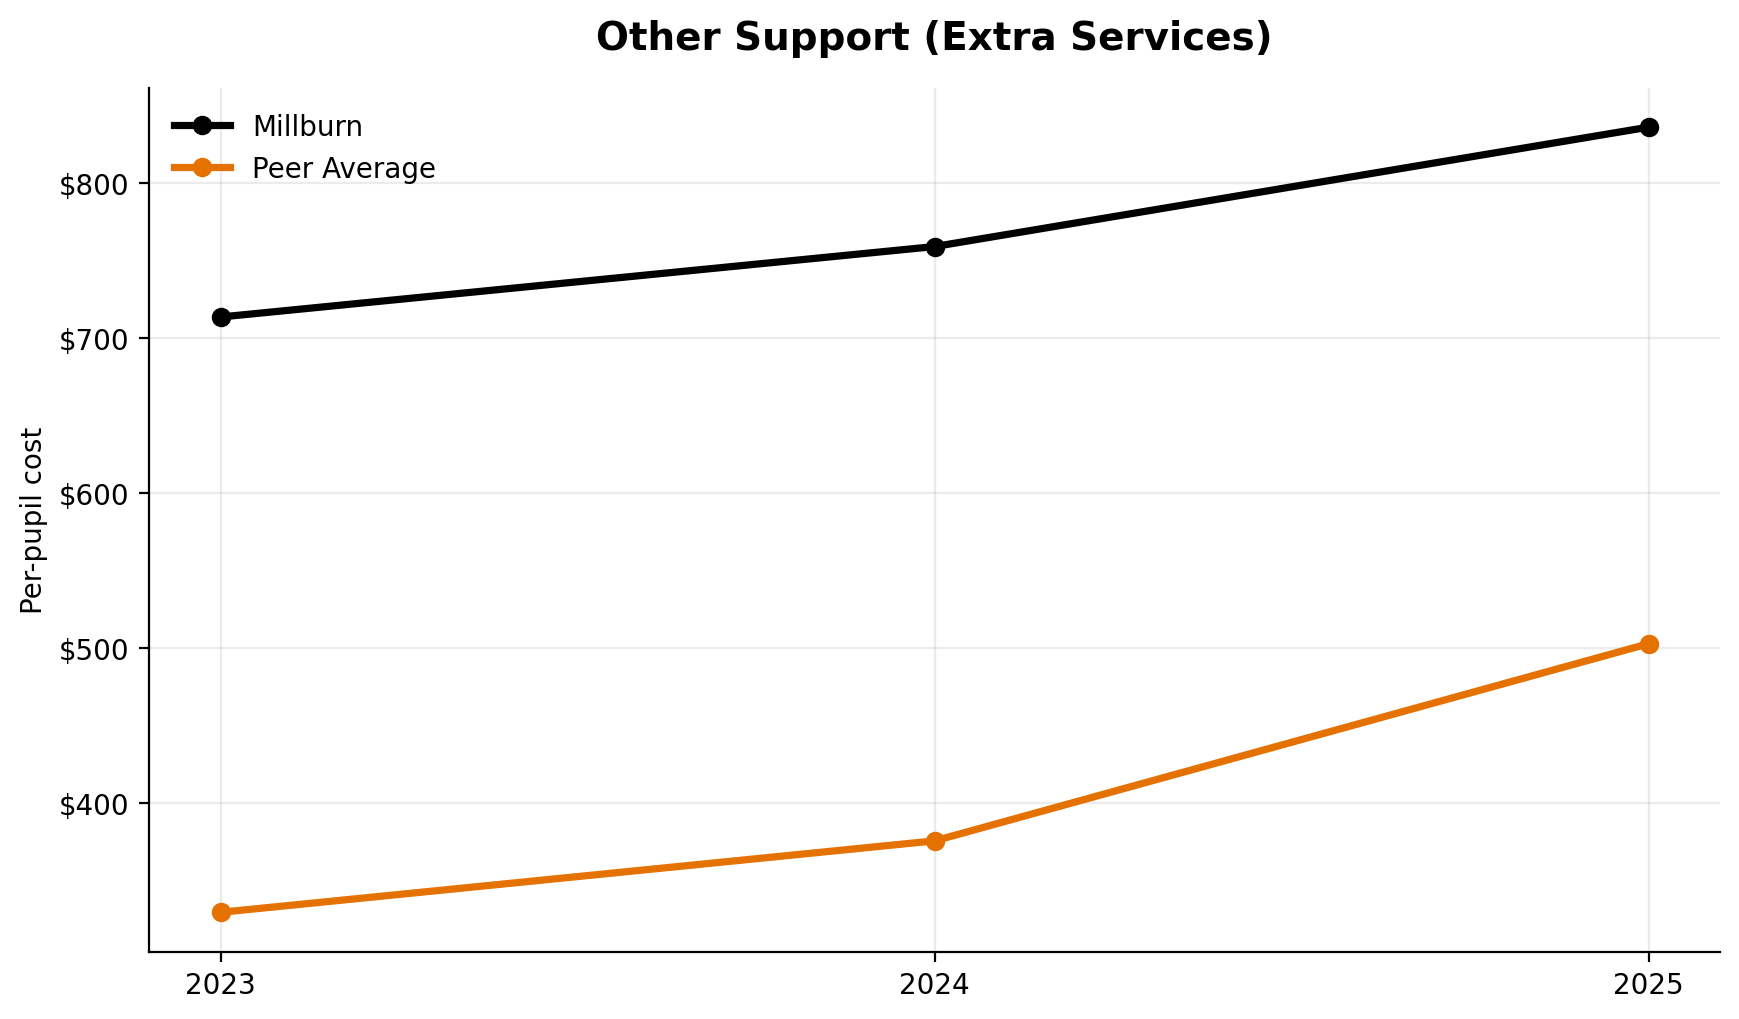
Other Support (Extra Services)
This category places Millburn 2nd of 7.
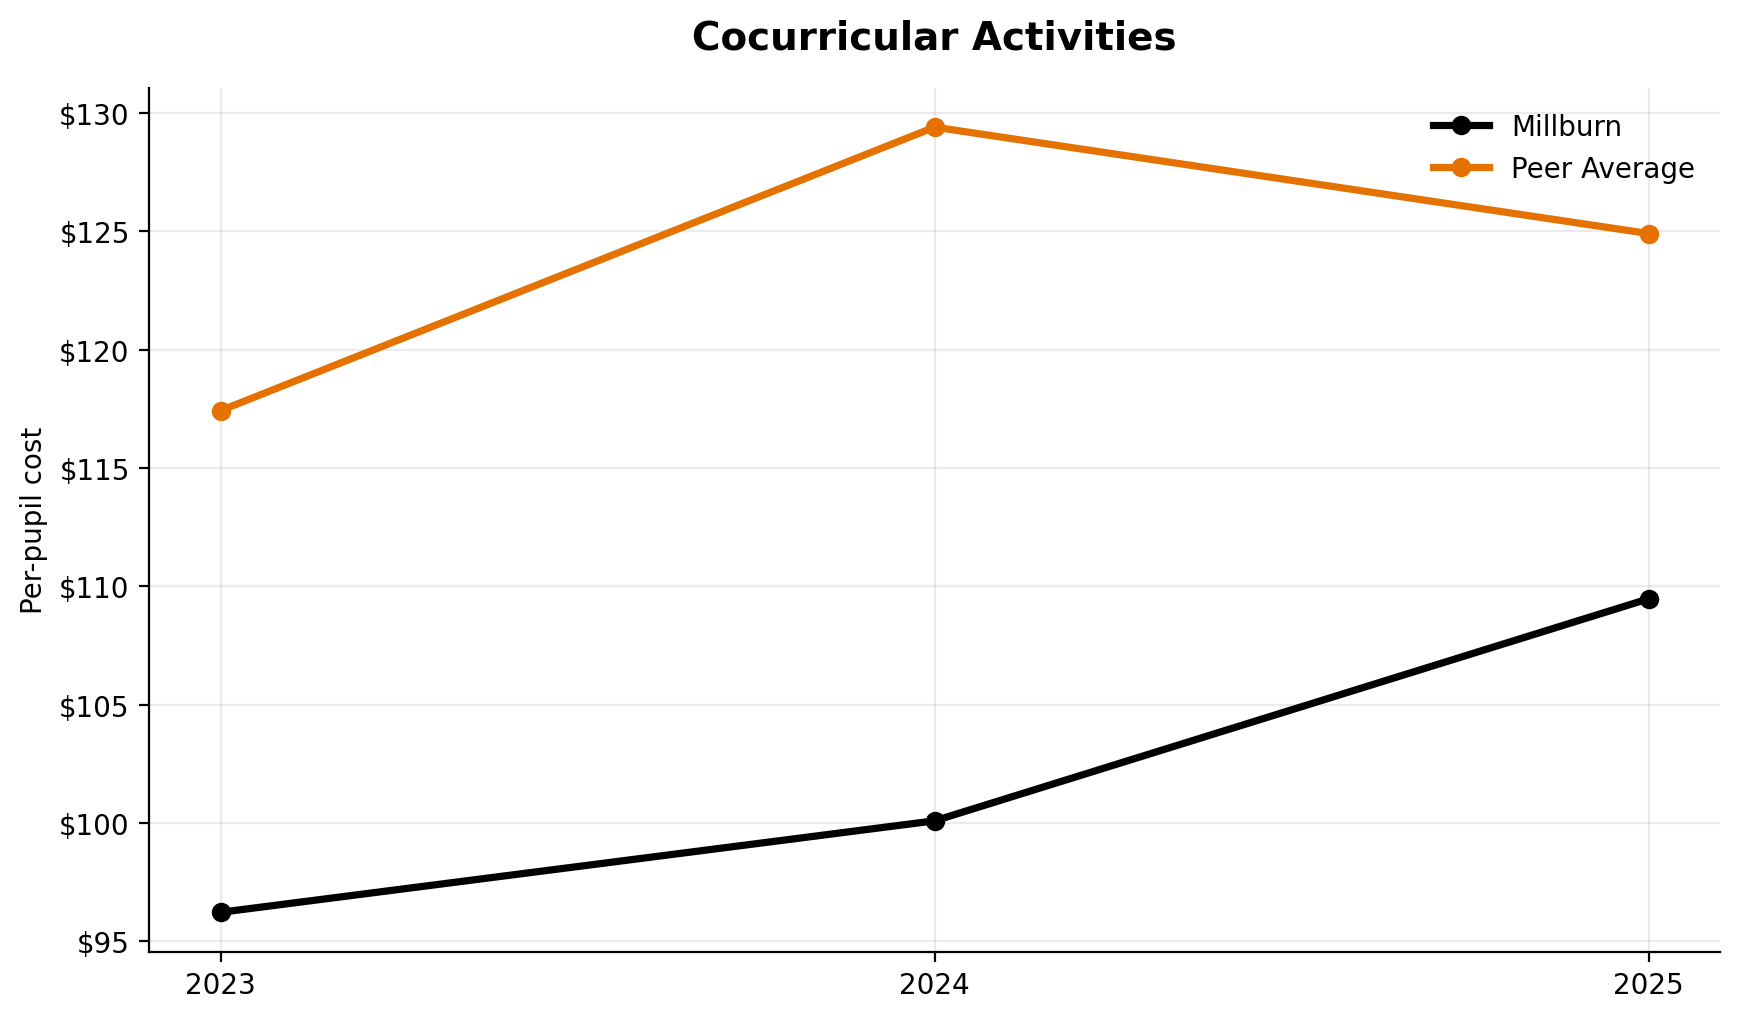
Cocurricular Activities
Millburn ranks 5th of 7 in cocurricular spending.
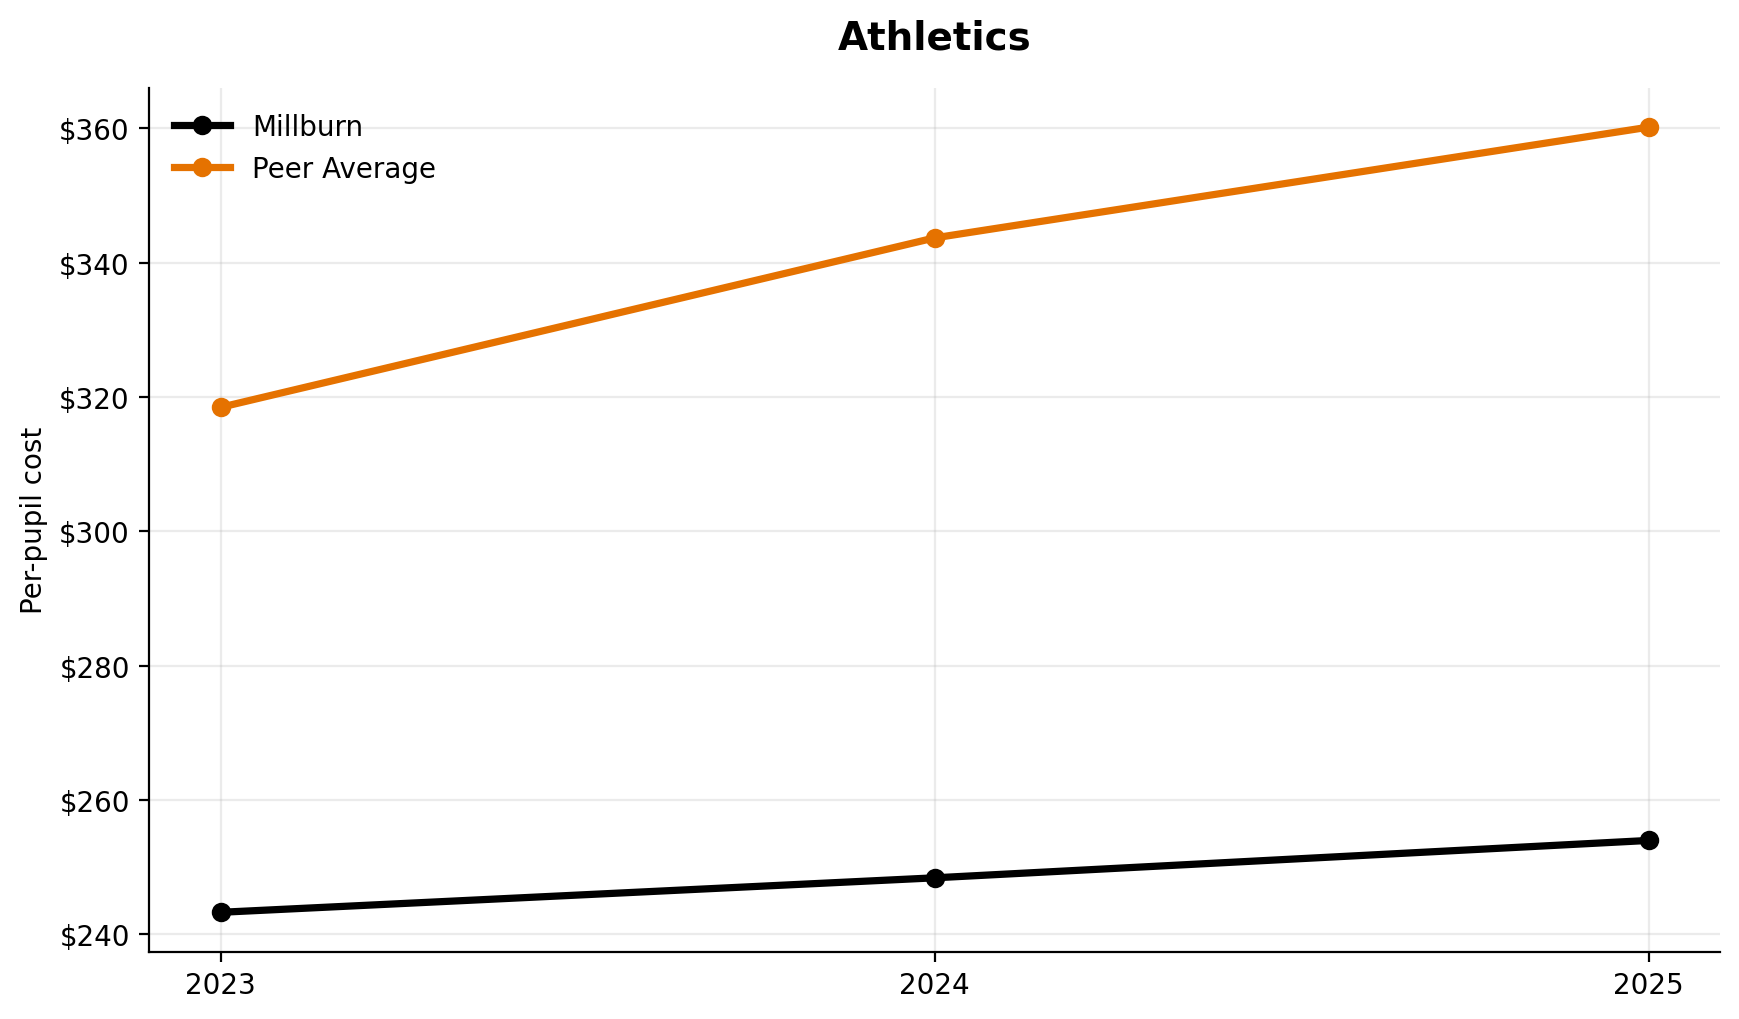
Athletics
Athletics ranks 7th of 7 among peers.
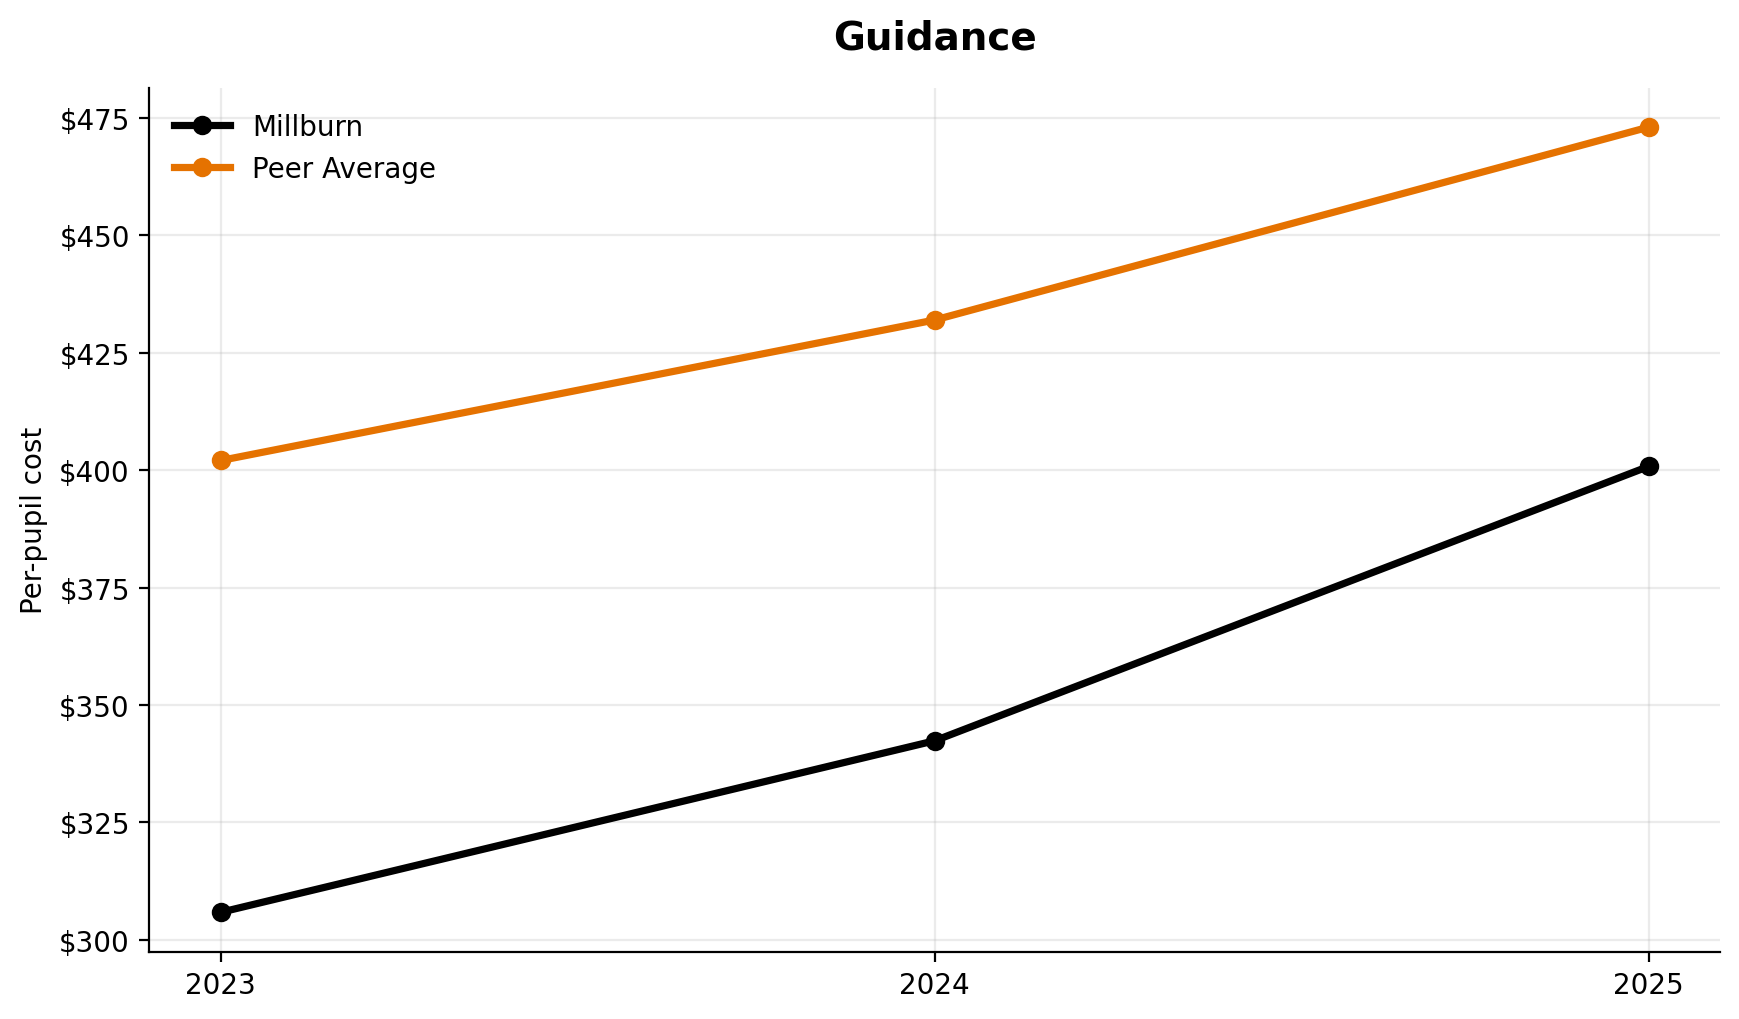
Guidance
Guidance spending ranks 6th of 7.
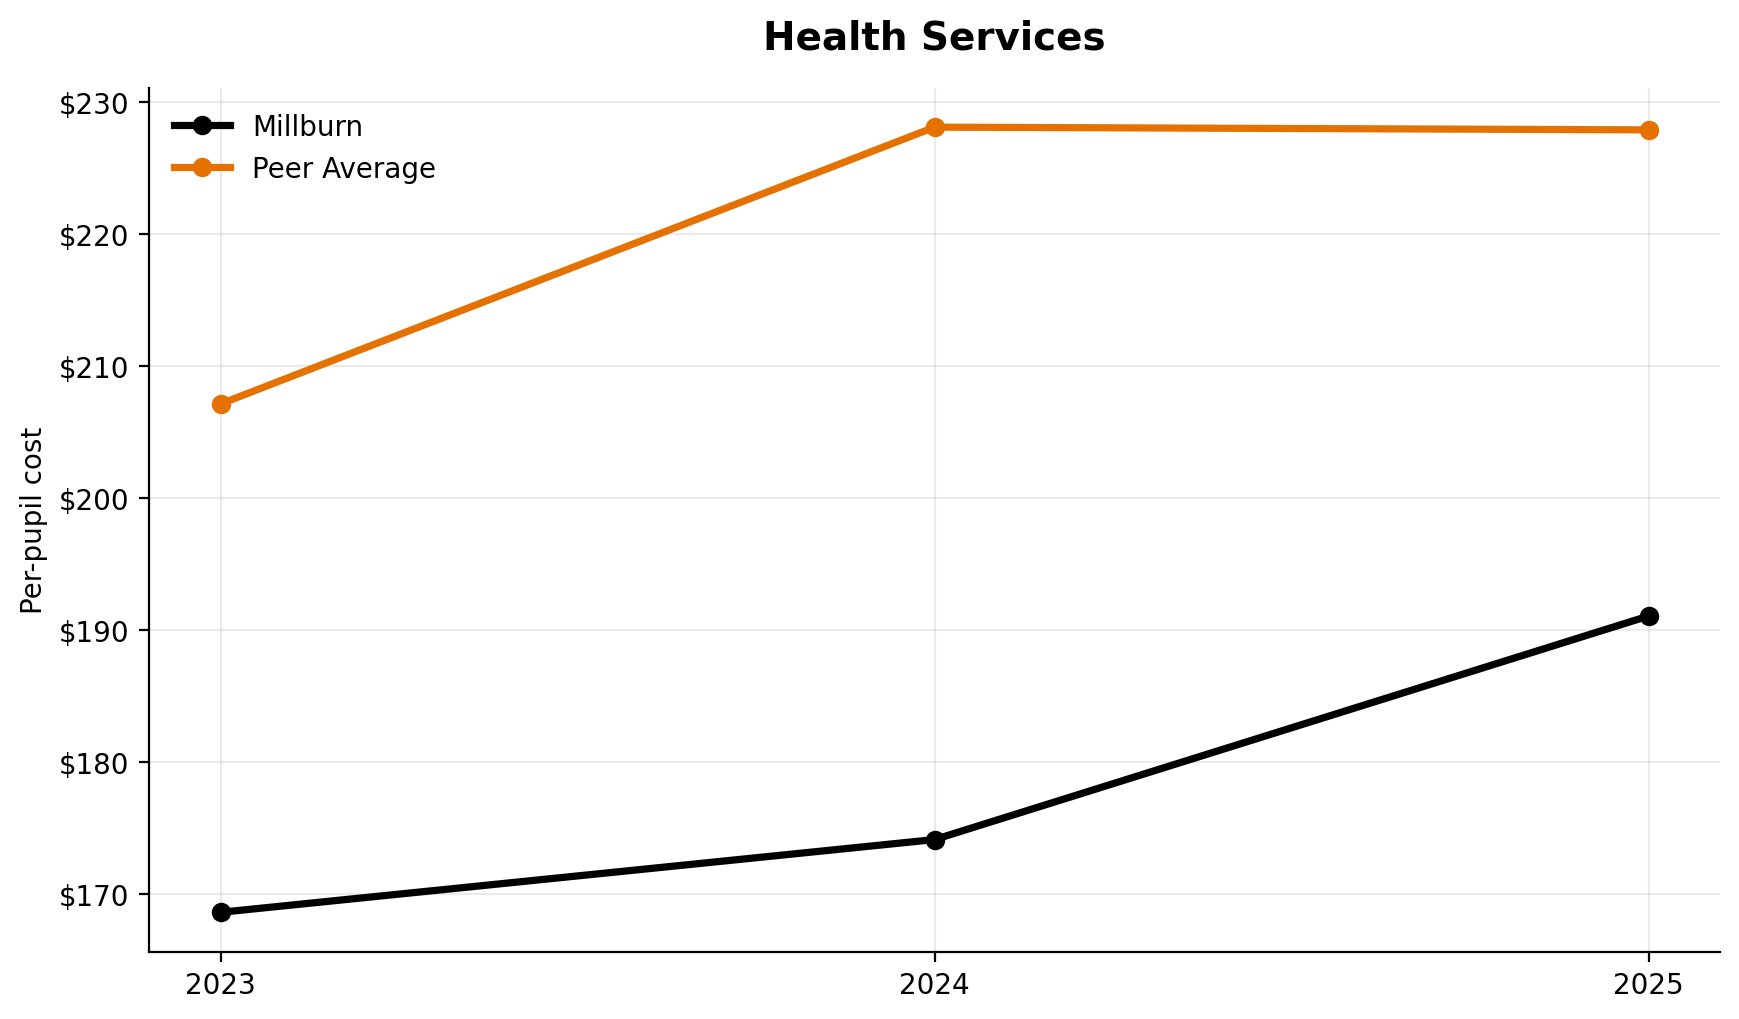
Health Services
Health services rank 6th of 7.
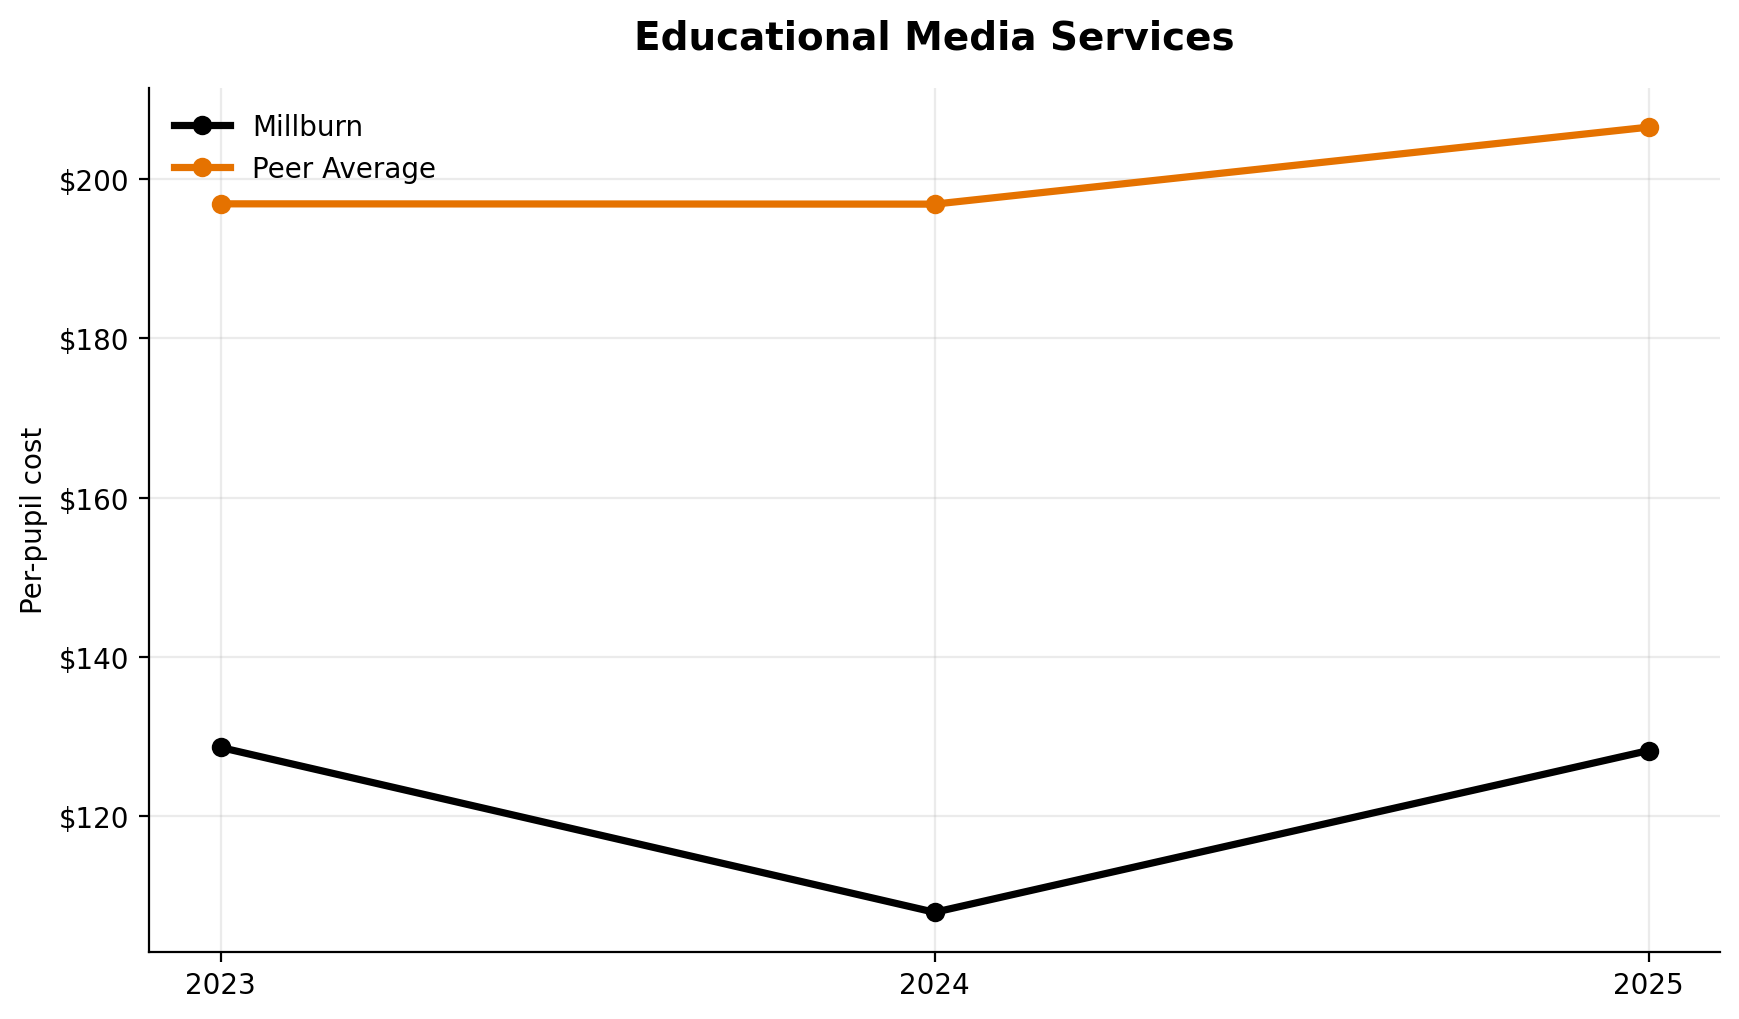
Educational Media Services
Library/media spending ranks 7th of 7.
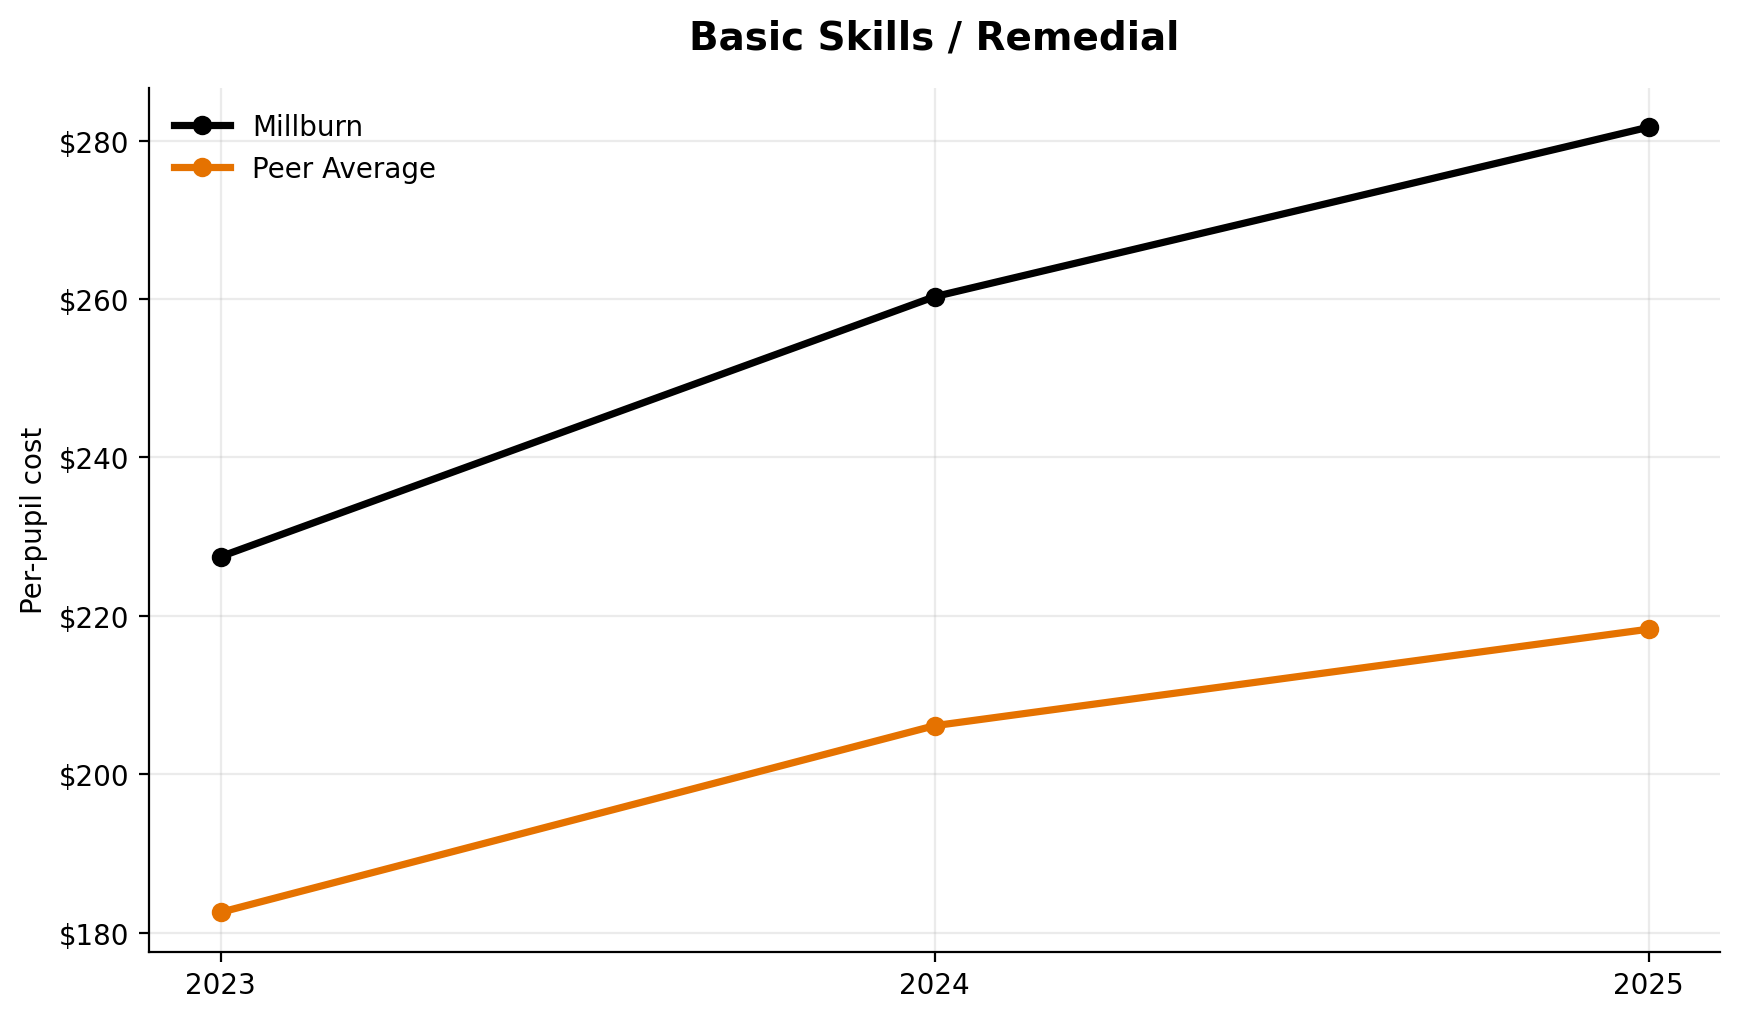
Basic Skills / Remedial
Basic skills/remedial ranks 2nd of 7.
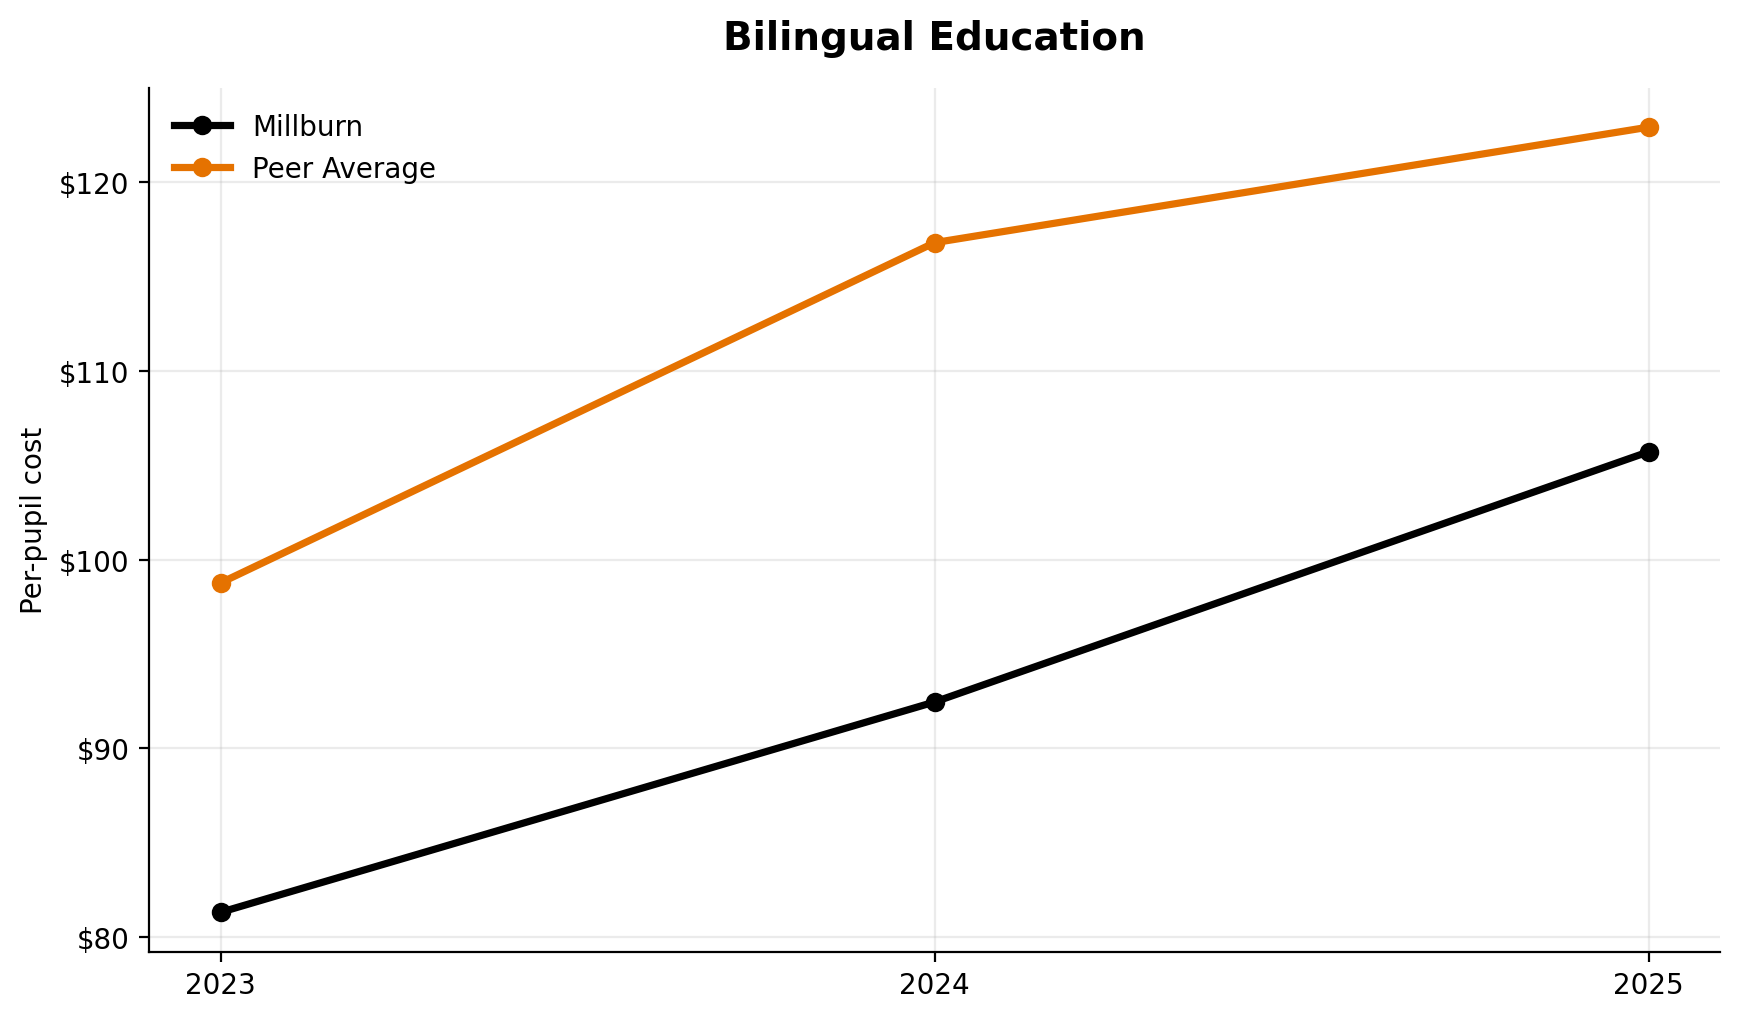
Bilingual Education
Millburn ranks 4th of 7 in bilingual education.
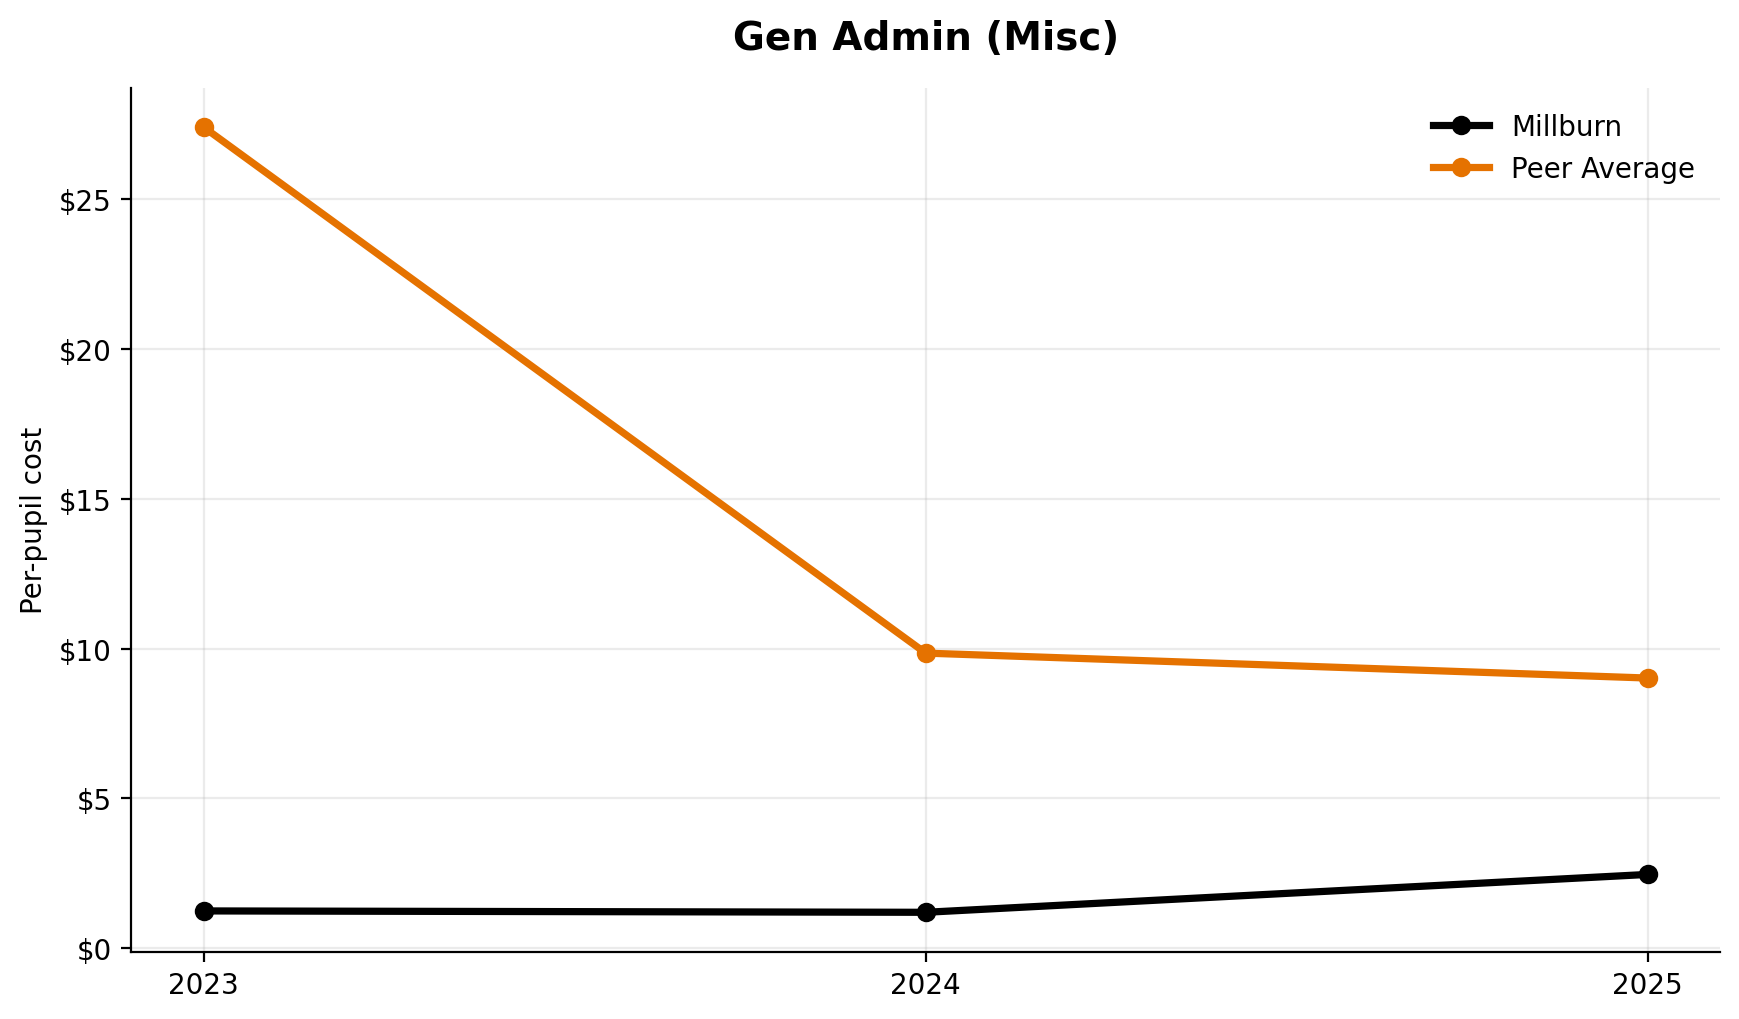
Gen Admin (Misc)
Millburn ranks 5th of 7 in this line item.
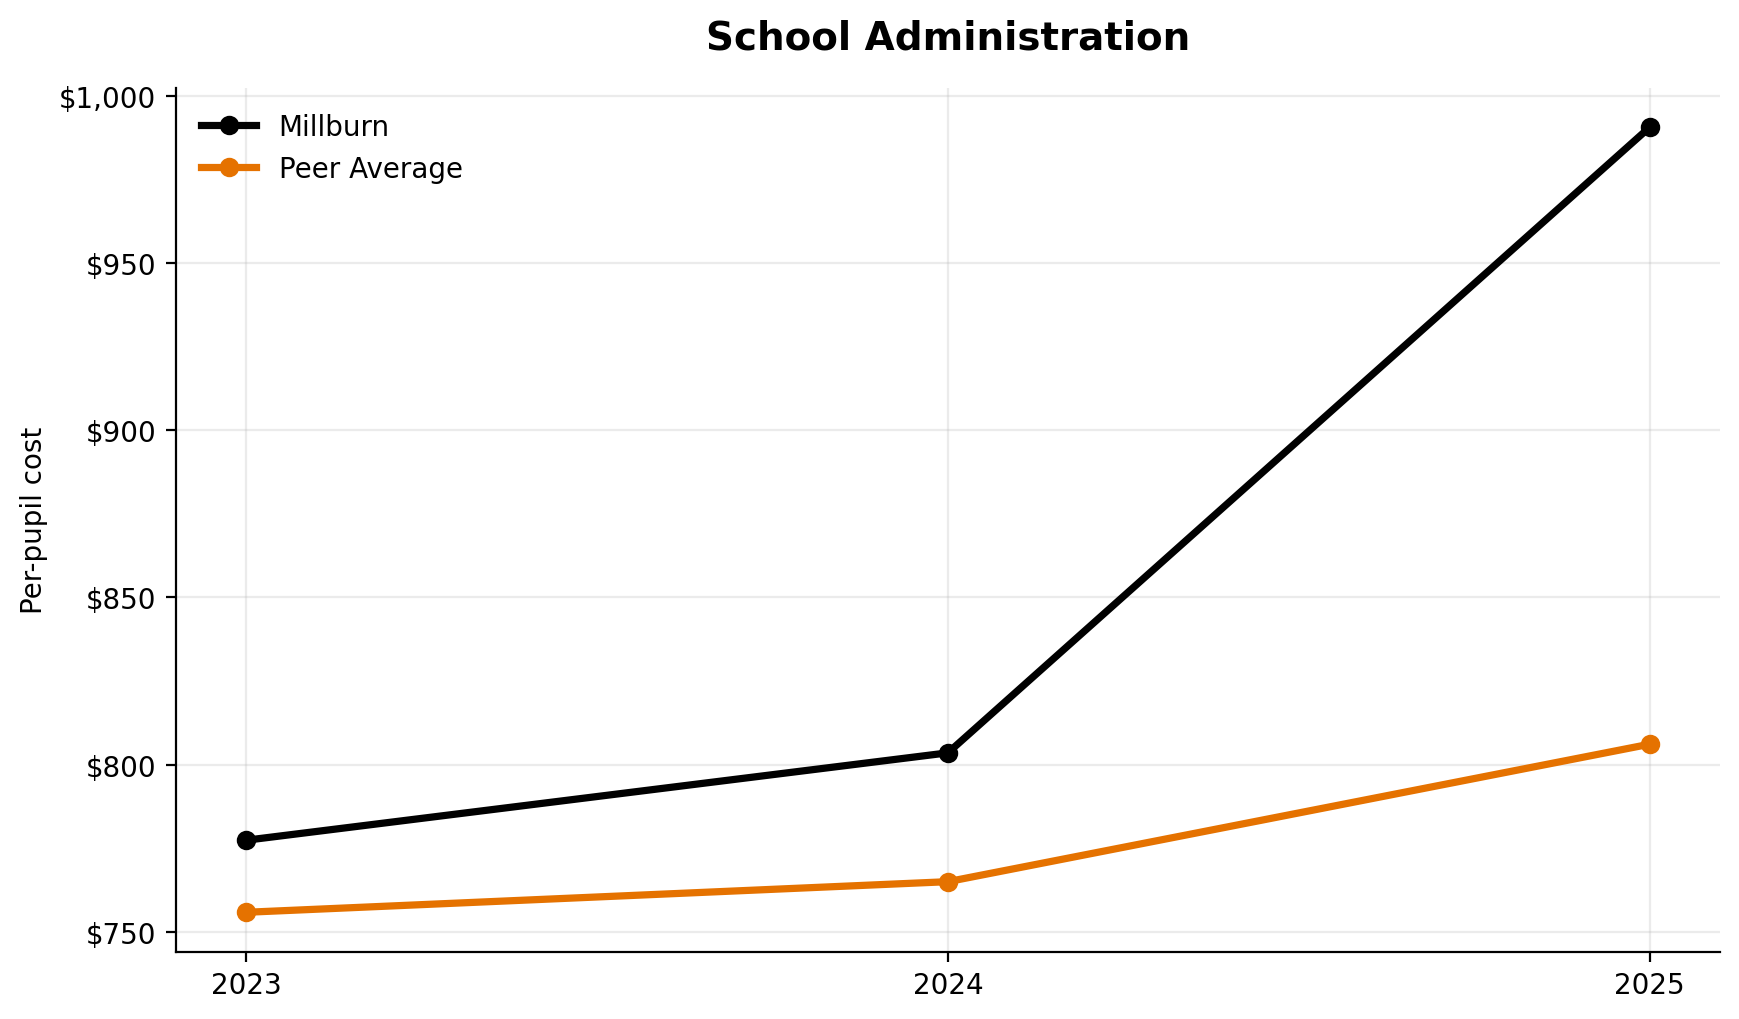
School Administration
School administration ranks 1st of 7.
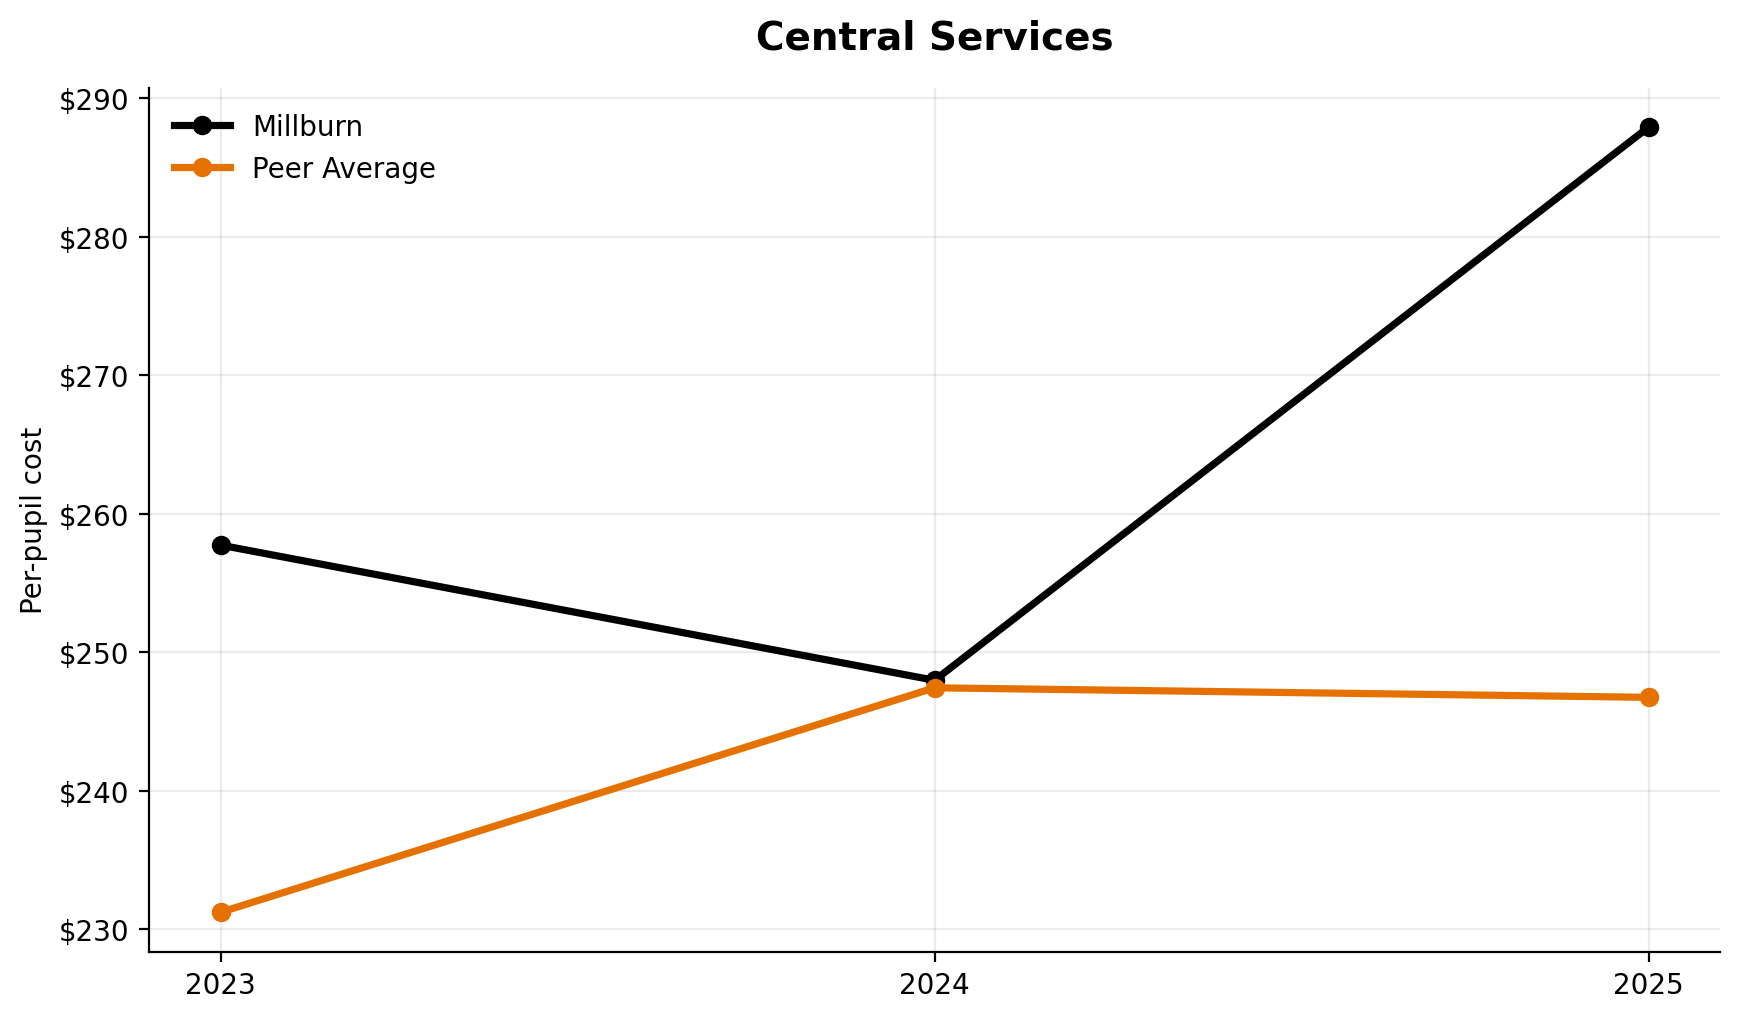
Central Services
Central services ranks 2nd of 7.
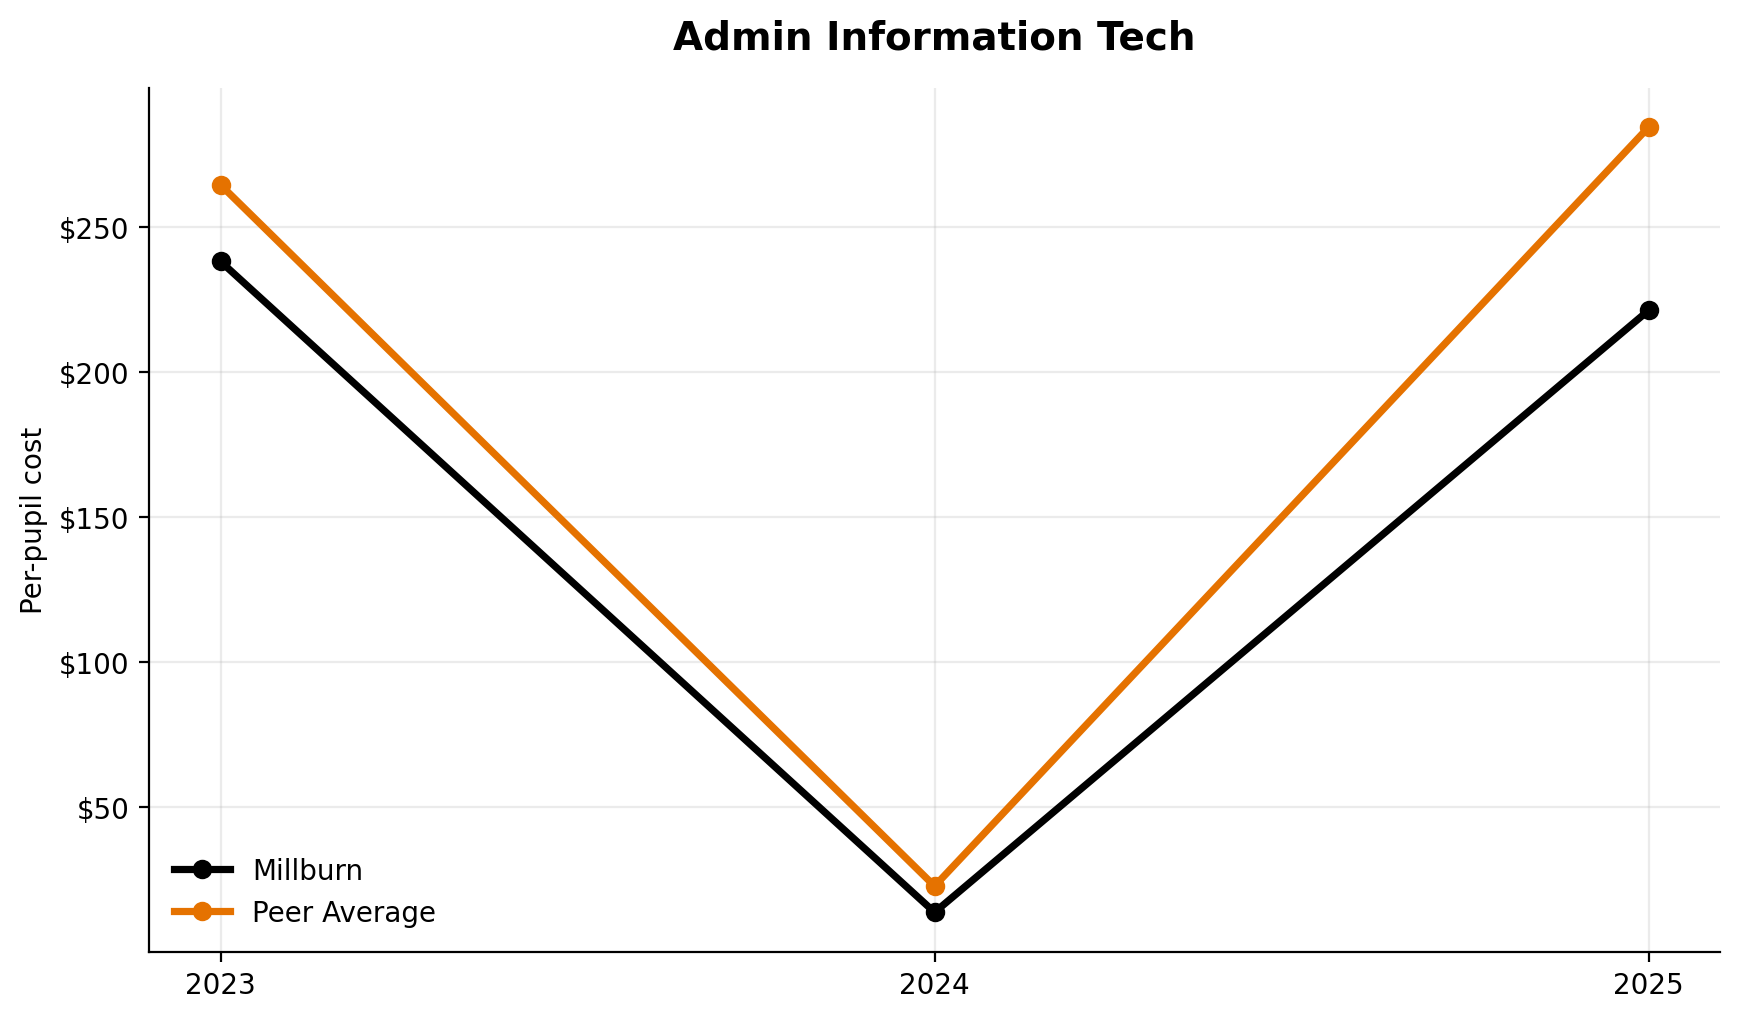
Admin Information Tech
Administrative information technology ranks 6th of 7.
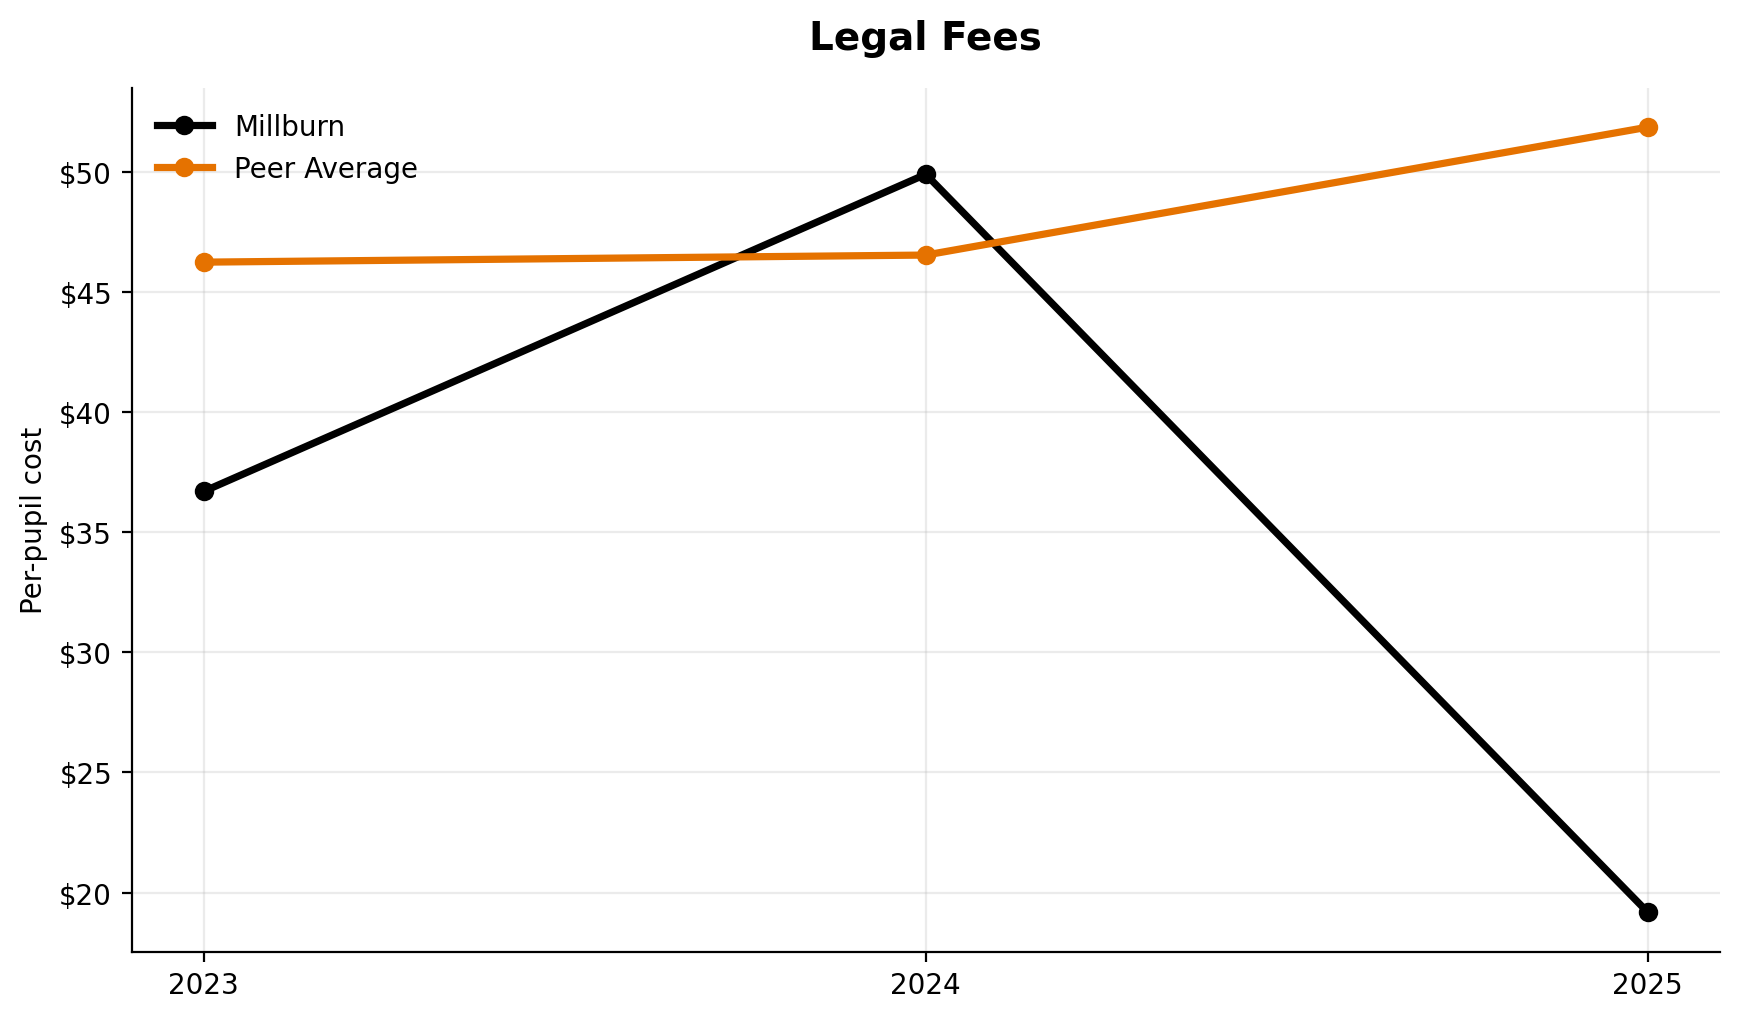
Legal Fees
Legal fees rank 6th of 7.
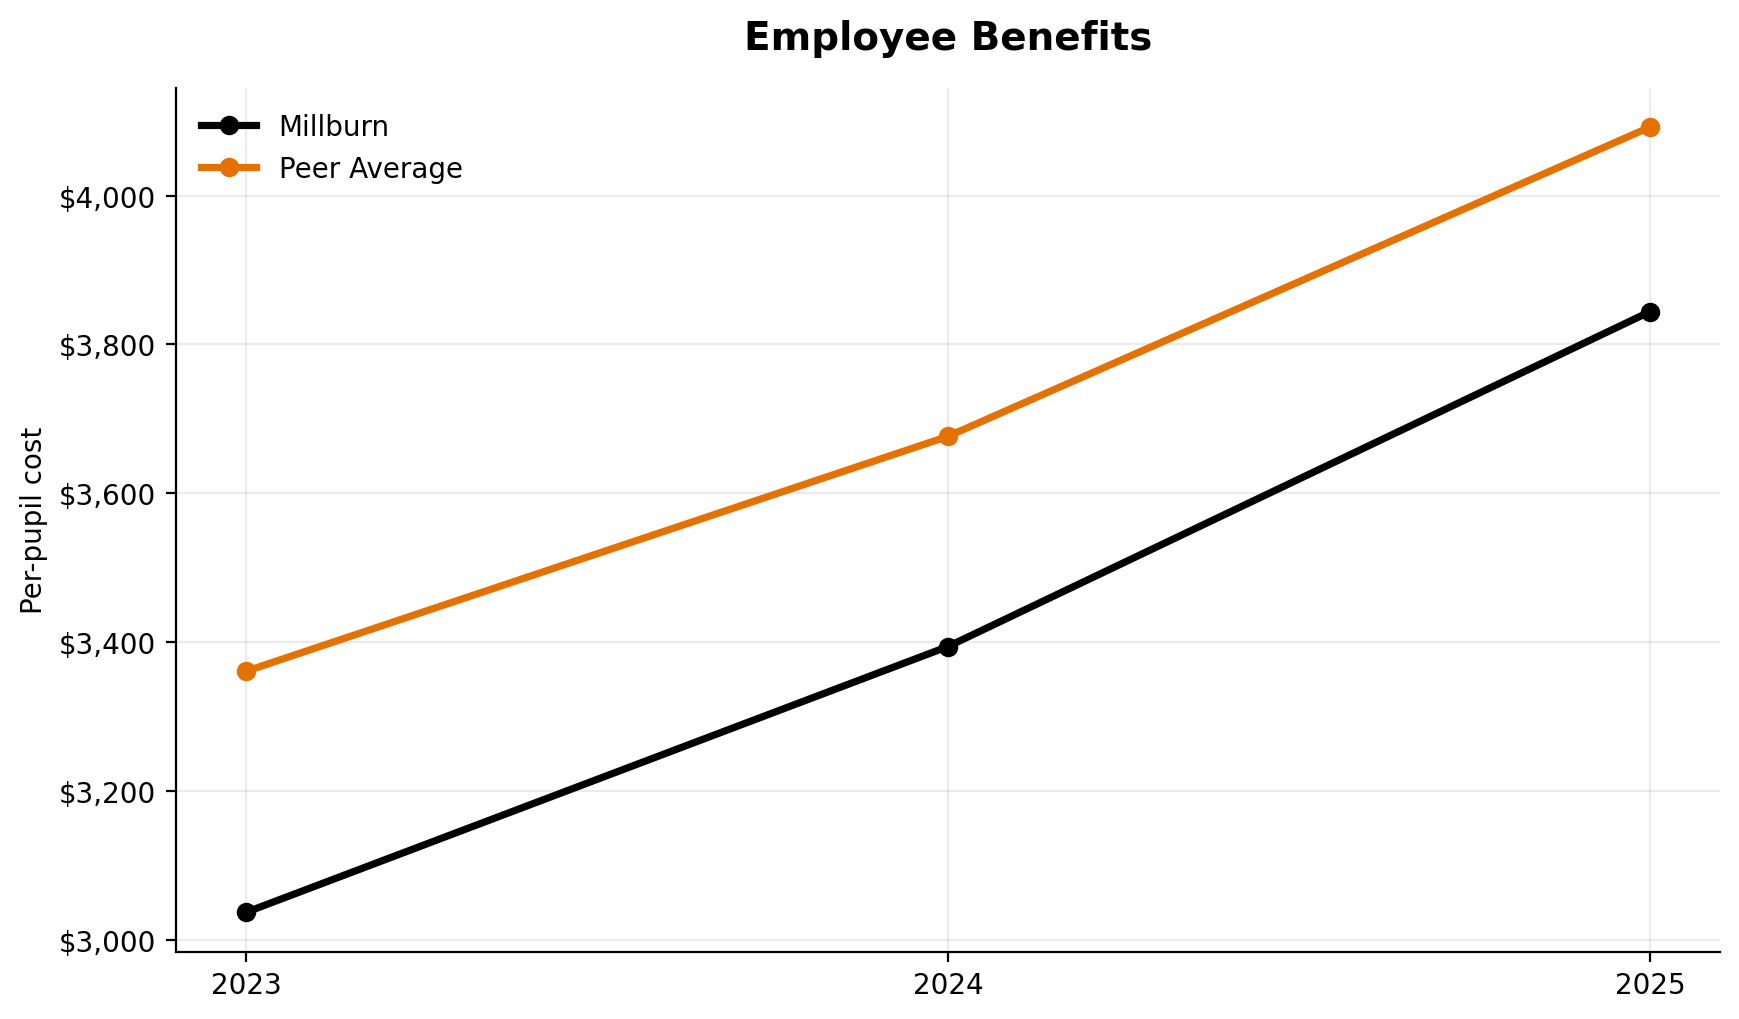
Employee Benefits
Employee benefits rank 6th of 7.
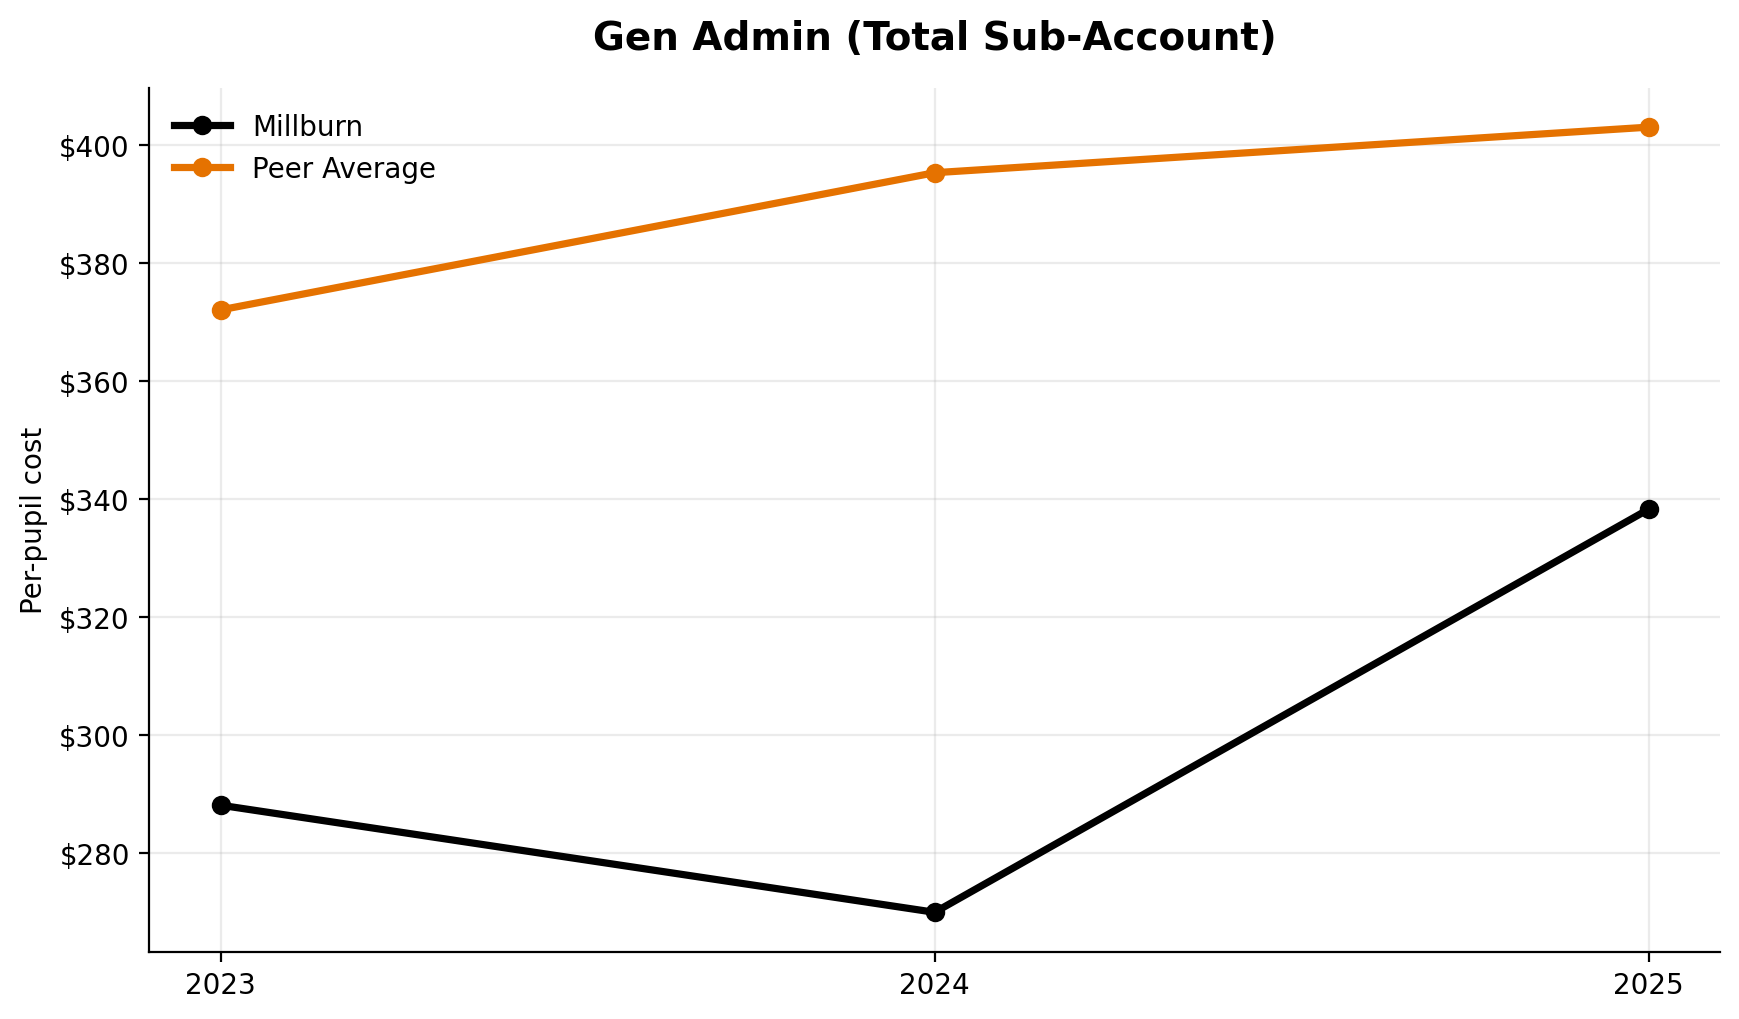
Gen Admin (Total Sub-Account)
Millburn ranks 5th of 7 in this broader admin bucket.
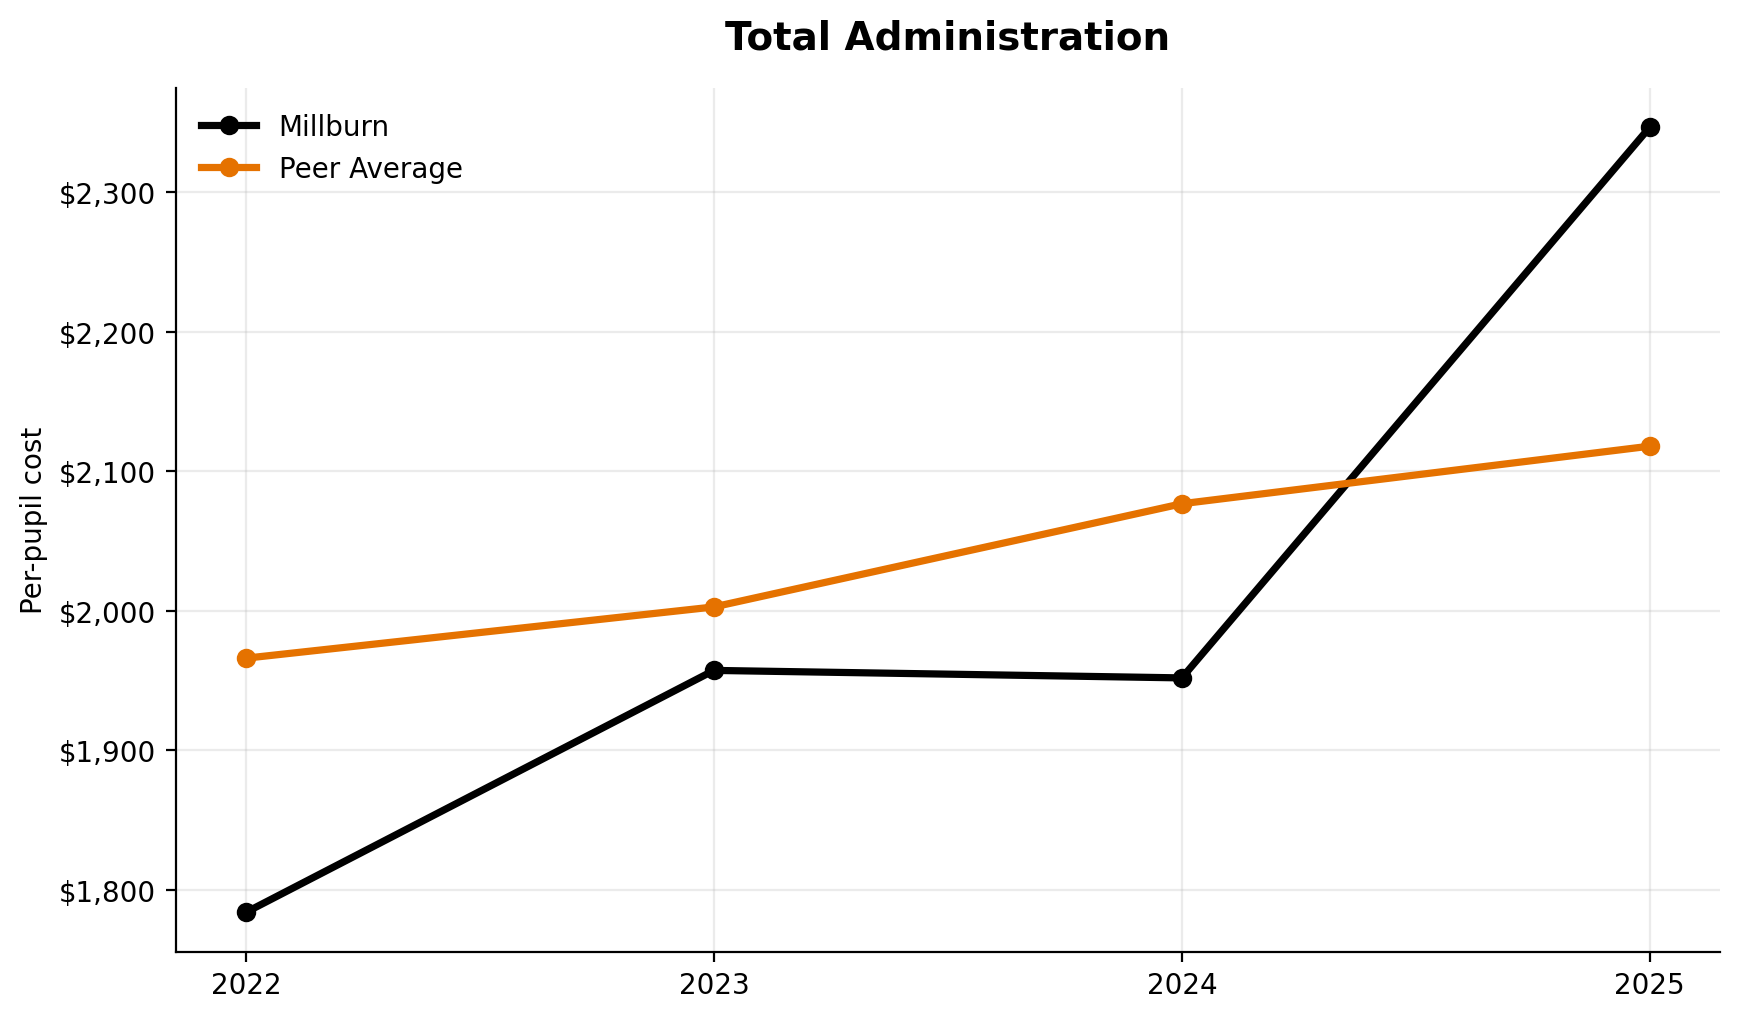
Total Administration
Total administration ranks 3rd of 7 overall.
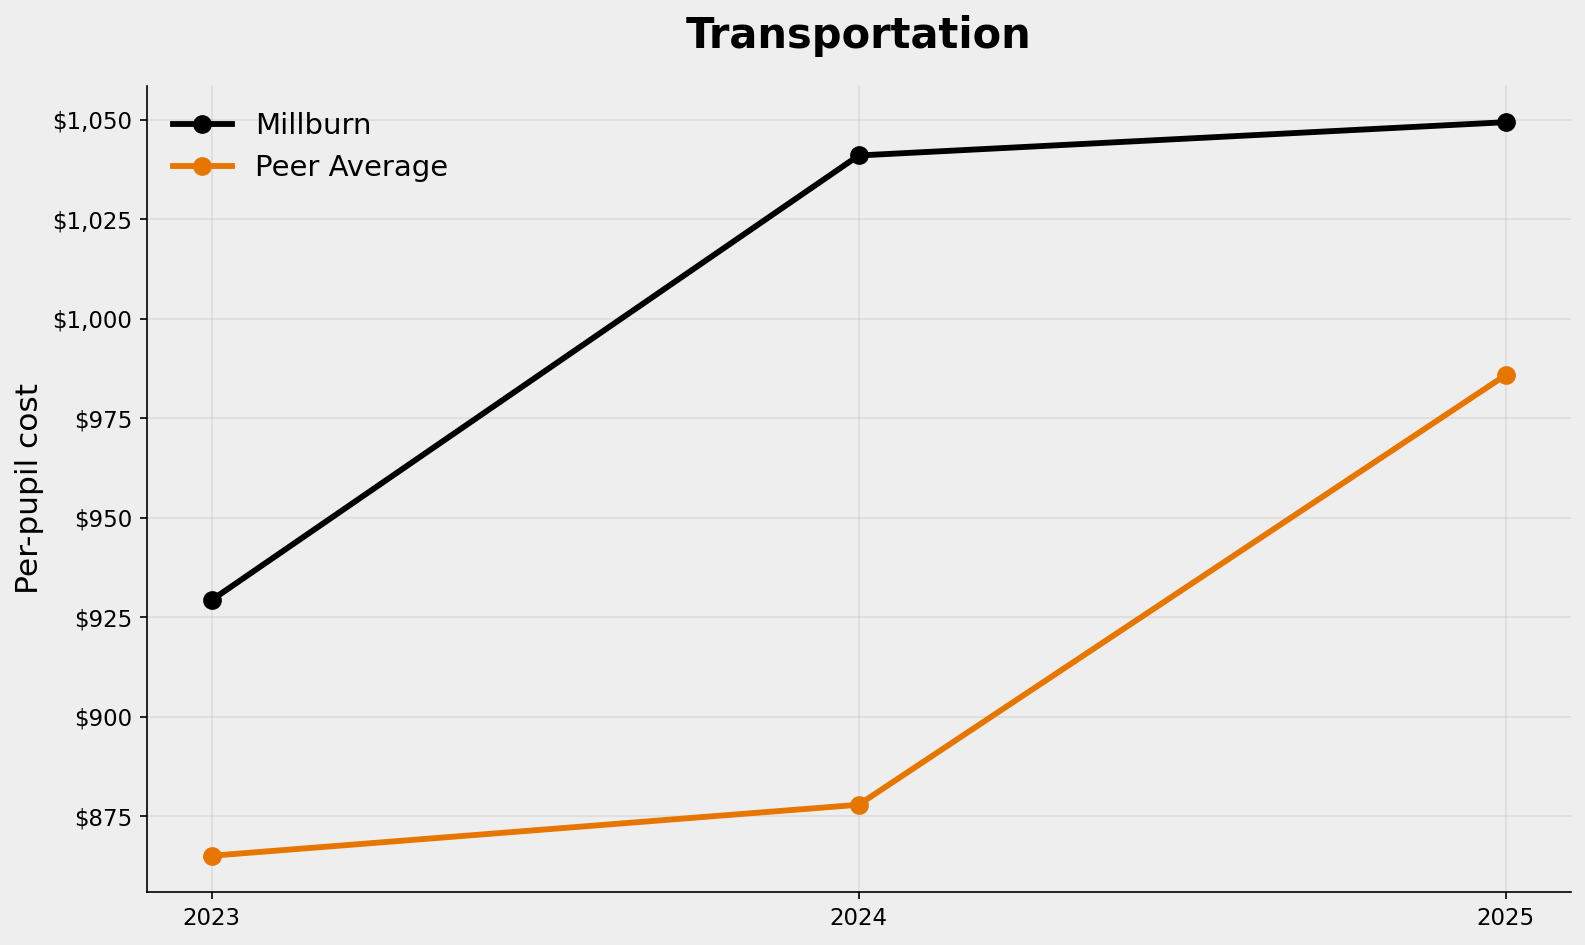
Transportation
Transportation ranks 3rd of 7.
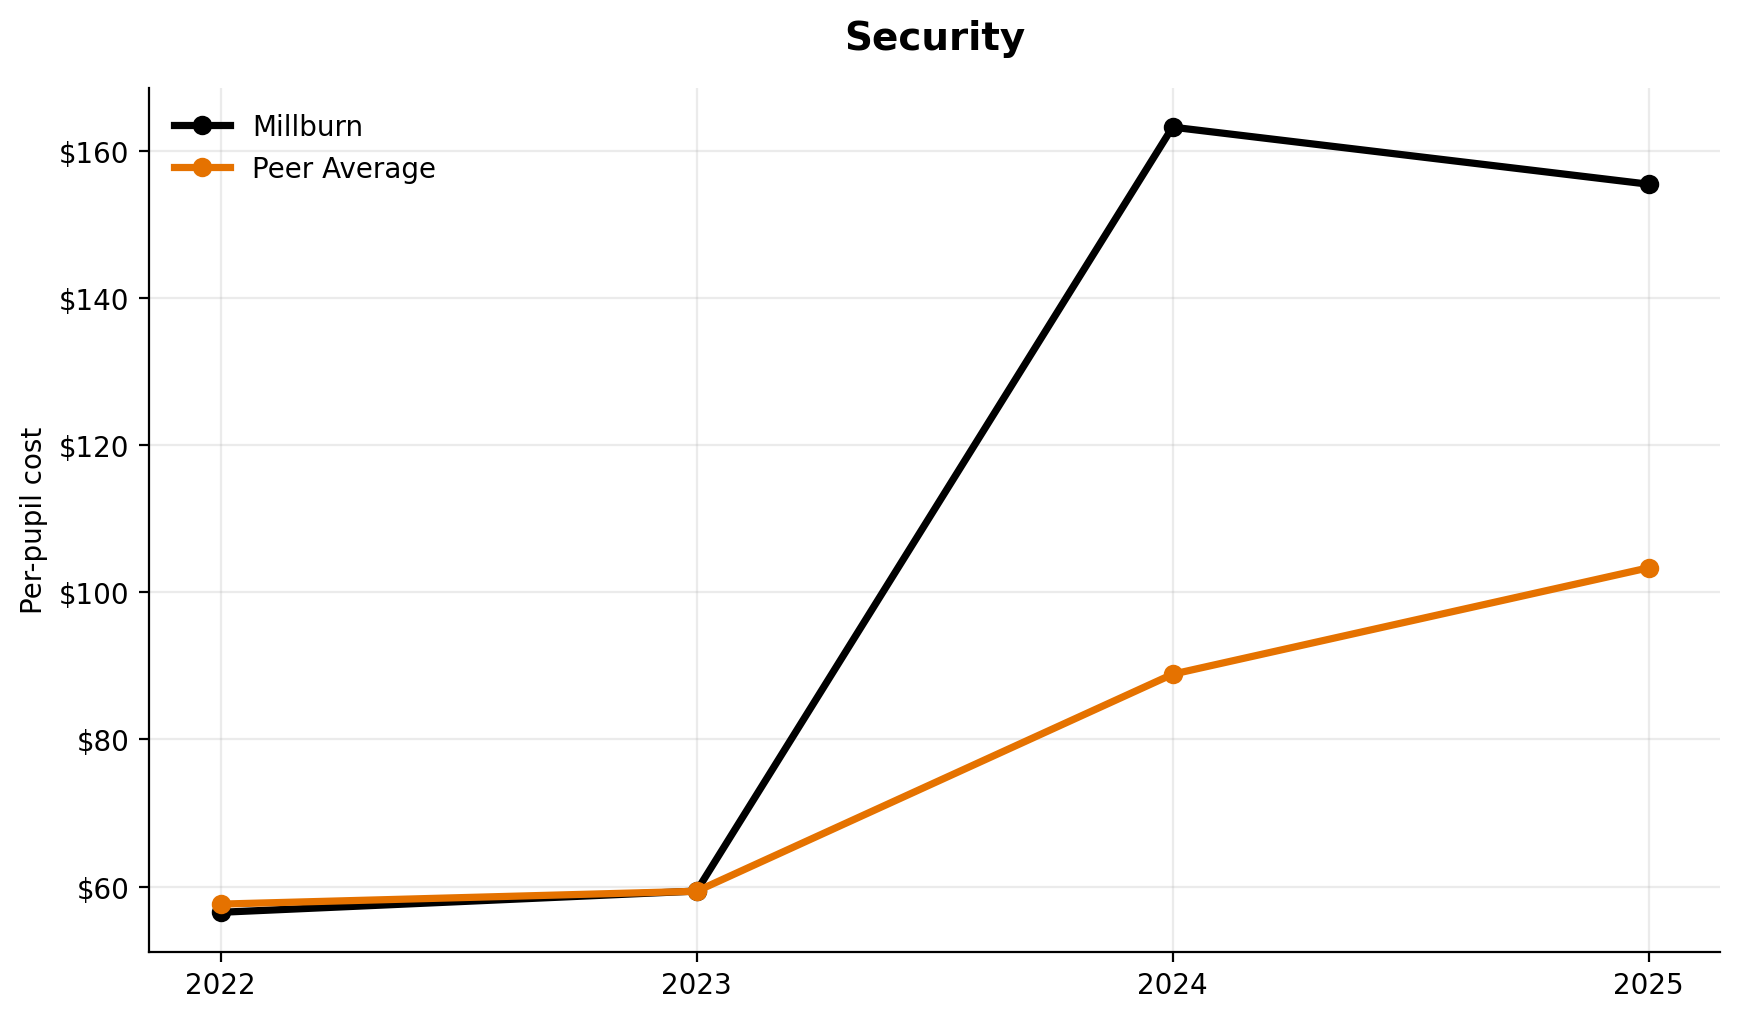
Security
Security ranks 3rd of 7 and uses a 2022-2025 per-pupil trend.
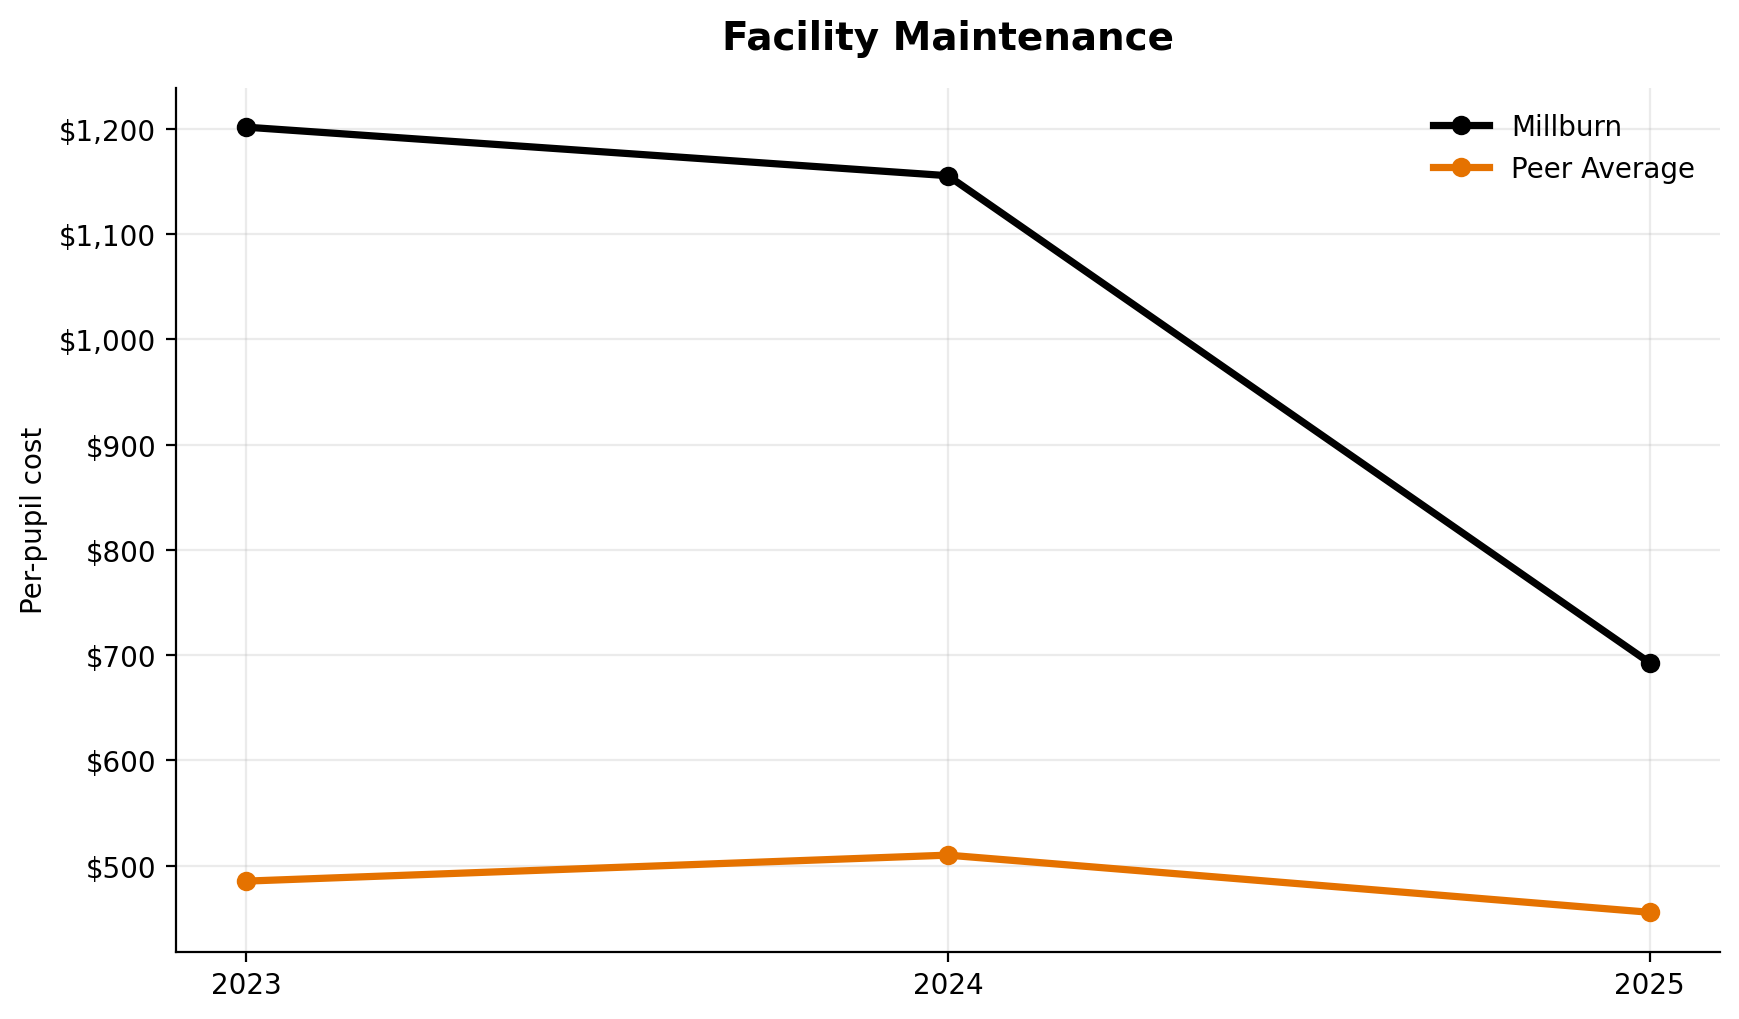
Facility Maintenance
Facility maintenance ranks 1st of 7 in 2025.
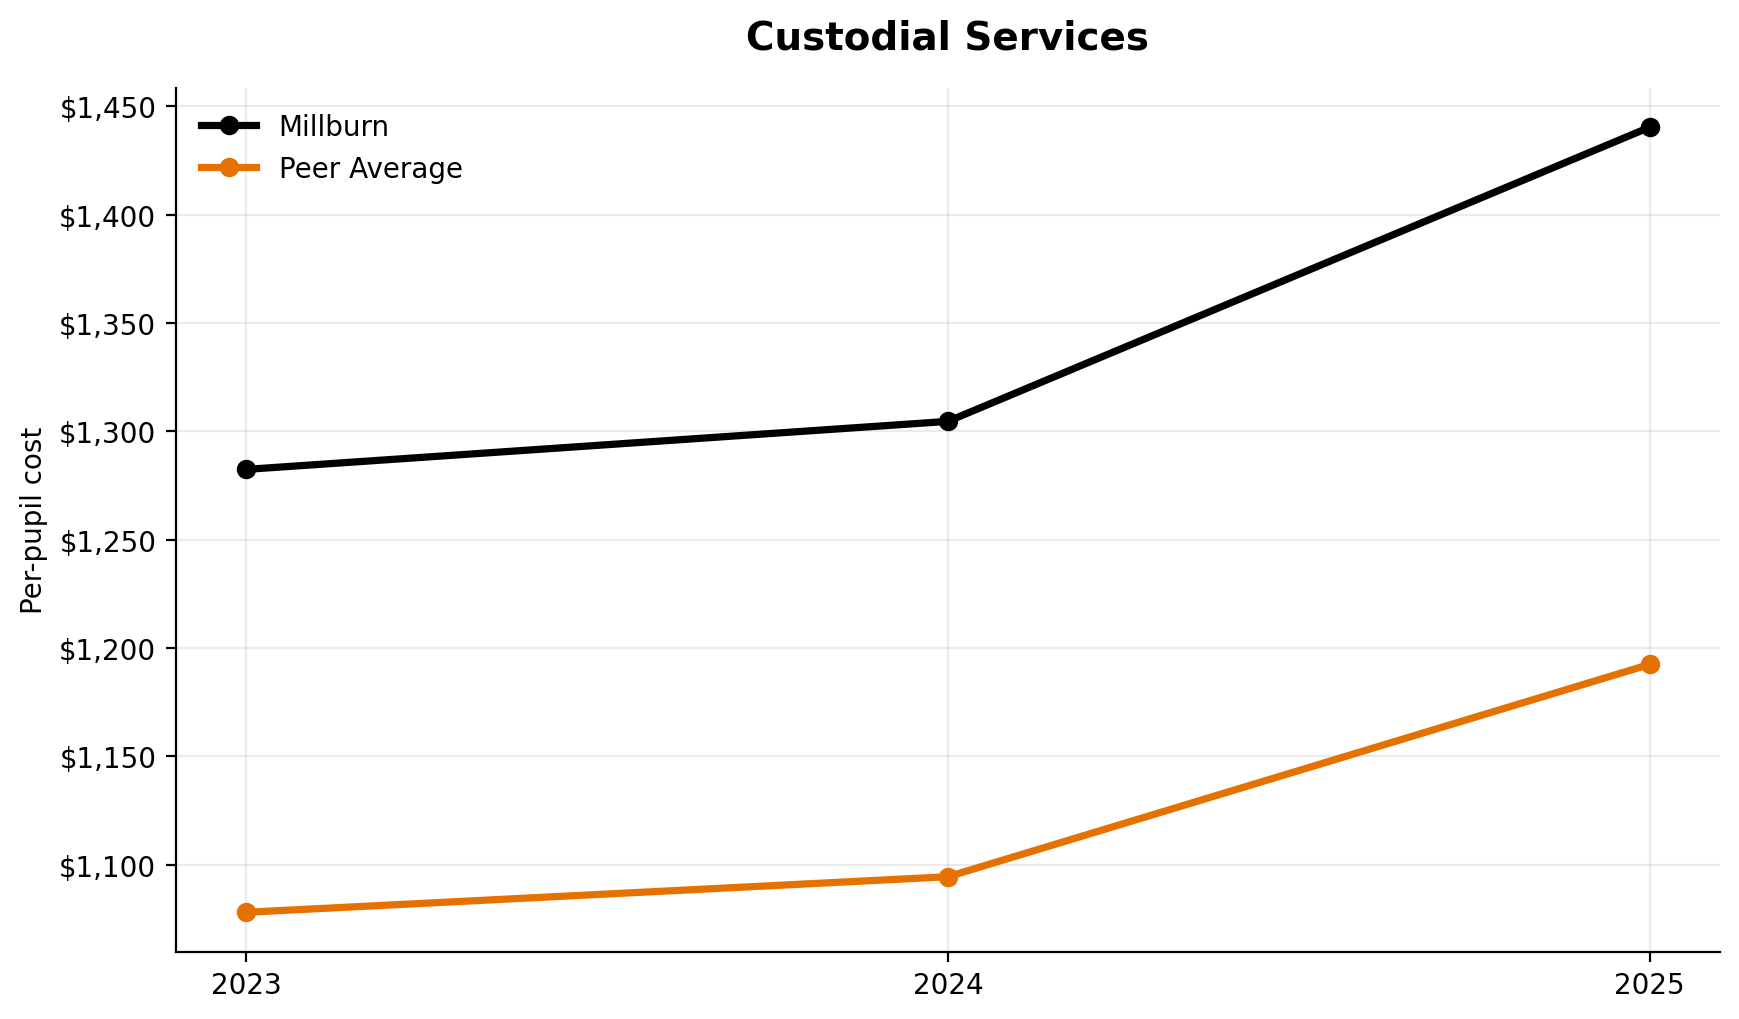
Custodial Services
Custodial services ranks 1st of 7.
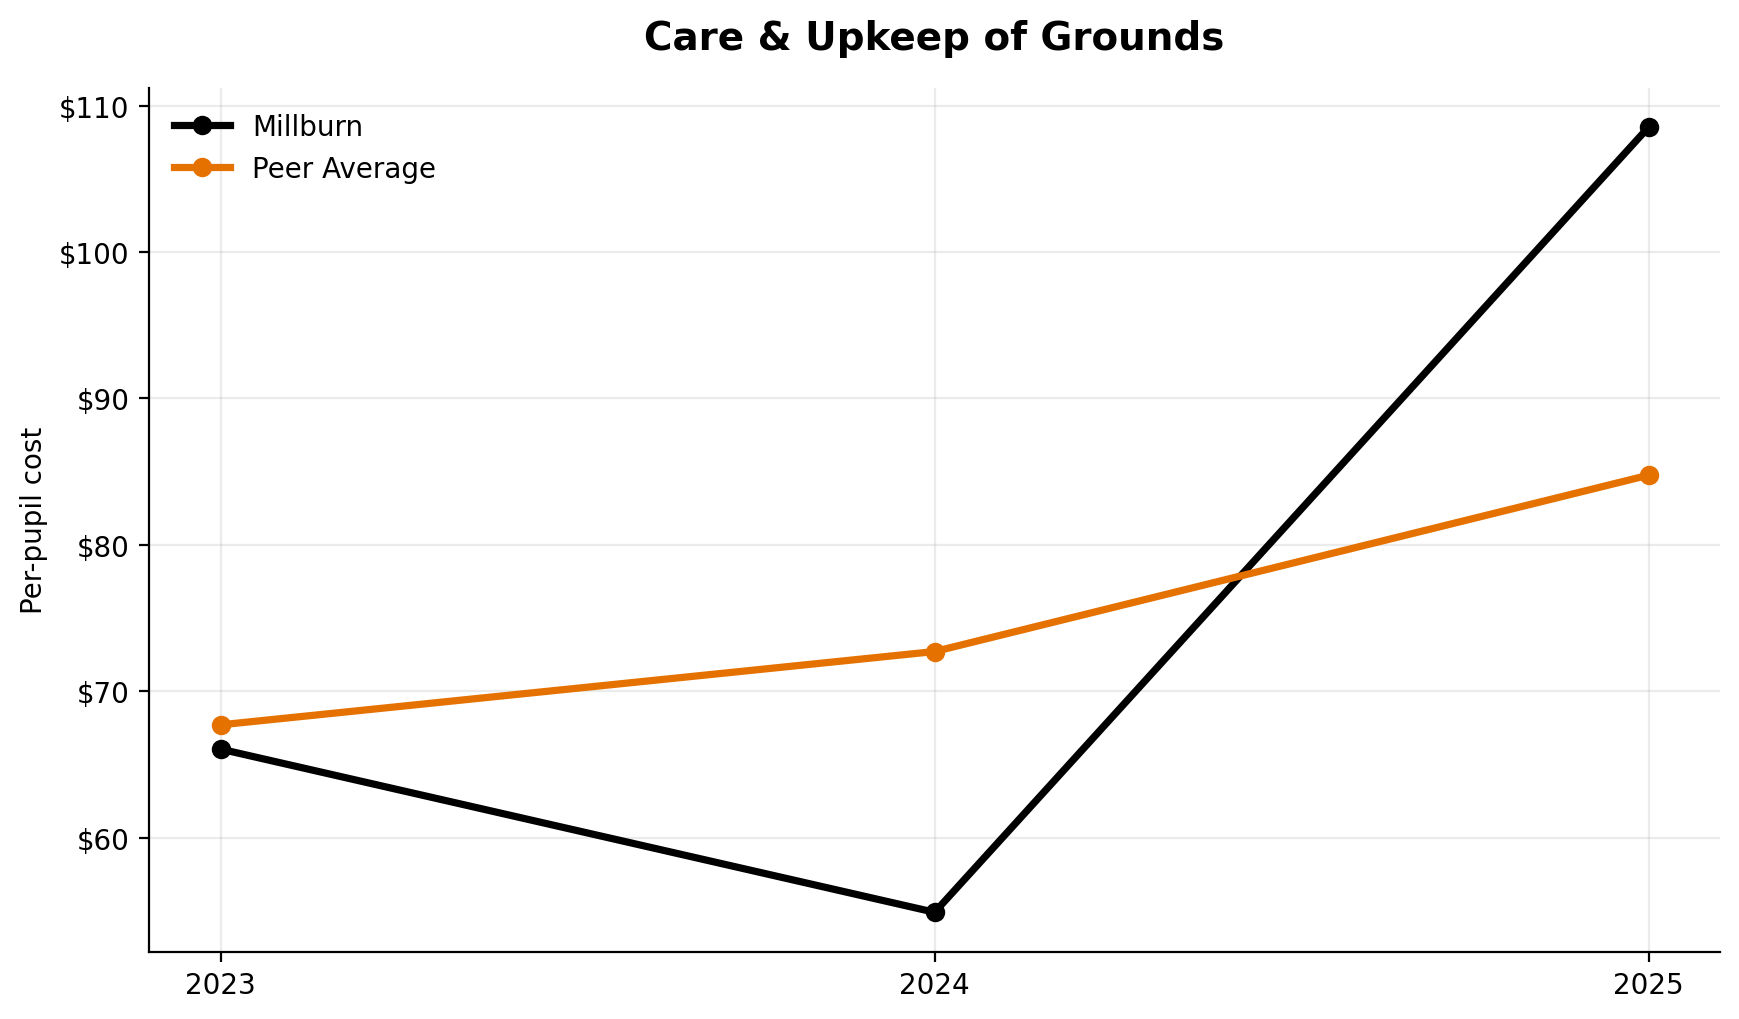
Care & Upkeep of Grounds
Grounds spending ranks 2nd of 7.