New Providence School District ACFR Profile
This page gives residents an apples-to-apples look at how New Providence compares with six peer districts using verified per-pupil ACFR data. A rank of 1st means the highest per-student spending in that category among the seven-district peer group. A lower spending rank is not automatically a bad sign. In New Providence’s case, it should be viewed alongside student performance and whether the district is delivering strong results without spending at the level of some peers.
1. Total District Overview
New Providence has the lowest total cost per pupil in the peer group and the lowest total instruction spend, but that does not automatically suggest underperformance or neglect. When lower spending exists alongside comparatively strong proficiency, it can also point to a district that is getting more out of each dollar than some of its peers. That makes the district’s few high-cost outliers more important to examine, not less.
Top-Line Position
- Total Cost Per Pupil: 7th of 7 ($25,487)
- Instruction (All Categories): 7th of 7 ($8,914)
- Total Administration: 1st of 7
How Residents Should Read That
- Being last in total cost per pupil is not inherently a problem if student outcomes remain strong.
- The more revealing question is why a lower-cost district still ranks 1st in total administration.
- If New Providence is performing well without spending what its peers spend, that may strengthen the case for efficiency in some areas while making its outlier categories harder to justify.
2. Core Instruction & Classroom Spending
New Providence’s classroom spending profile is clearly lower than its peers. On its own, that might raise concern. But if proficiency remains comparatively strong, residents should read this less as a warning sign and more as a prompt to ask how the district is structuring instruction and whether those choices are working better than higher-spending models elsewhere.
Where New Providence Ranks
- Regular Programs: 7th of 7
- Staff Training: 4th of 7
- Textbooks: 7th of 7
- Improvement of Instruction: 7th of 7
What Stands Out
New Providence spends less than its peers in several core instructional categories, but the district’s broader academic picture matters here. If performance is holding up or outperforming districts that spend more, the takeaway is not simply that New Providence is “behind.” It may mean the district is operating more efficiently in core instruction than some higher-cost peers.
5. Administration & Technology
This is where New Providence becomes especially interesting. A district that is low-spending overall but ranks at the top in total administration should not be described as simply cheap or lean. It suggests the district may be controlling costs in some areas while allowing others to run high.
Where New Providence Ranks
- Gen Admin (Total Sub-Account): 3rd of 7
- Employee Benefits: 3rd of 7
- Admin Information Tech: 1st of 7
- Legal Fees: 7th of 7
- School Administration: 6th of 7
- Central Services: 7th of 7
- Total Administration: 1st of 7
What Stands Out
The real tension in New Providence’s profile is not that it spends less overall. It is that a lower-cost district with solid performance still ranks 1st in total administration and 1st in admin information tech. That does not erase the district’s efficient overall profile, but it does create a legitimate question about whether those particular overhead categories are proportionate.
3. Special Education Services
New Providence’s special education picture is unusually split, with several lowest-ranked categories and a few lines at the very top.
Where New Providence Ranks
- Special Education (Total): 7th of 7
- Resource Room: 7th of 7
- Autism: 7th of 7
- Child Study Teams: 6th of 7
- Speech, OT, PT & Related Services: 4th of 7
- Learning & Language Disabilities: 1st of 7
- Other Support (Extra Services): 7th of 7
- Other School Placement: 1st of 7
What Stands Out
This is one of the most uneven sections on the page. New Providence ranks 1st of 7 in both learning & language disabilities and other school placement, but also ranks 7th of 7 in total special education, resource room, autism, and other support (extra services).
4. Student Activities & Support Services
These categories reflect counseling, activities, health services, library/media, bilingual support, and remedial services.
Where New Providence Ranks
- Athletics: 2nd of 7
- Guidance: 4th of 7
- Health Services: 7th of 7
- Educational Media Services (Library): 4th of 7
- Bilingual Education: 5th of 7
- Cocurricular Activities: 3rd of 7
- Basic Skills / Remedial: 6th of 7
What Stands Out
Student-support spending is mixed. Athletics ranks 2nd of 7 and cocurricular activities ranks 3rd of 7, but health services ranks 7th of 7 and basic skills/remedial ranks 6th of 7.
5. Administration & Technology
This is one of New Providence’s strongest sections. Several administrative categories rank near the top, including total administration itself.
Where New Providence Ranks
- Gen Admin (Total Sub-Account): 3rd of 7
- Employee Benefits: 3rd of 7
- Admin Information Tech: 1st of 7
- Legal Fees: 7th of 7
- School Administration: 6th of 7
- Central Services: 7th of 7
- Gen Admin (Misc): 3rd of 7
What Stands Out
New Providence ranks 1st of 7 in admin information tech and 1st of 7 in total administration overall, even while ranking at the bottom in legal fees and central services and near the bottom in school administration. This is another category-composition story, not a simple one-line conclusion.
6. Operations, Safety & Maintenance
These are the costs of running the district day to day: transportation, security, facility maintenance, custodial services, and grounds.
Where New Providence Ranks
- Care & Upkeep of Grounds: 6th of 7
- Transportation: 6th of 7
- Facility Maintenance: 6th of 7
- Security: 6th of 7
- Custodial Services: 7th of 7
What Stands Out
Operations is a relatively low-spending section for New Providence. Transportation, security, facility maintenance, and grounds all rank near the bottom, while custodial services ranks 7th of 7.
Trend Charts
These charts show not just where New Providence ranks in 2025, but how spending has moved over time relative to the seven-district average.
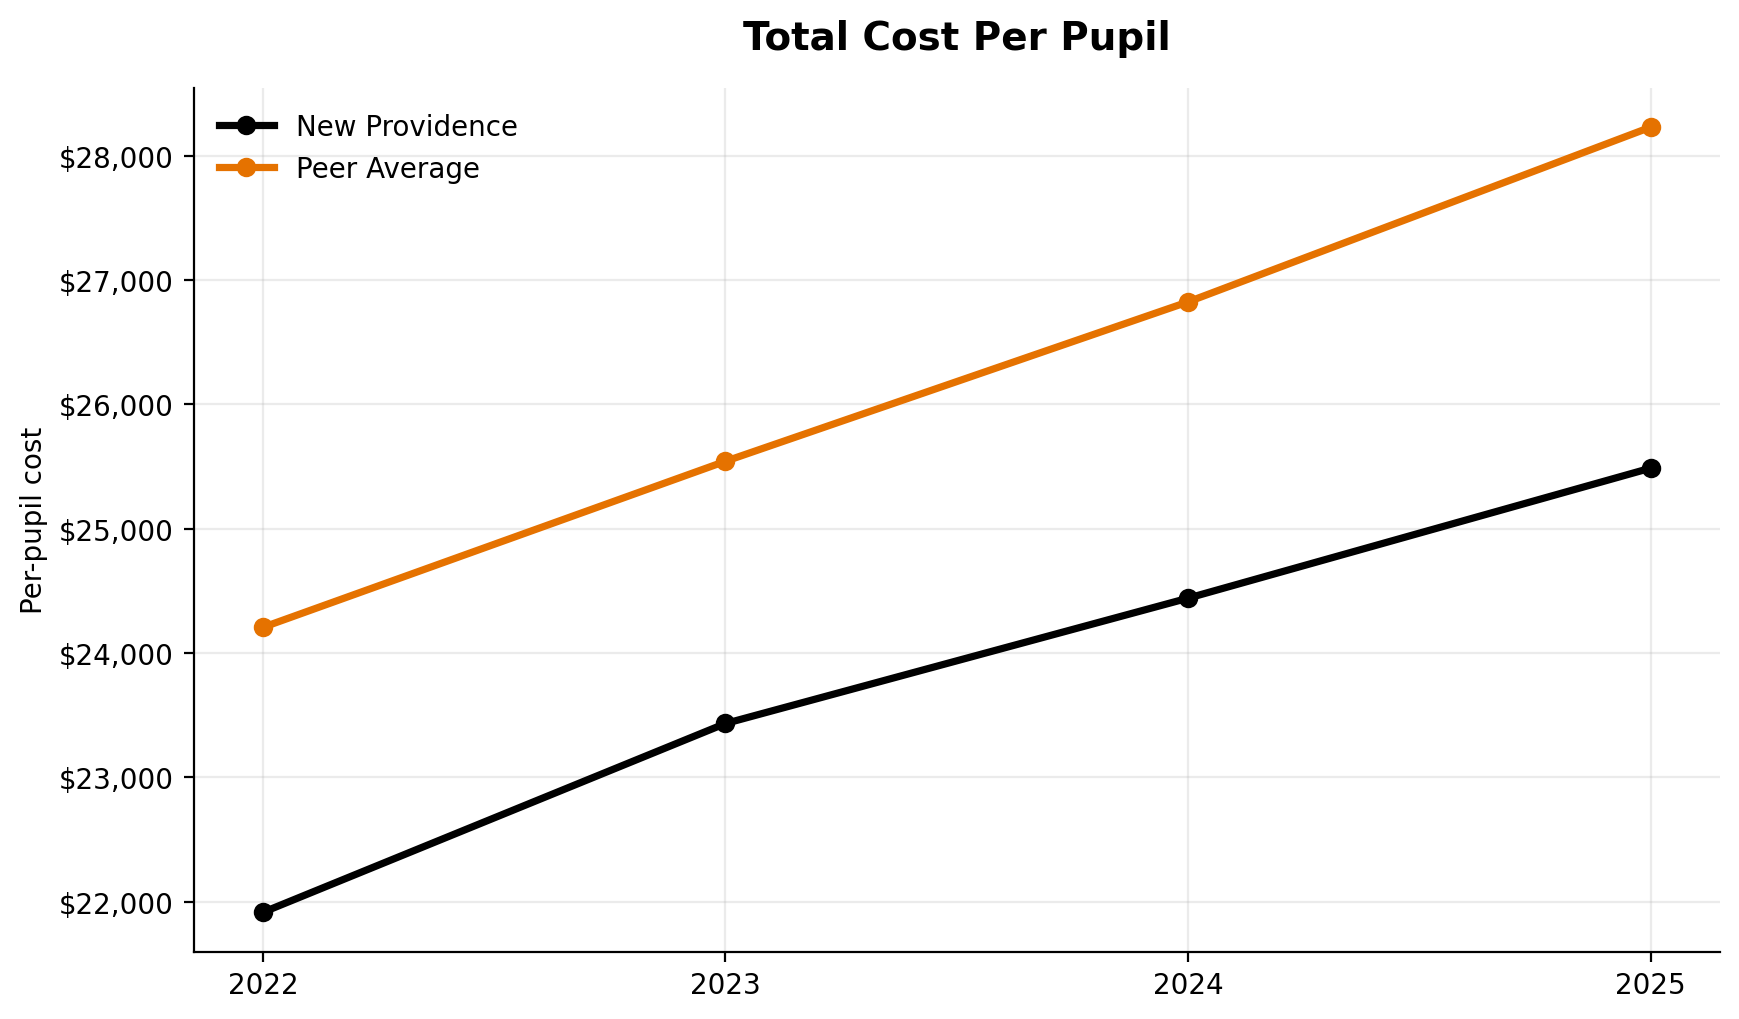
Total Cost Per Pupil
New Providence ranks 7th of 7 overall on total per-pupil cost.
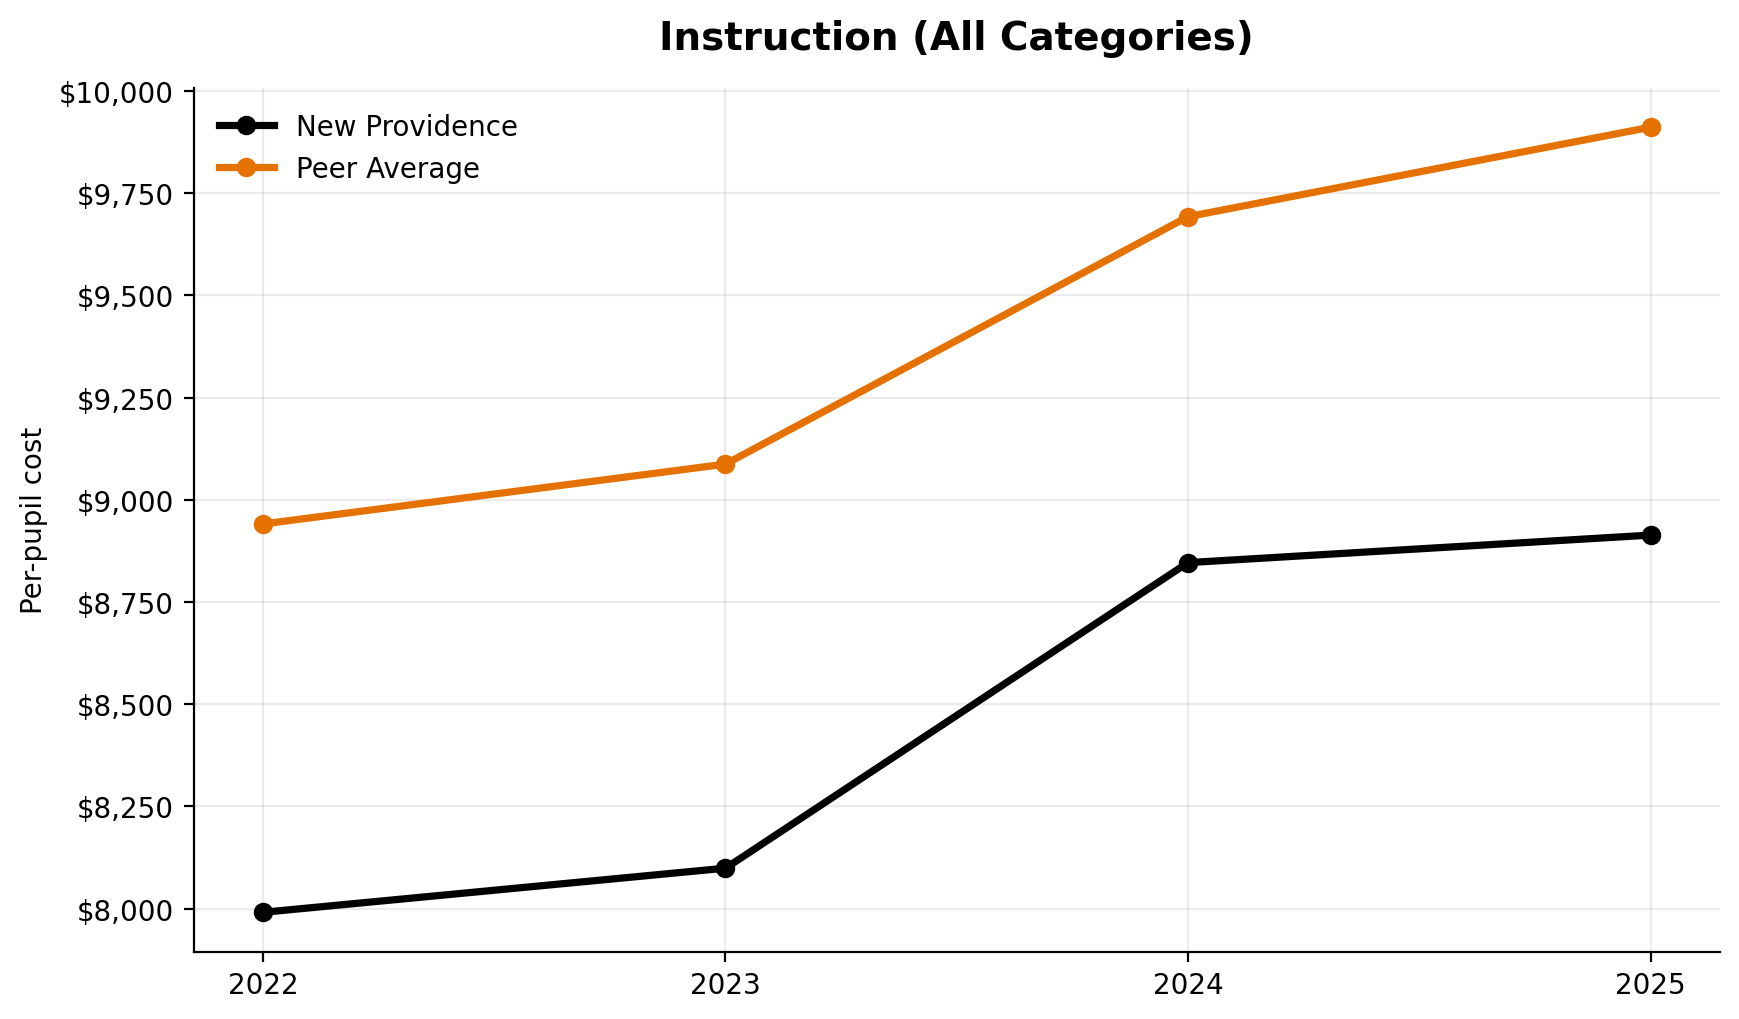
Instruction (All Categories)
Total instruction ranks 7th of 7 in 2025.
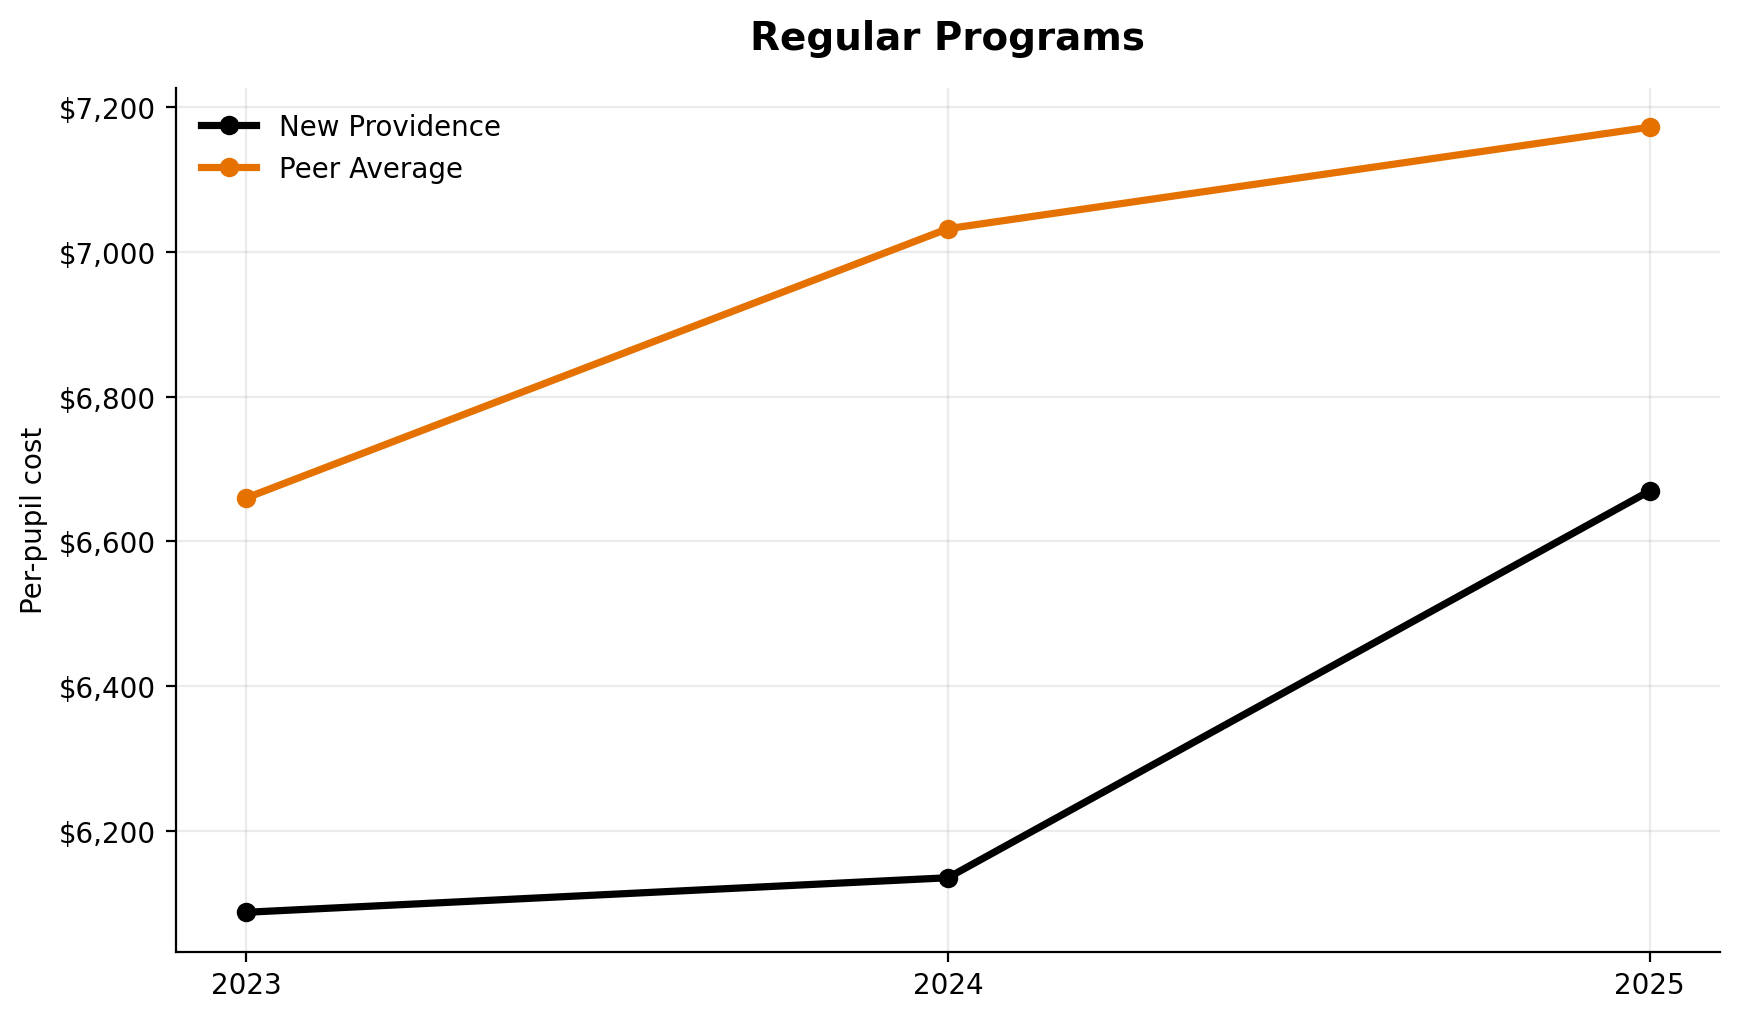
Regular Programs
Regular classroom instruction ranks 7th of 7.
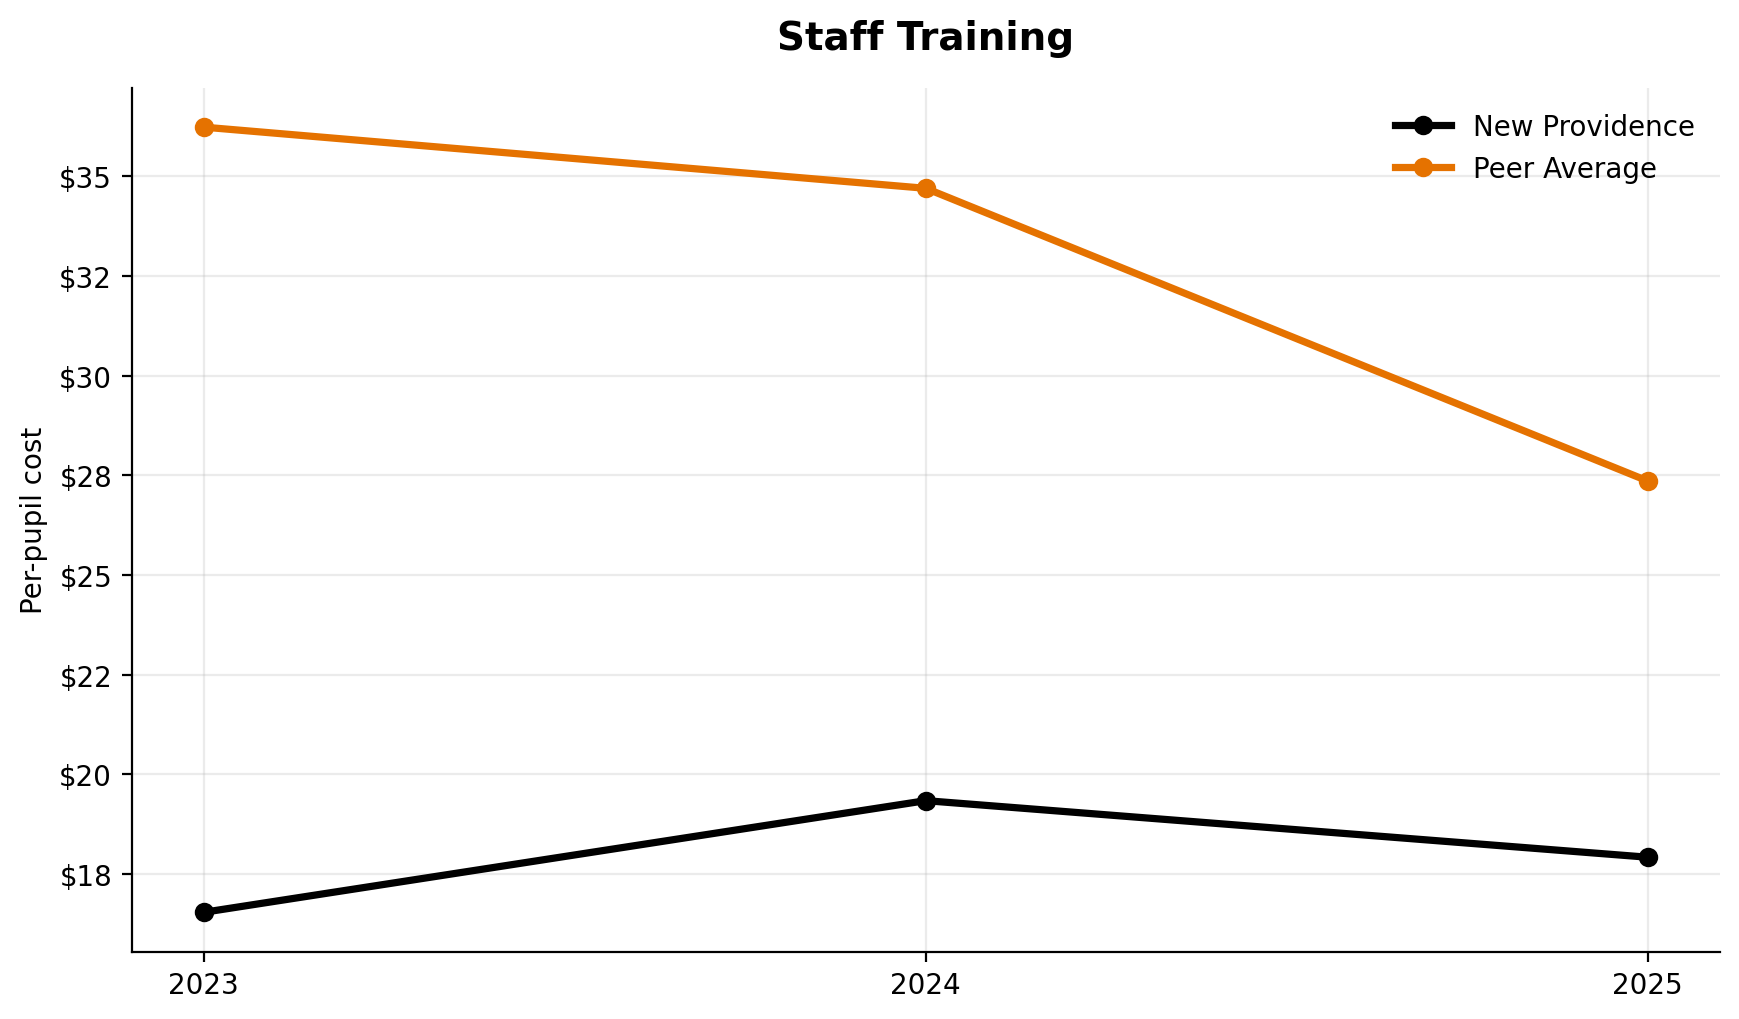
Staff Training
Staff training lands 4th of 7.
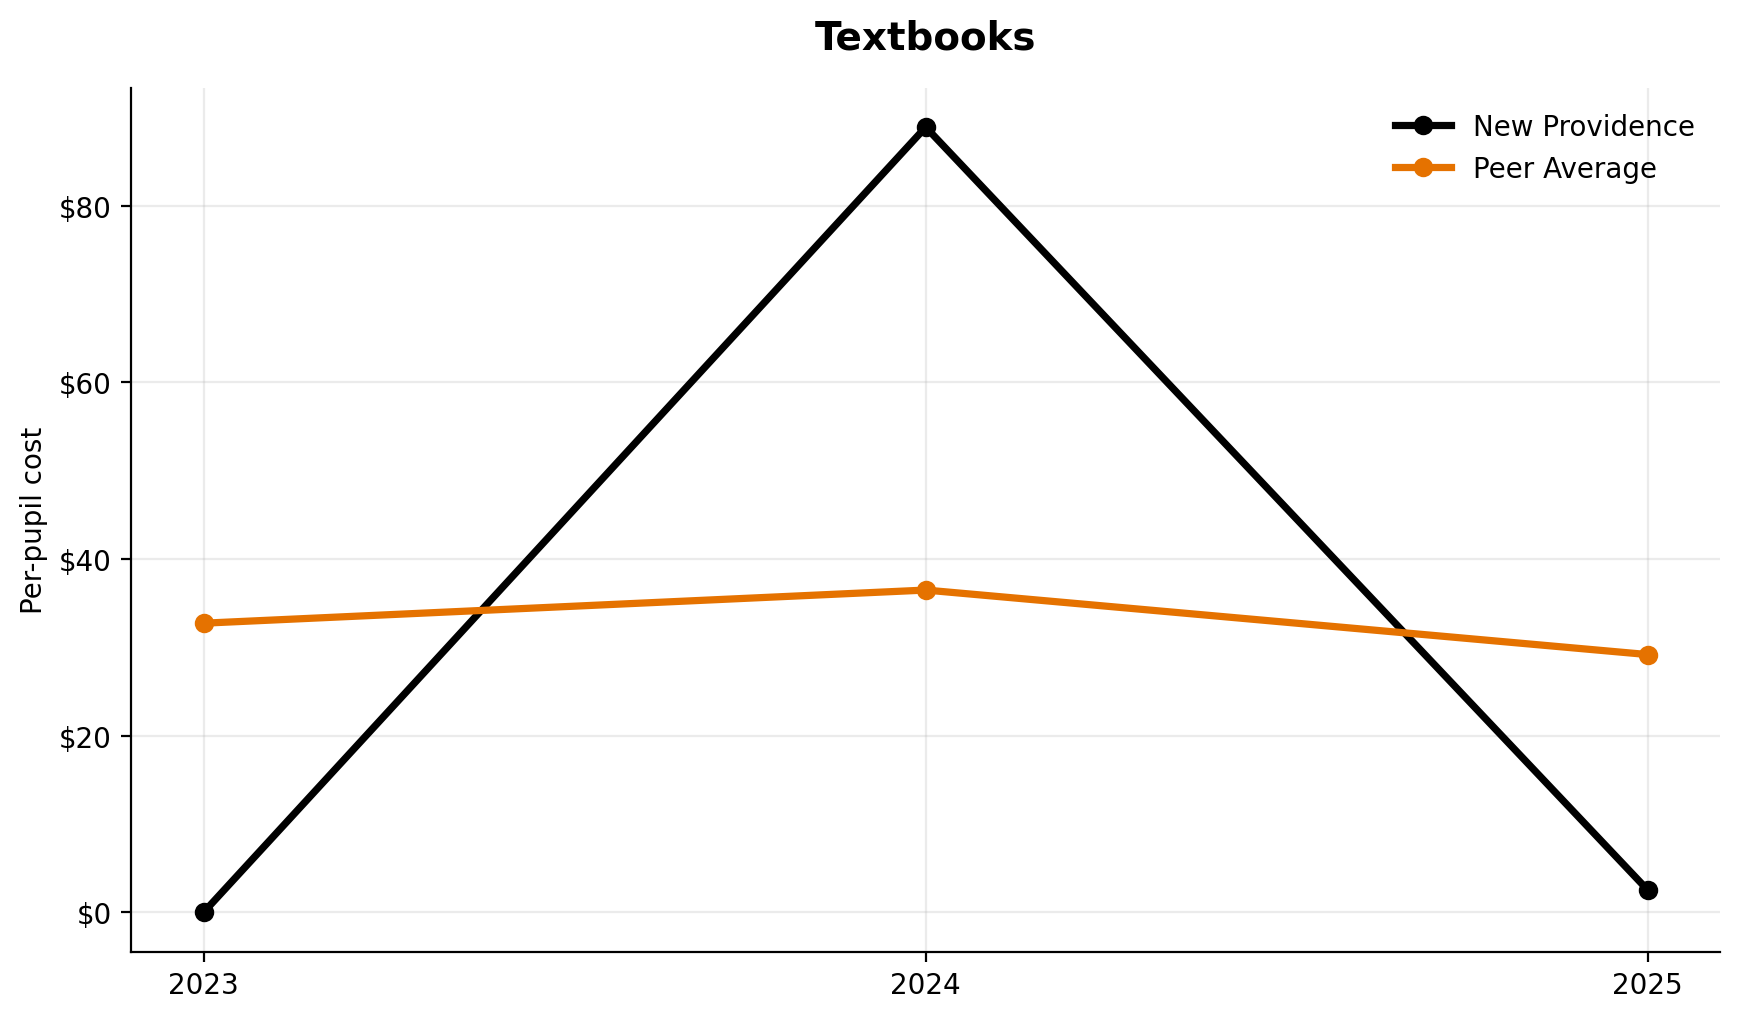
Textbooks
Textbook spending ranks 7th of 7.
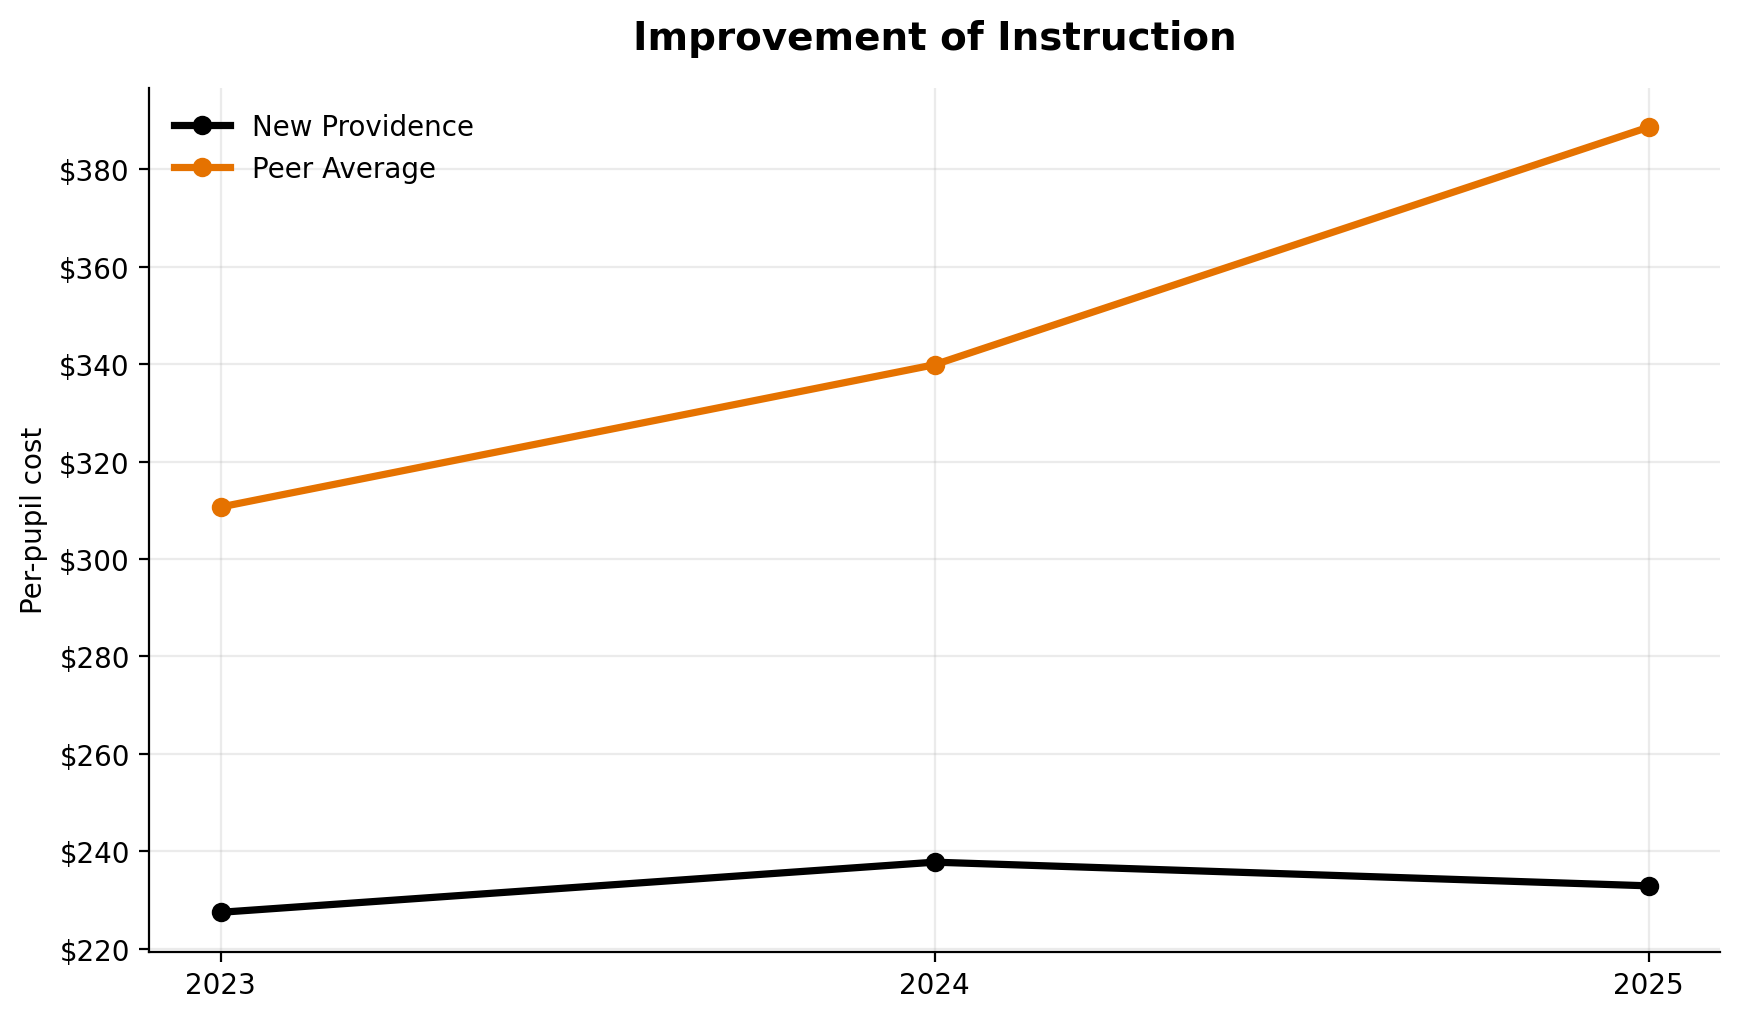
Improvement of Instruction
This category ranks 7th of 7.
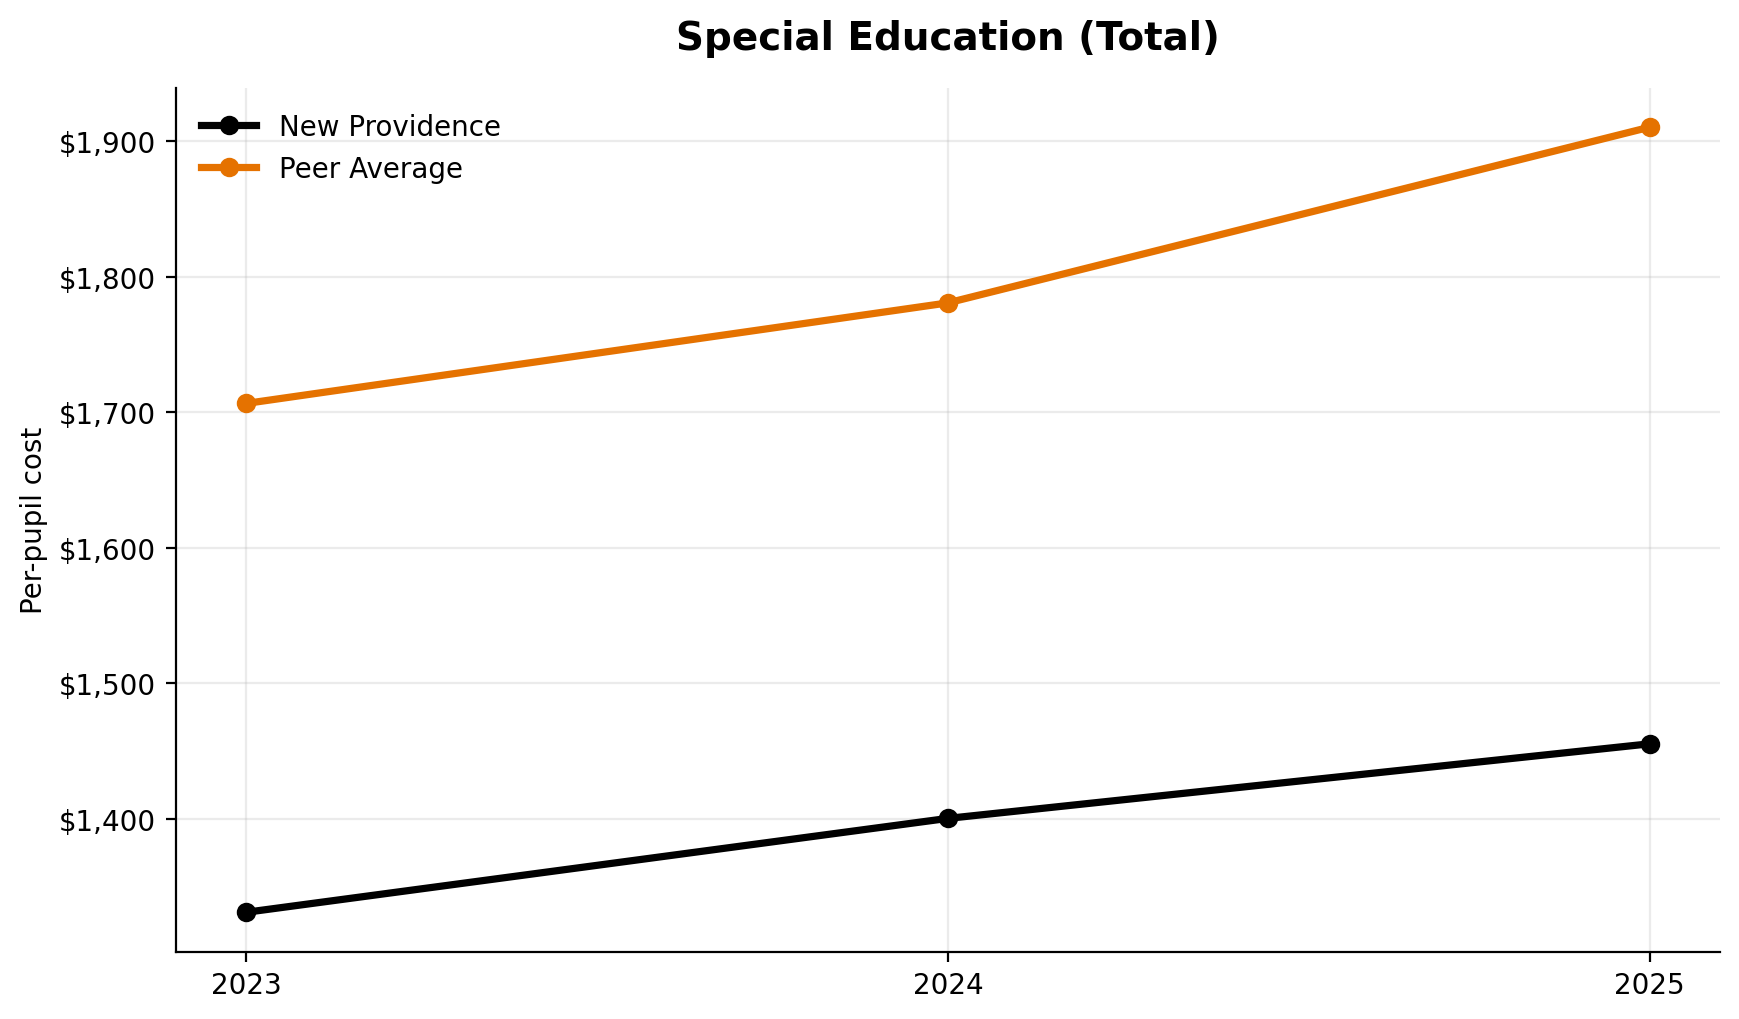
Special Education (Total)
Total special education ranks 7th of 7.
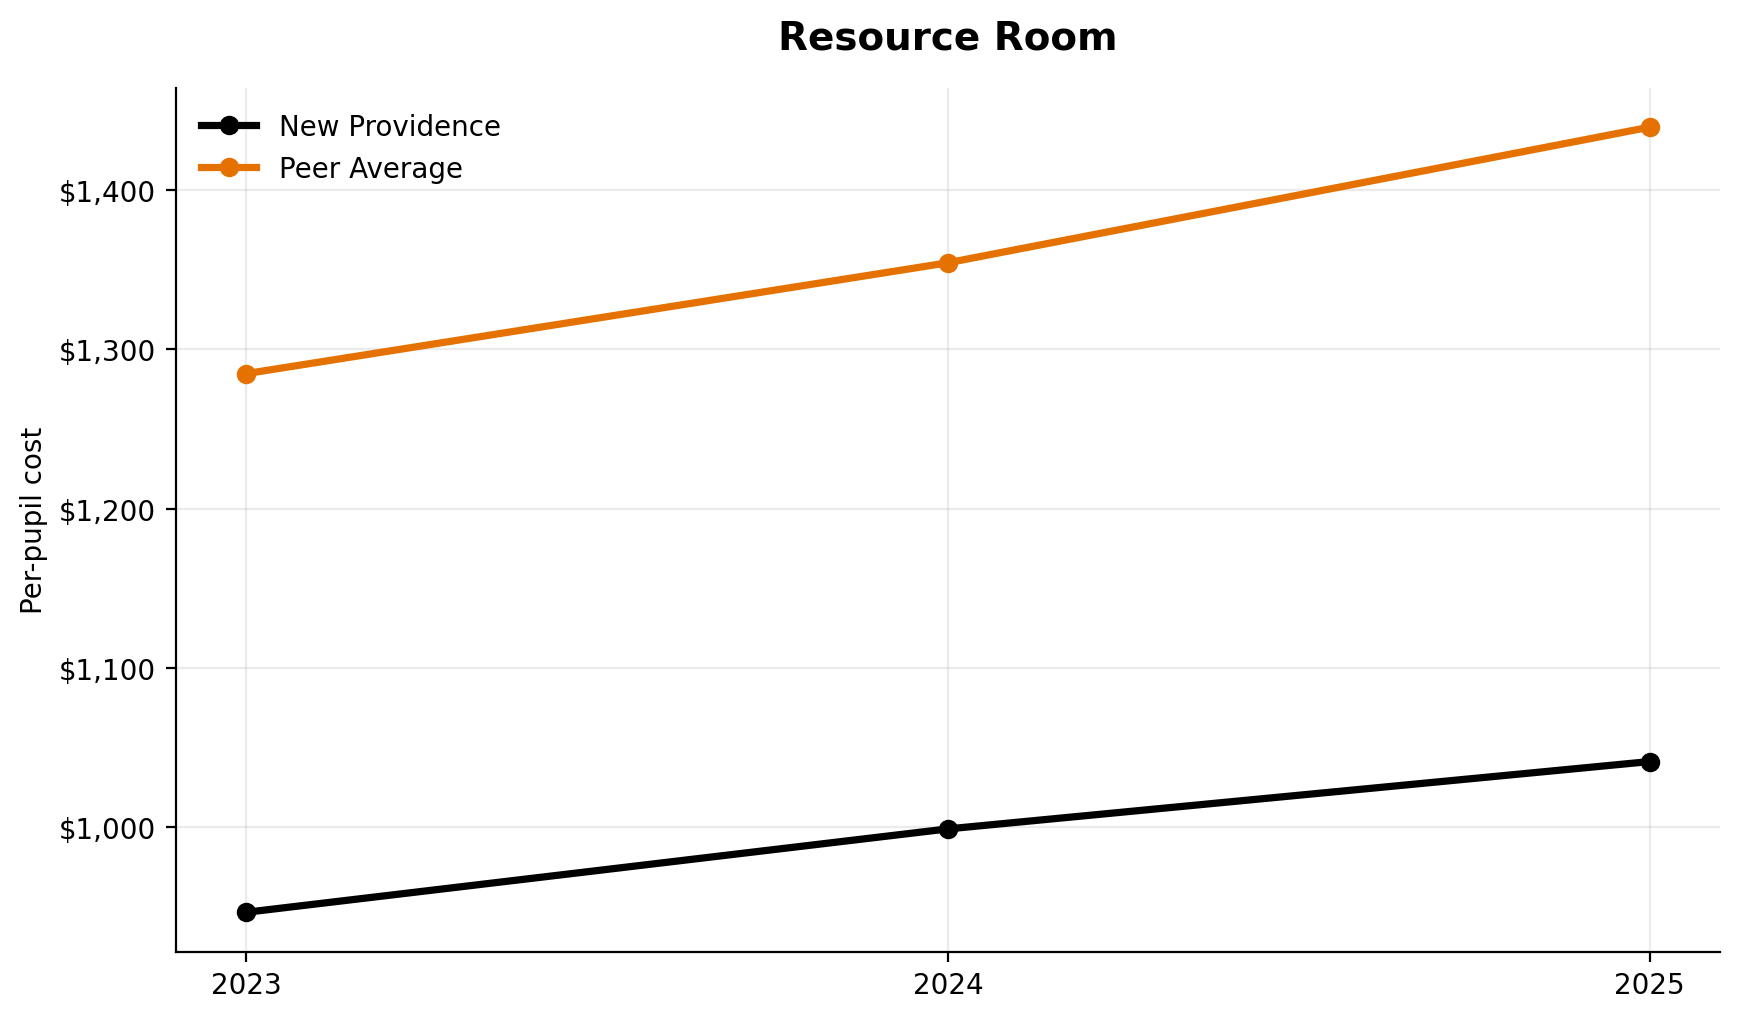
Resource Room
Resource room spending ranks 7th of 7.
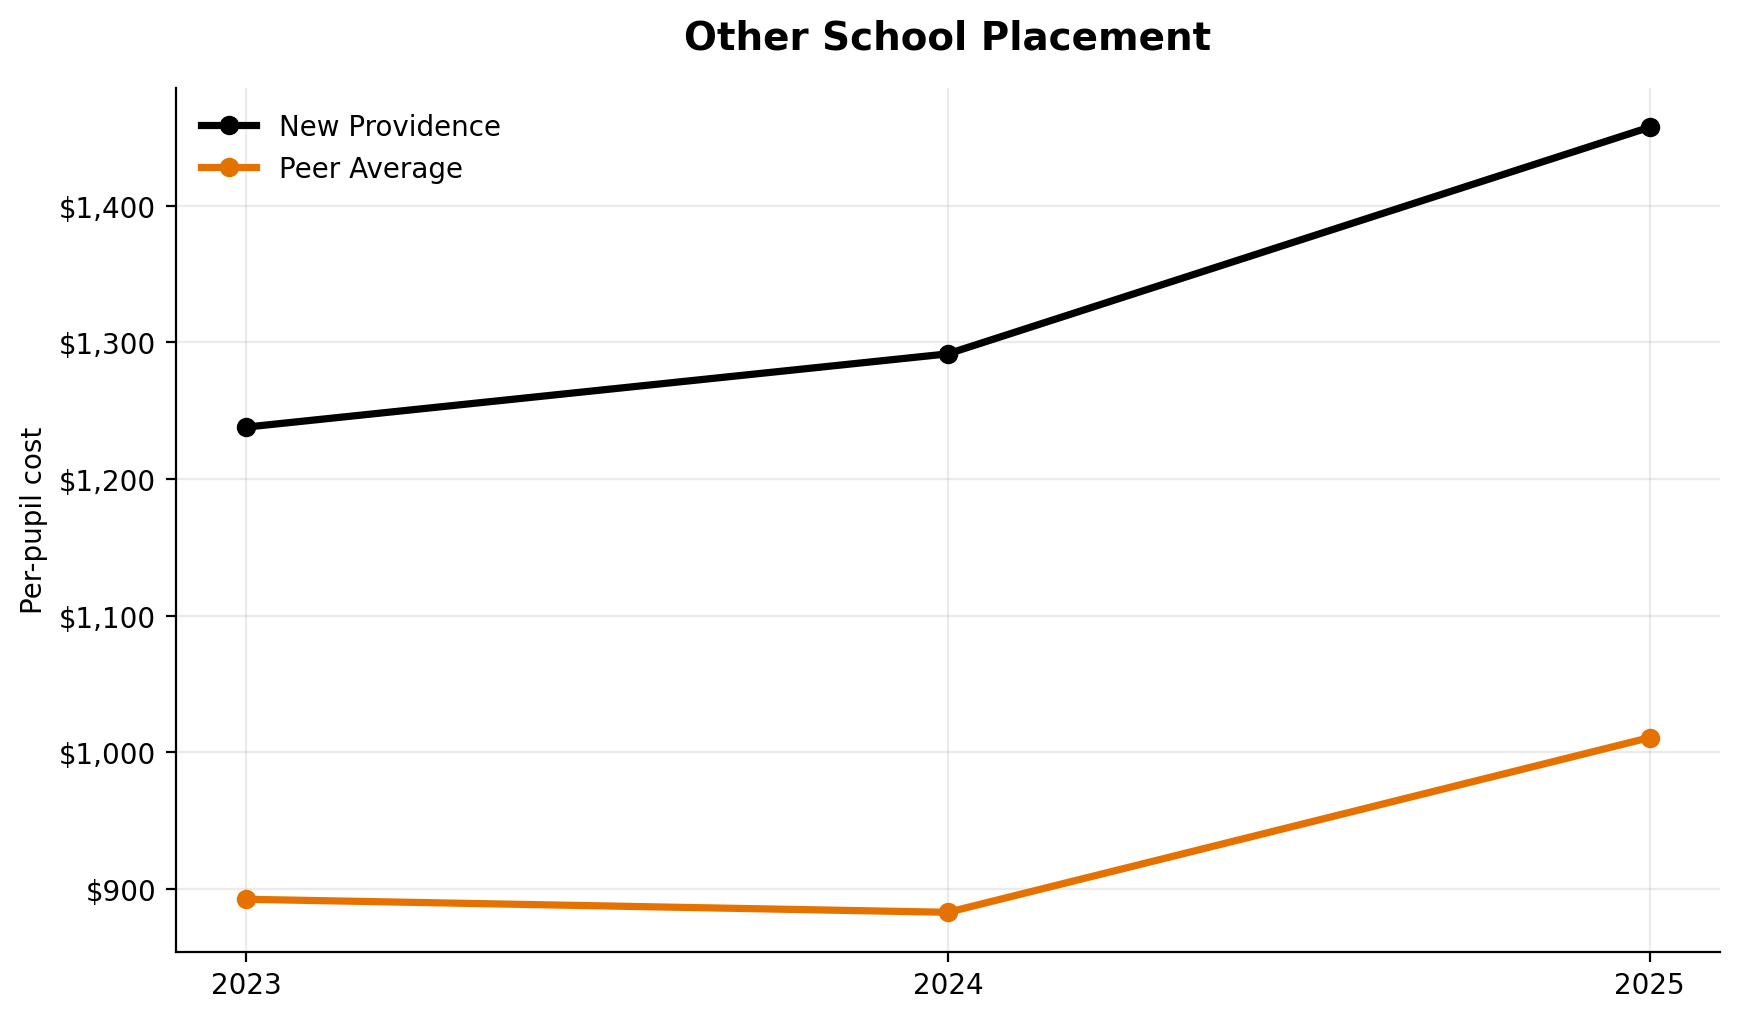
Other School Placement
Out-of-district placement ranks 1st of 7.
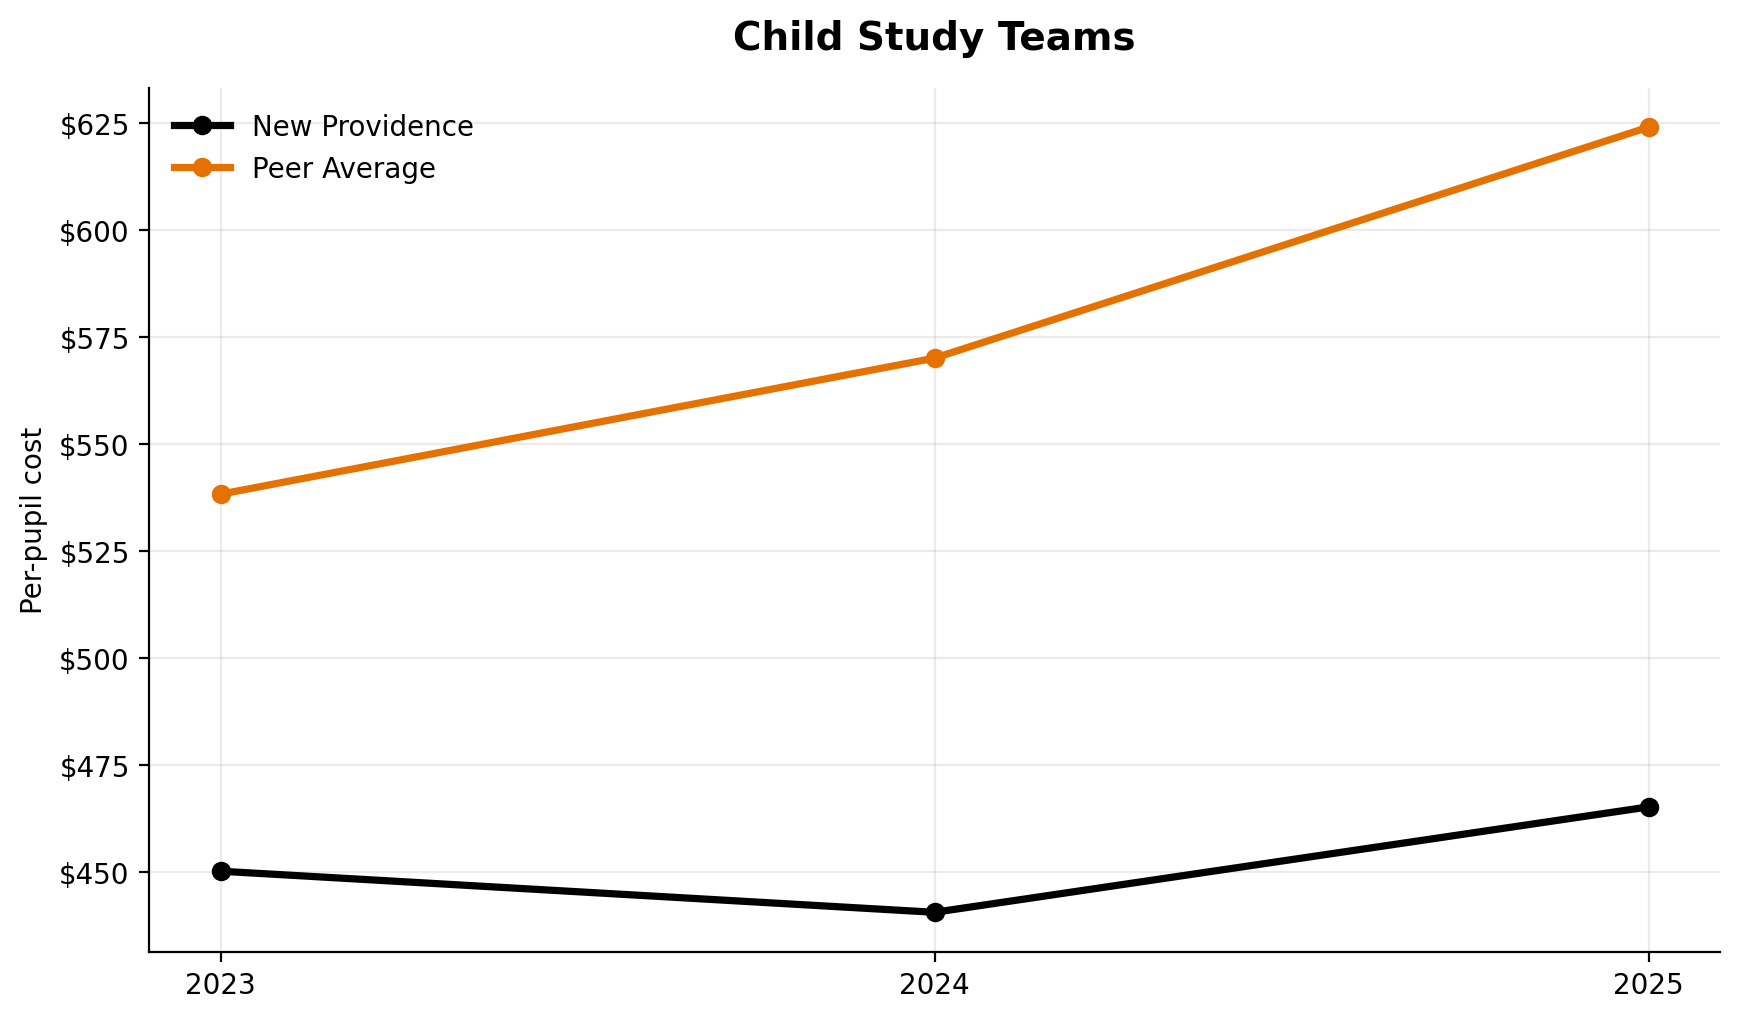
Child Study Teams
Child study teams ranks 6th of 7.
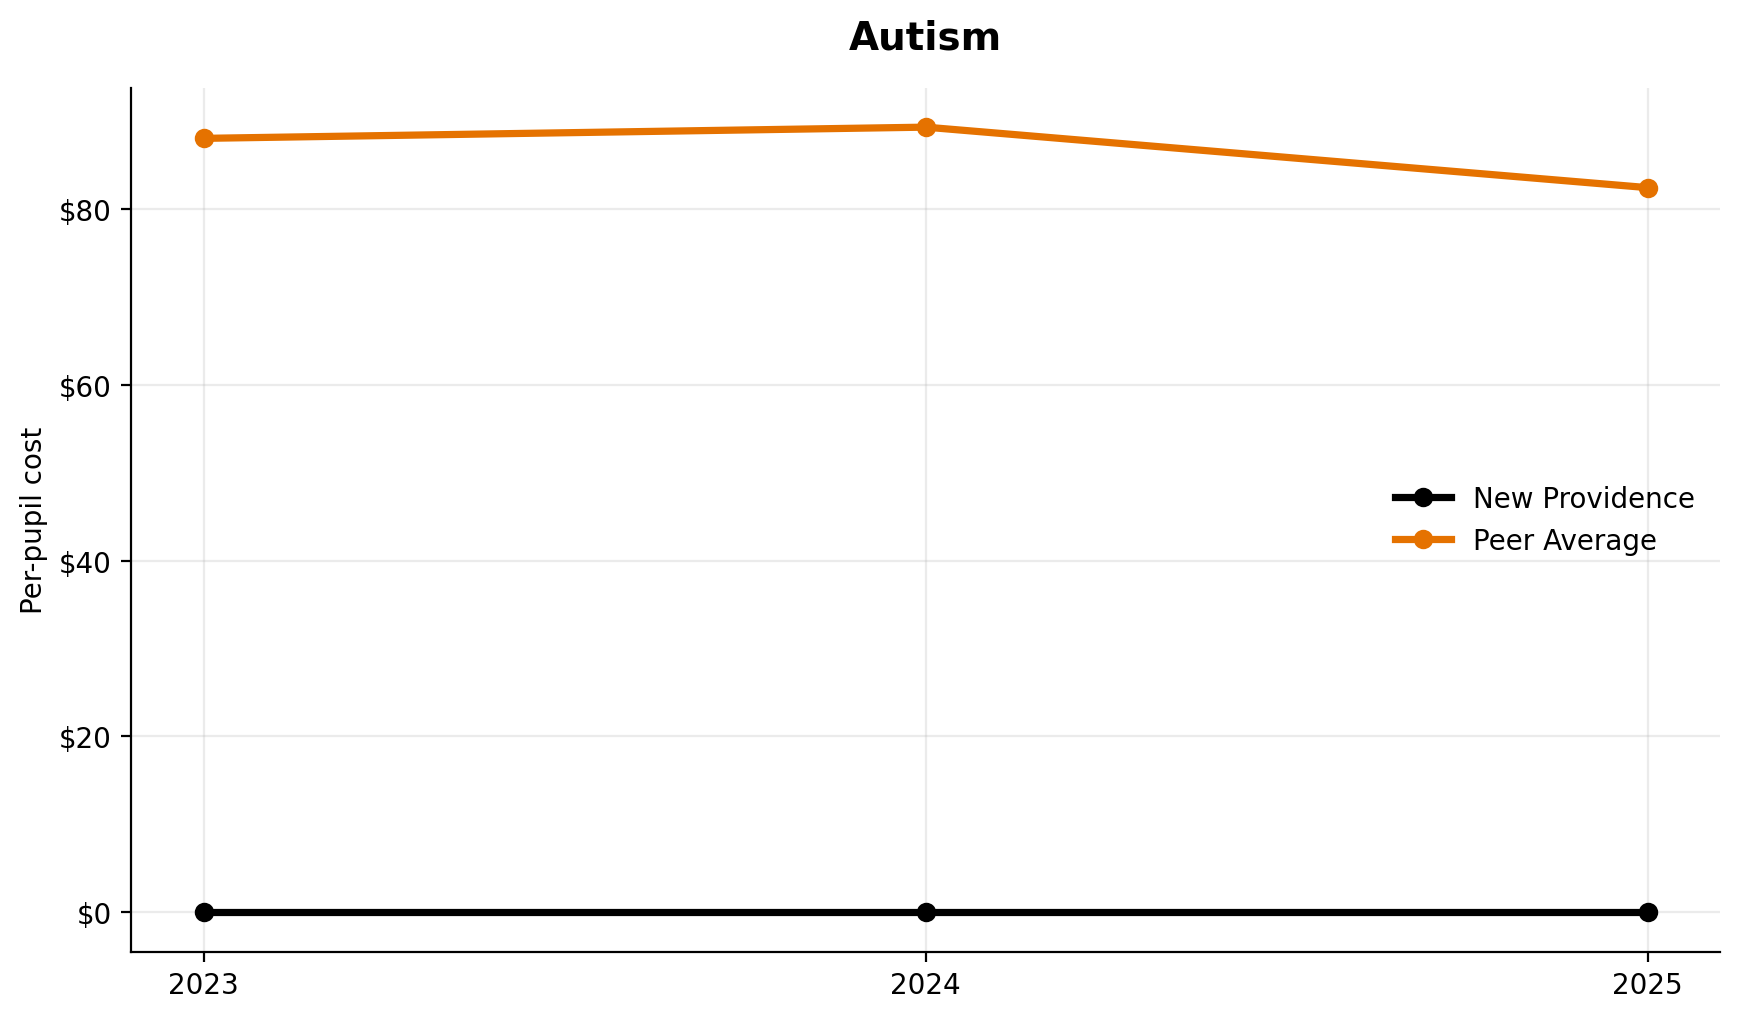
Autism
Autism services rank 7th of 7.
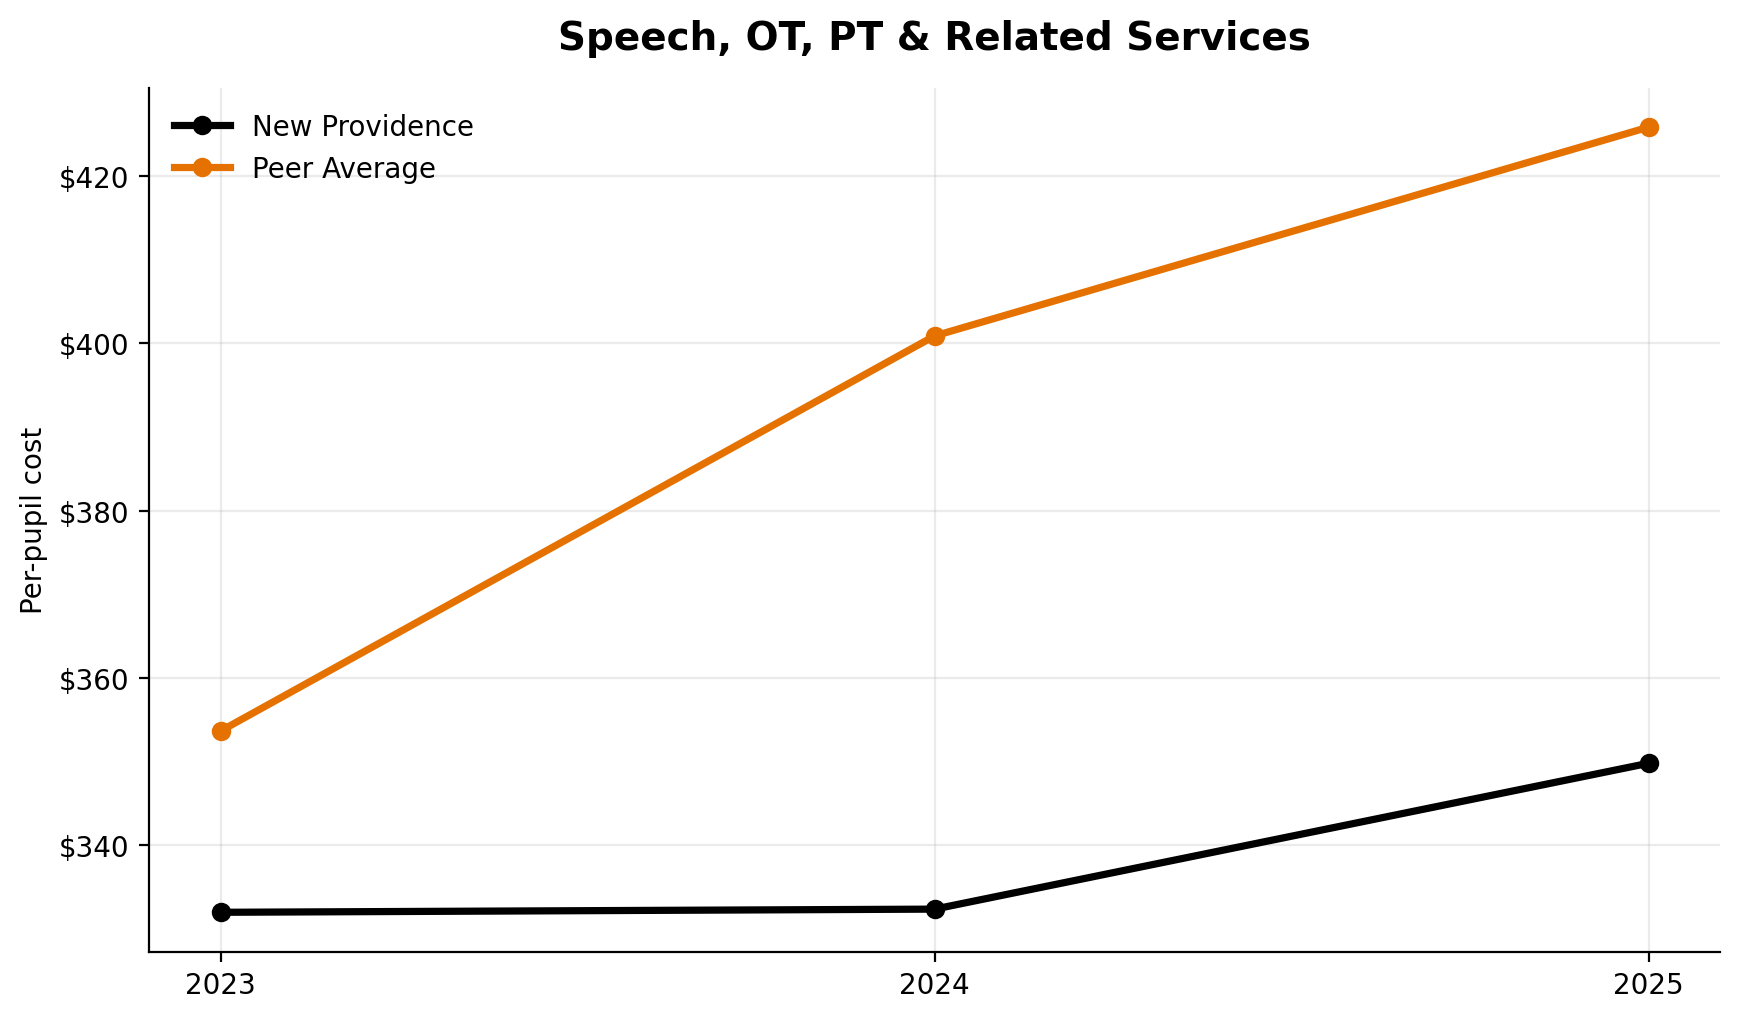
Speech, OT, PT & Related Services
Speech-related services rank 4th of 7.
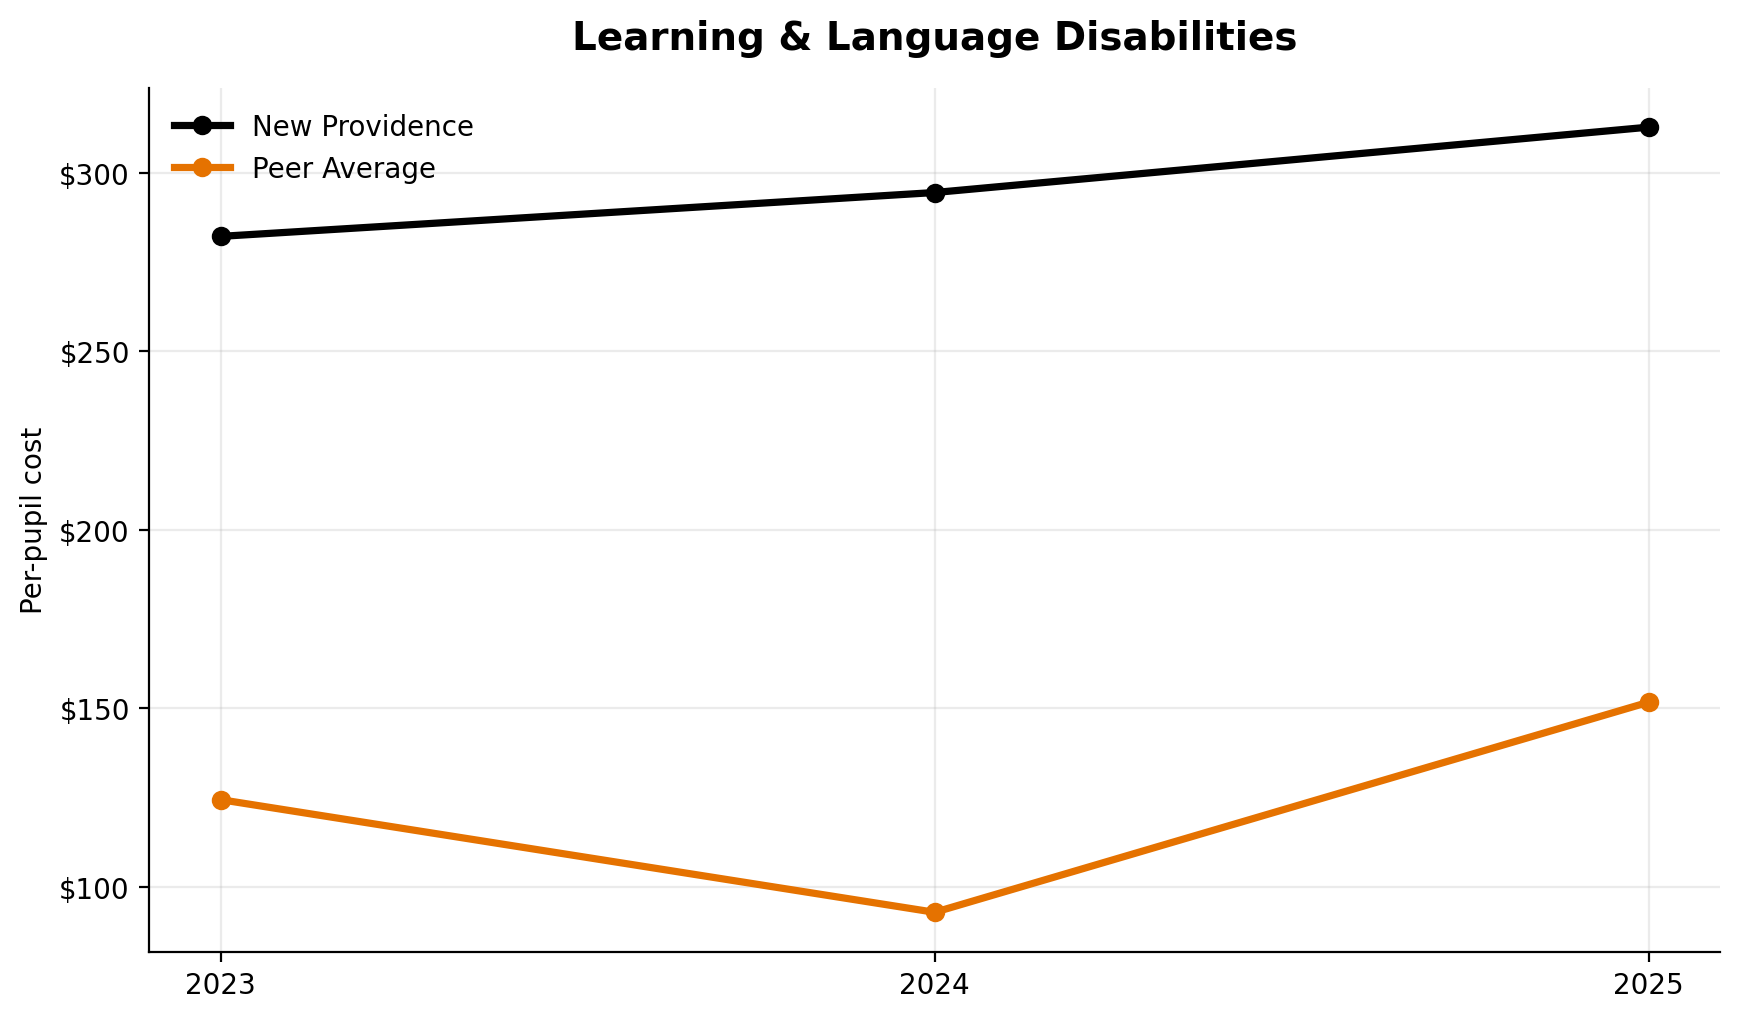
Learning & Language Disabilities
This category ranks 1st of 7.
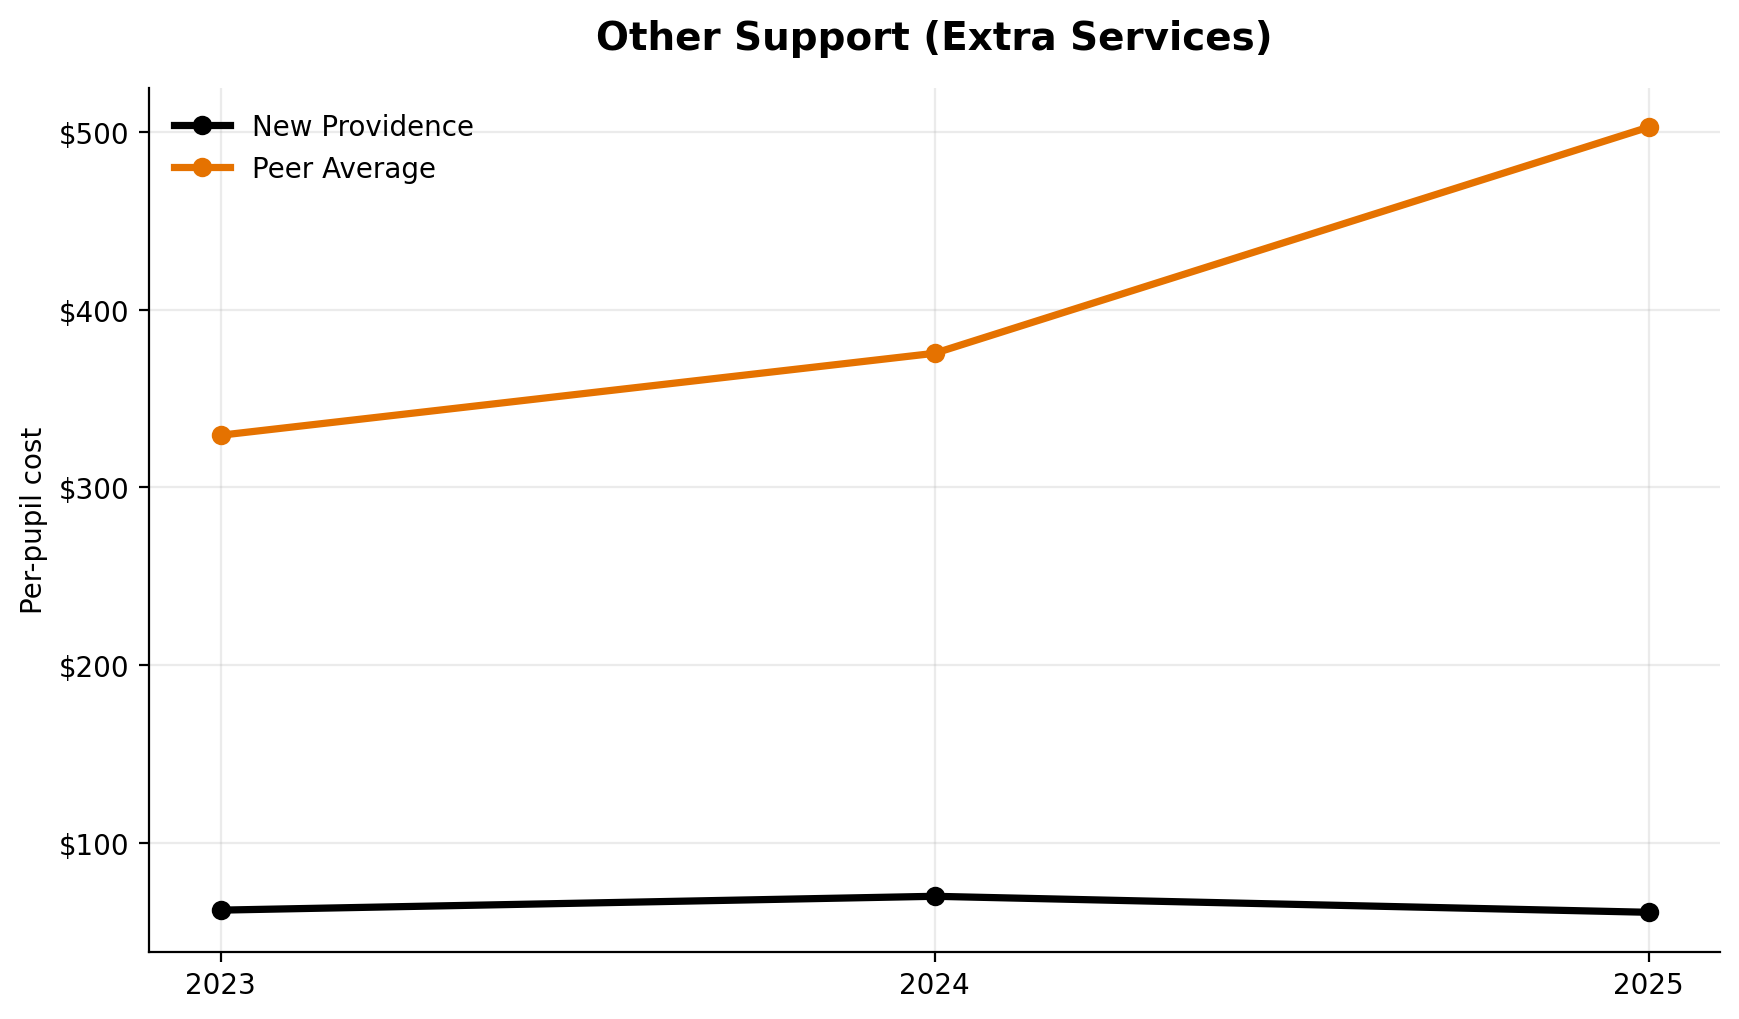
Other Support (Extra Services)
This category ranks 7th of 7.
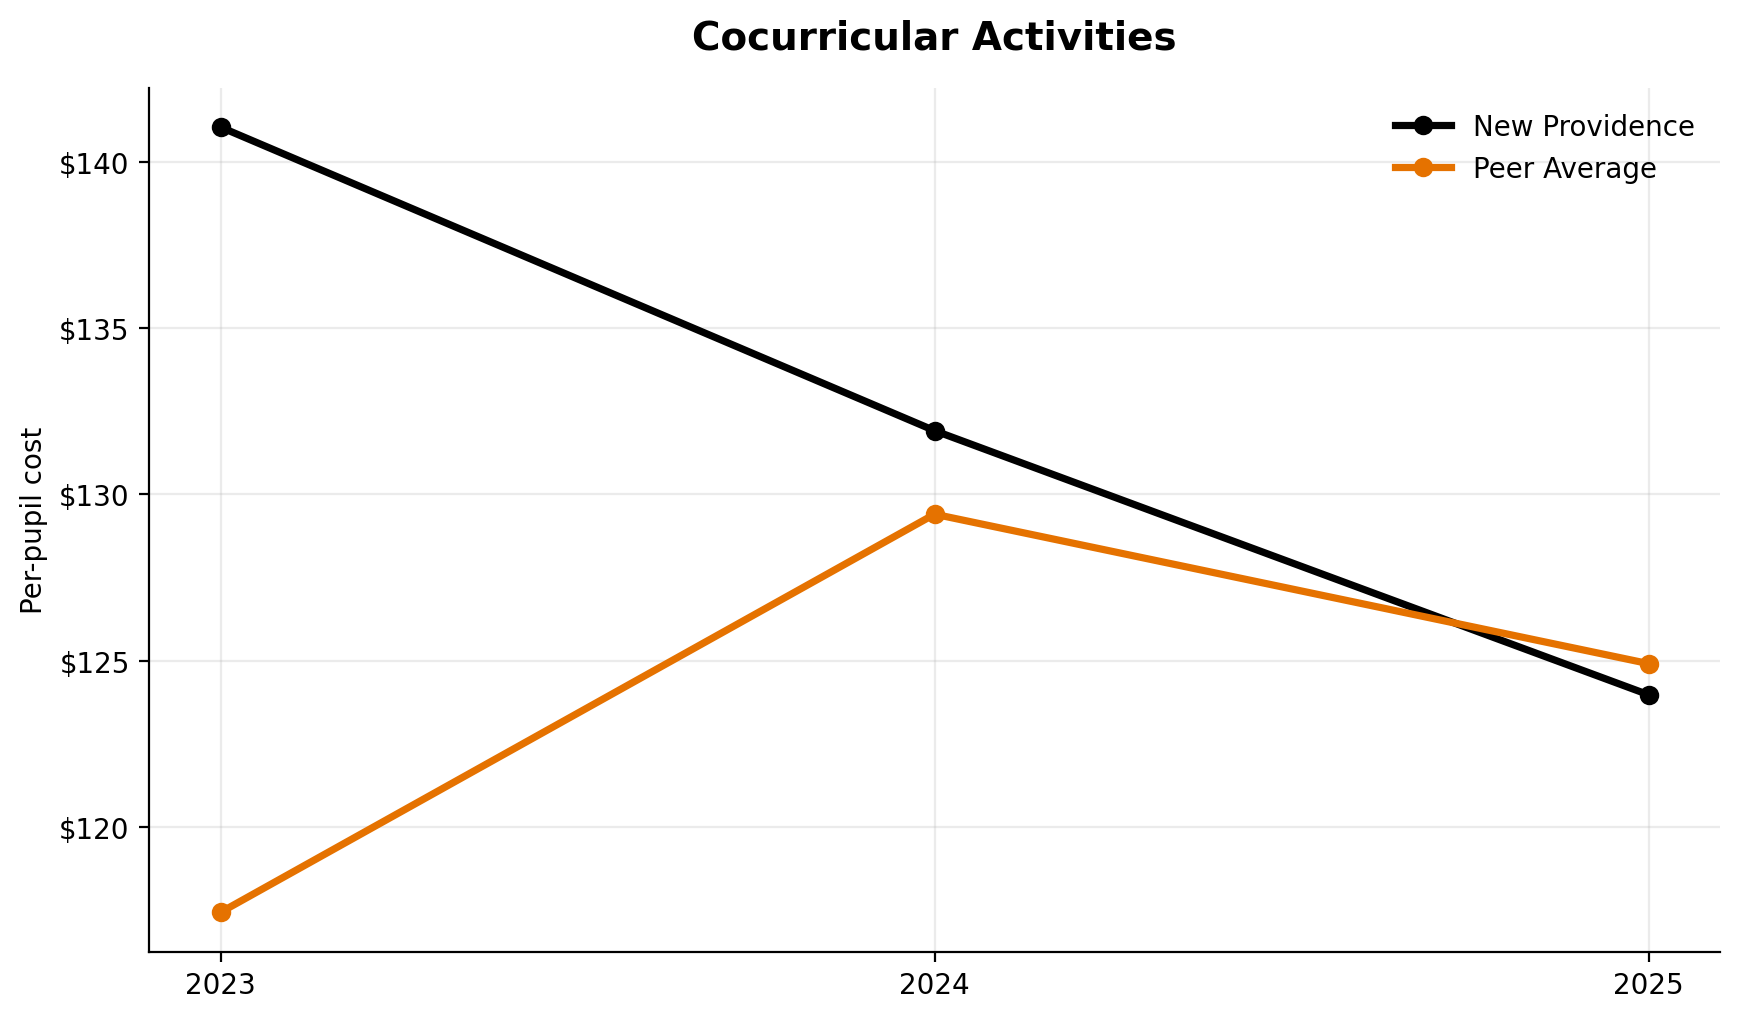
Cocurricular Activities
Cocurricular activities rank 3rd of 7.
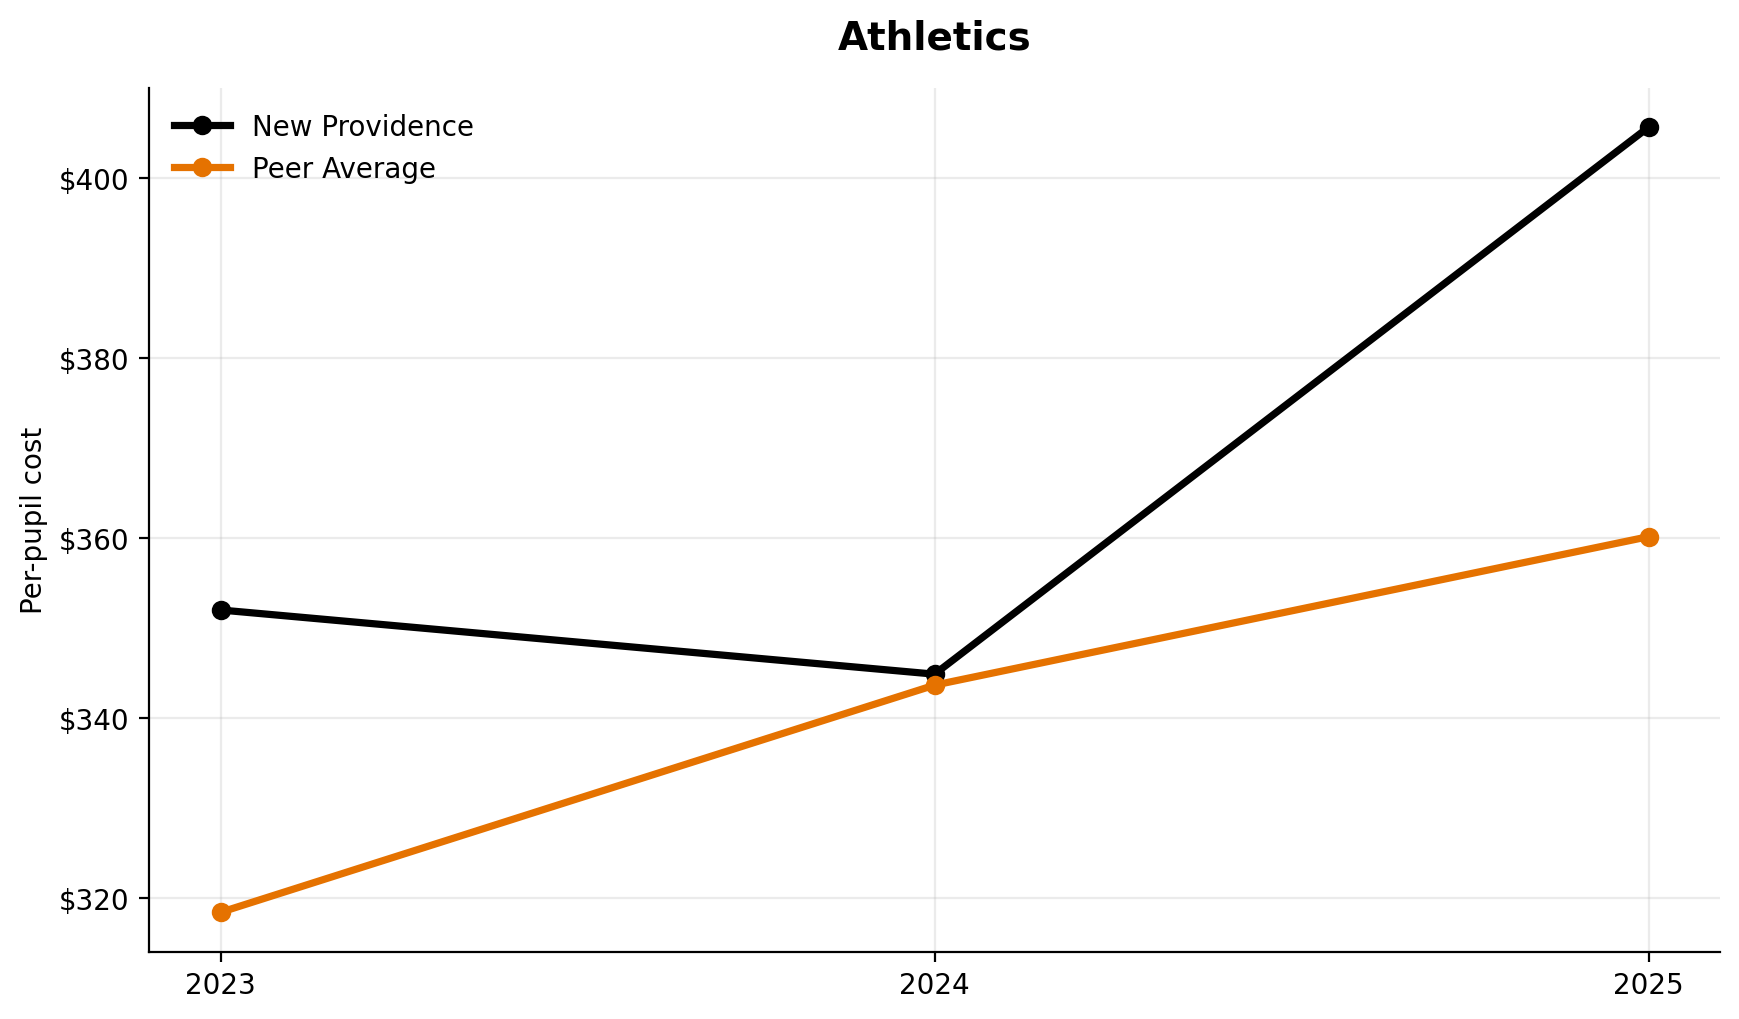
Athletics
Athletics ranks 2nd of 7 among peers.
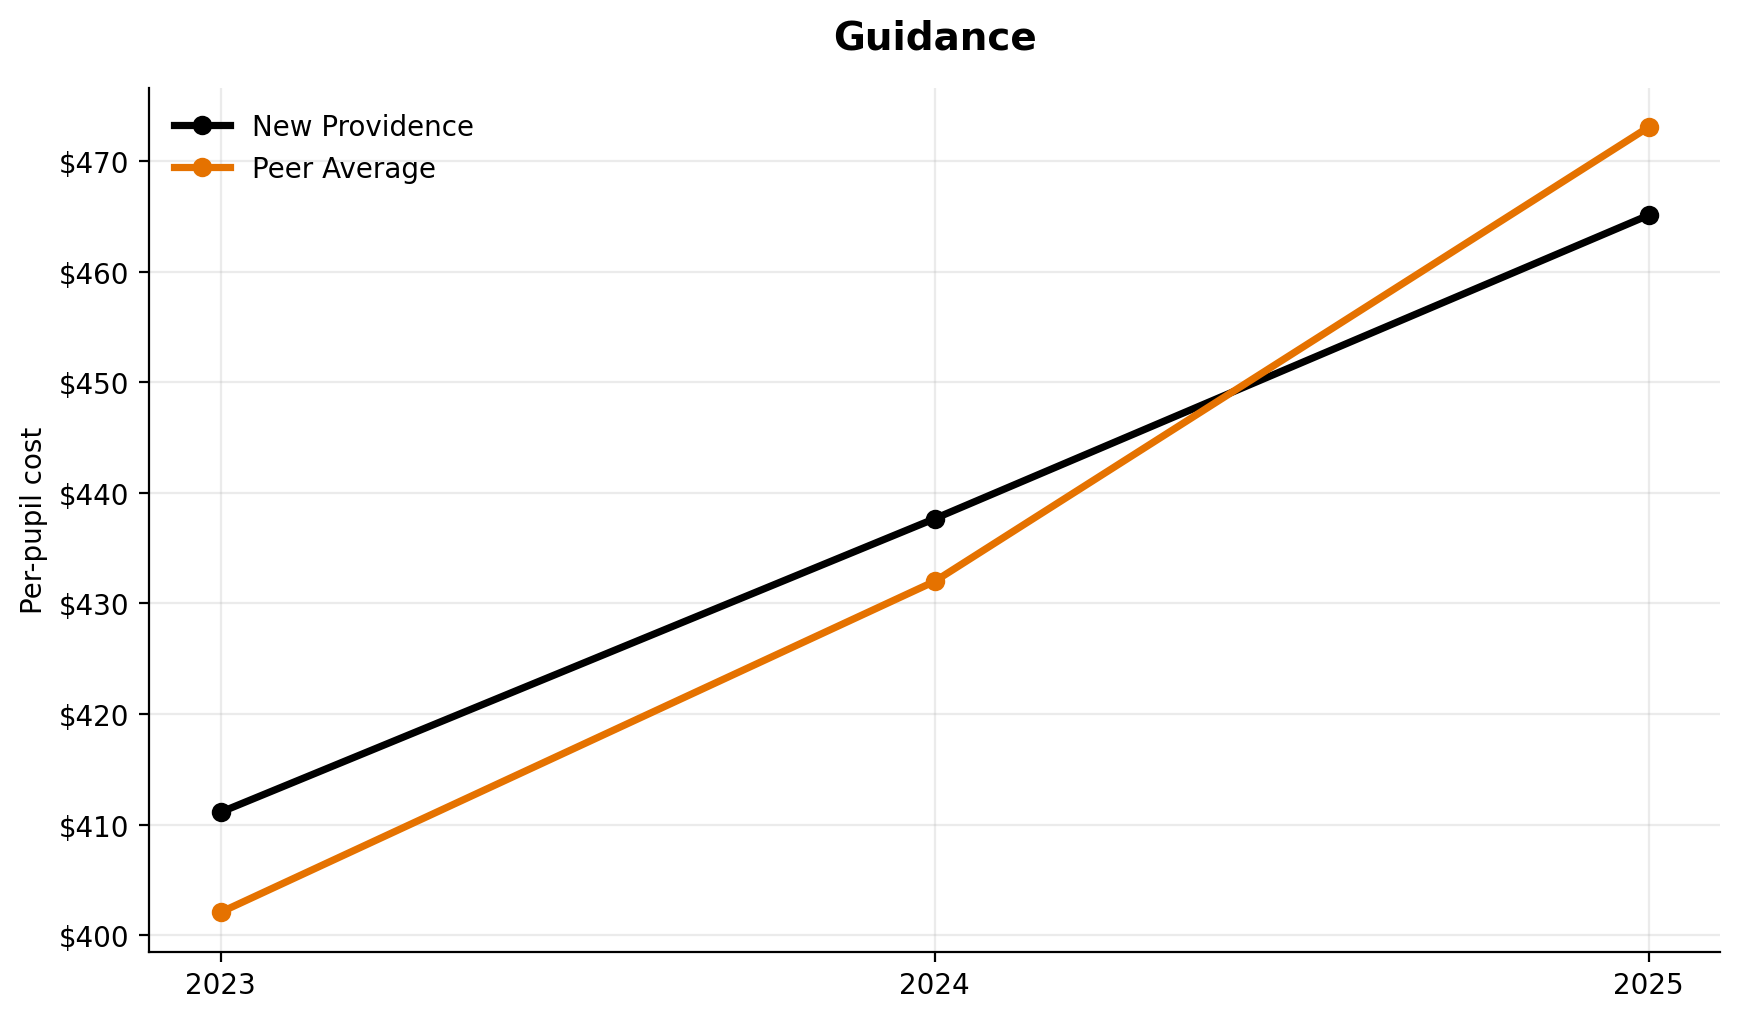
Guidance
Guidance spending ranks 4th of 7.
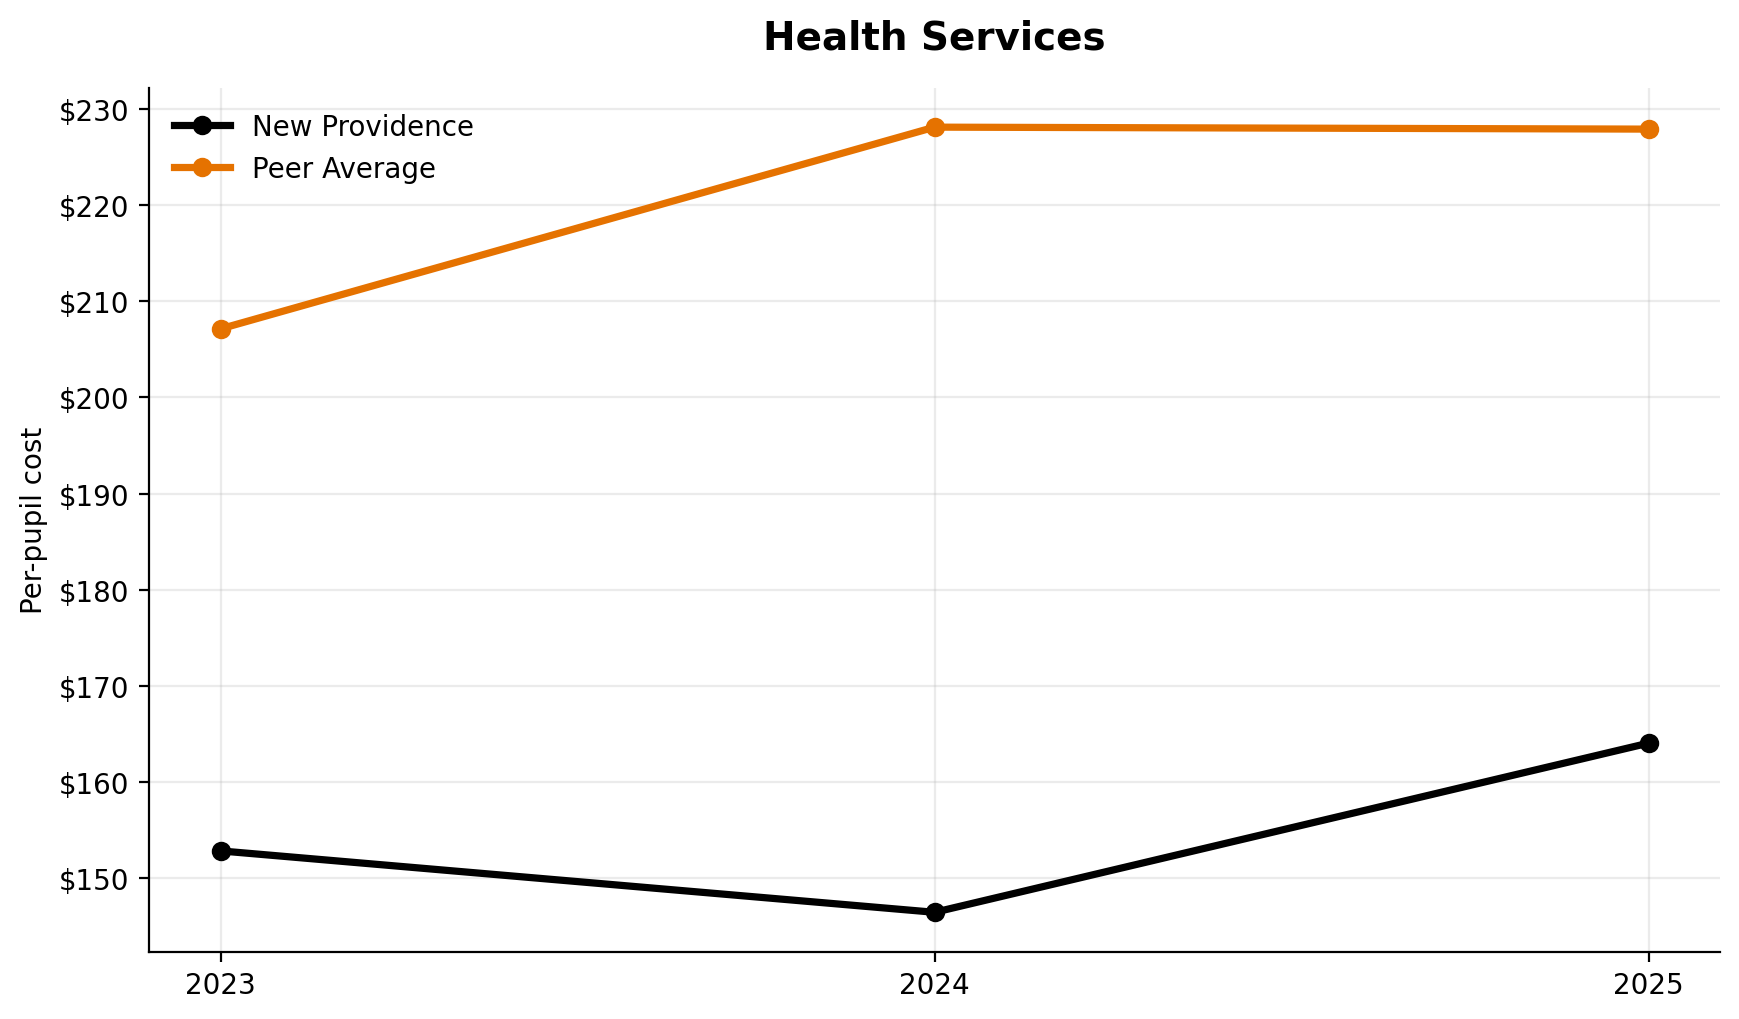
Health Services
Health services rank 7th of 7.
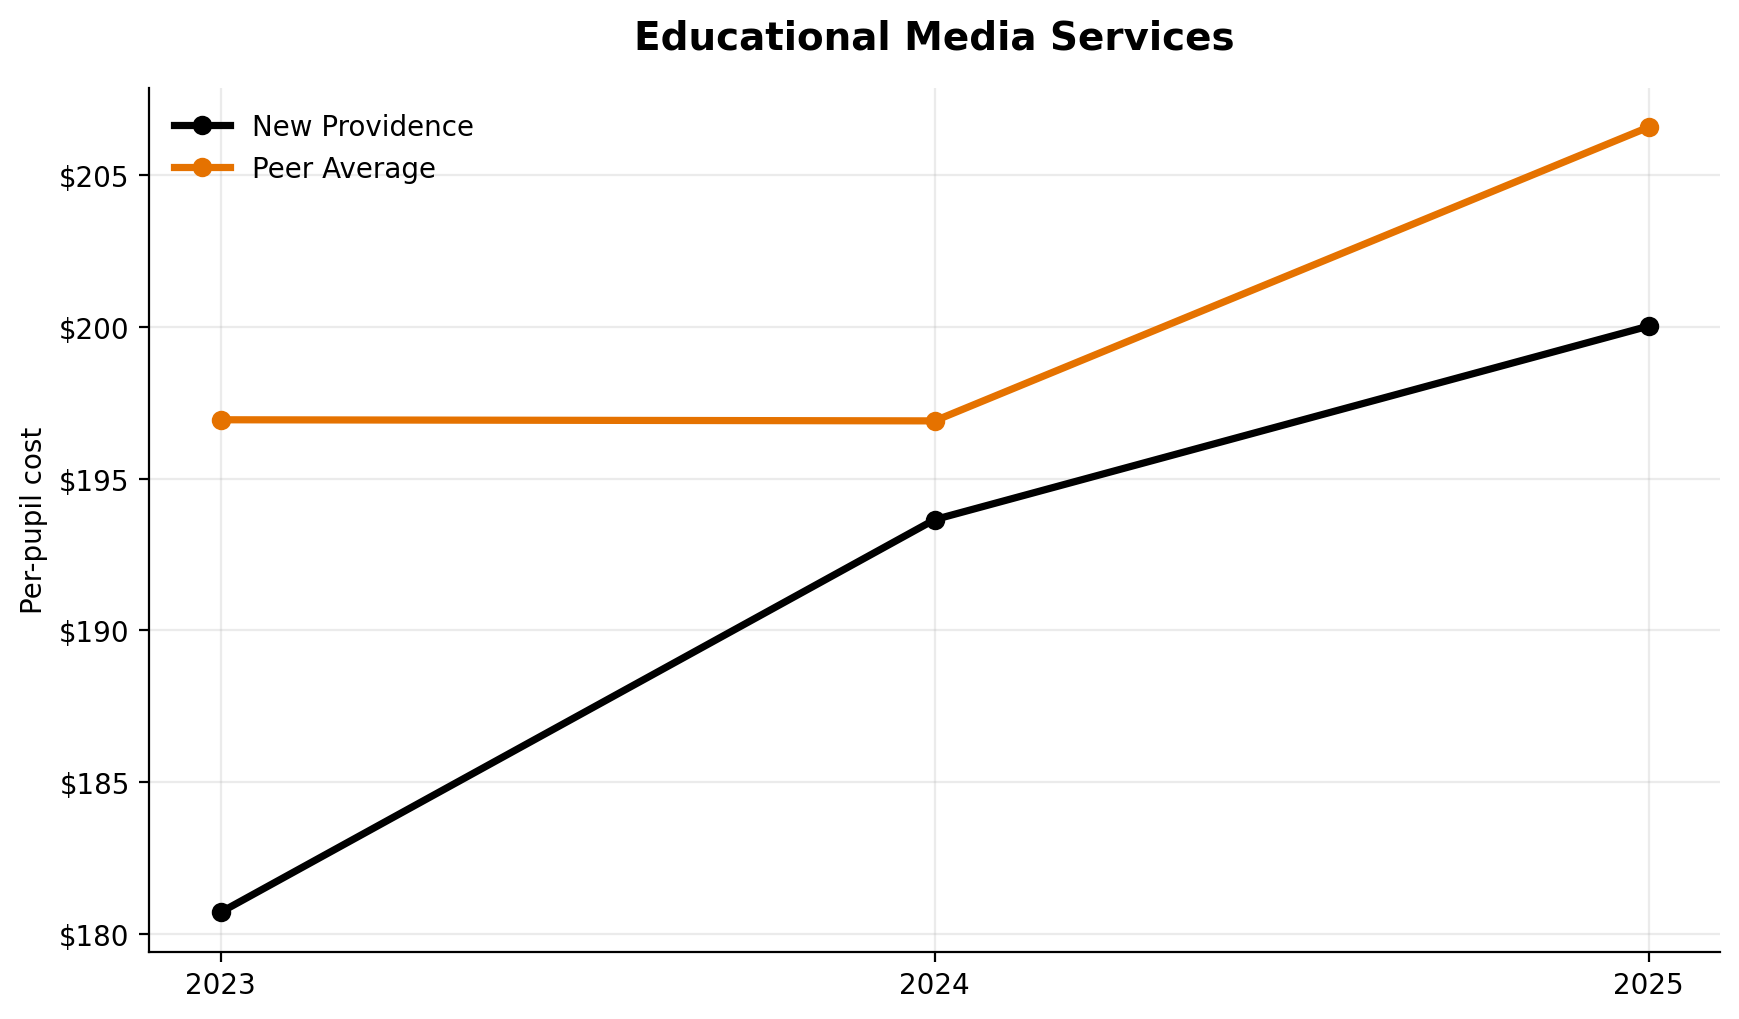
Educational Media Services
Library/media spending ranks 4th of 7.
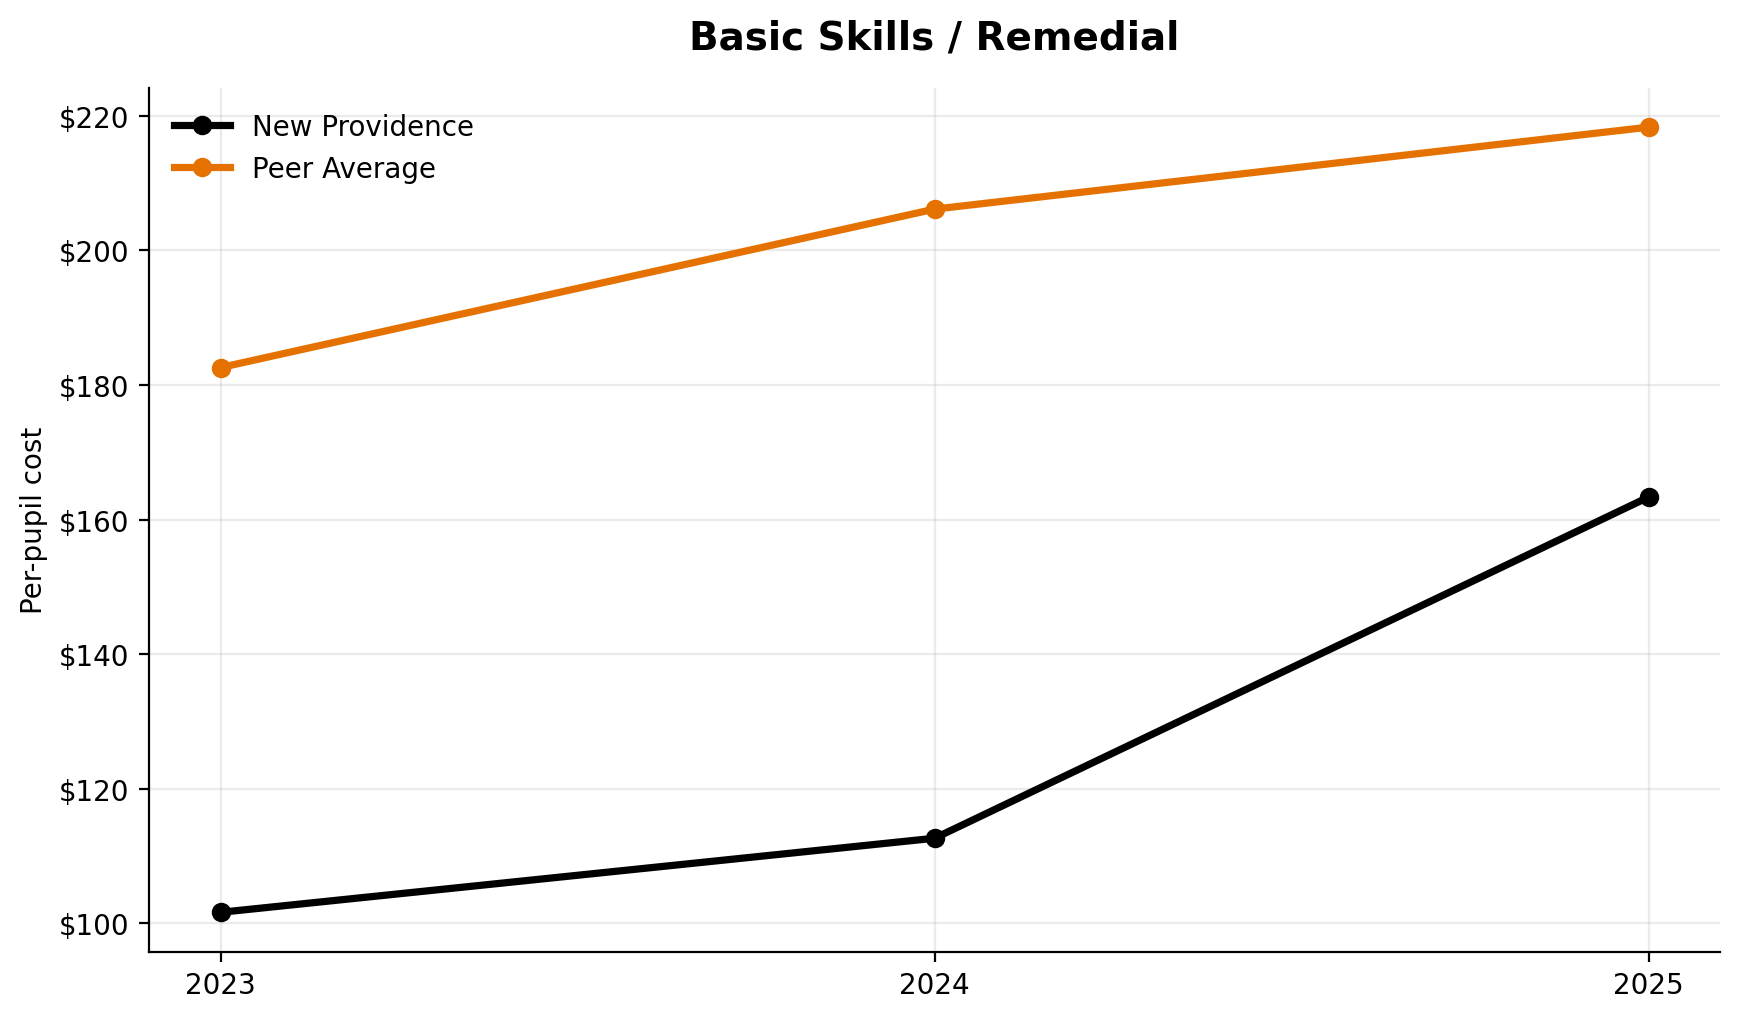
Basic Skills / Remedial
Basic skills/remedial ranks 6th of 7.
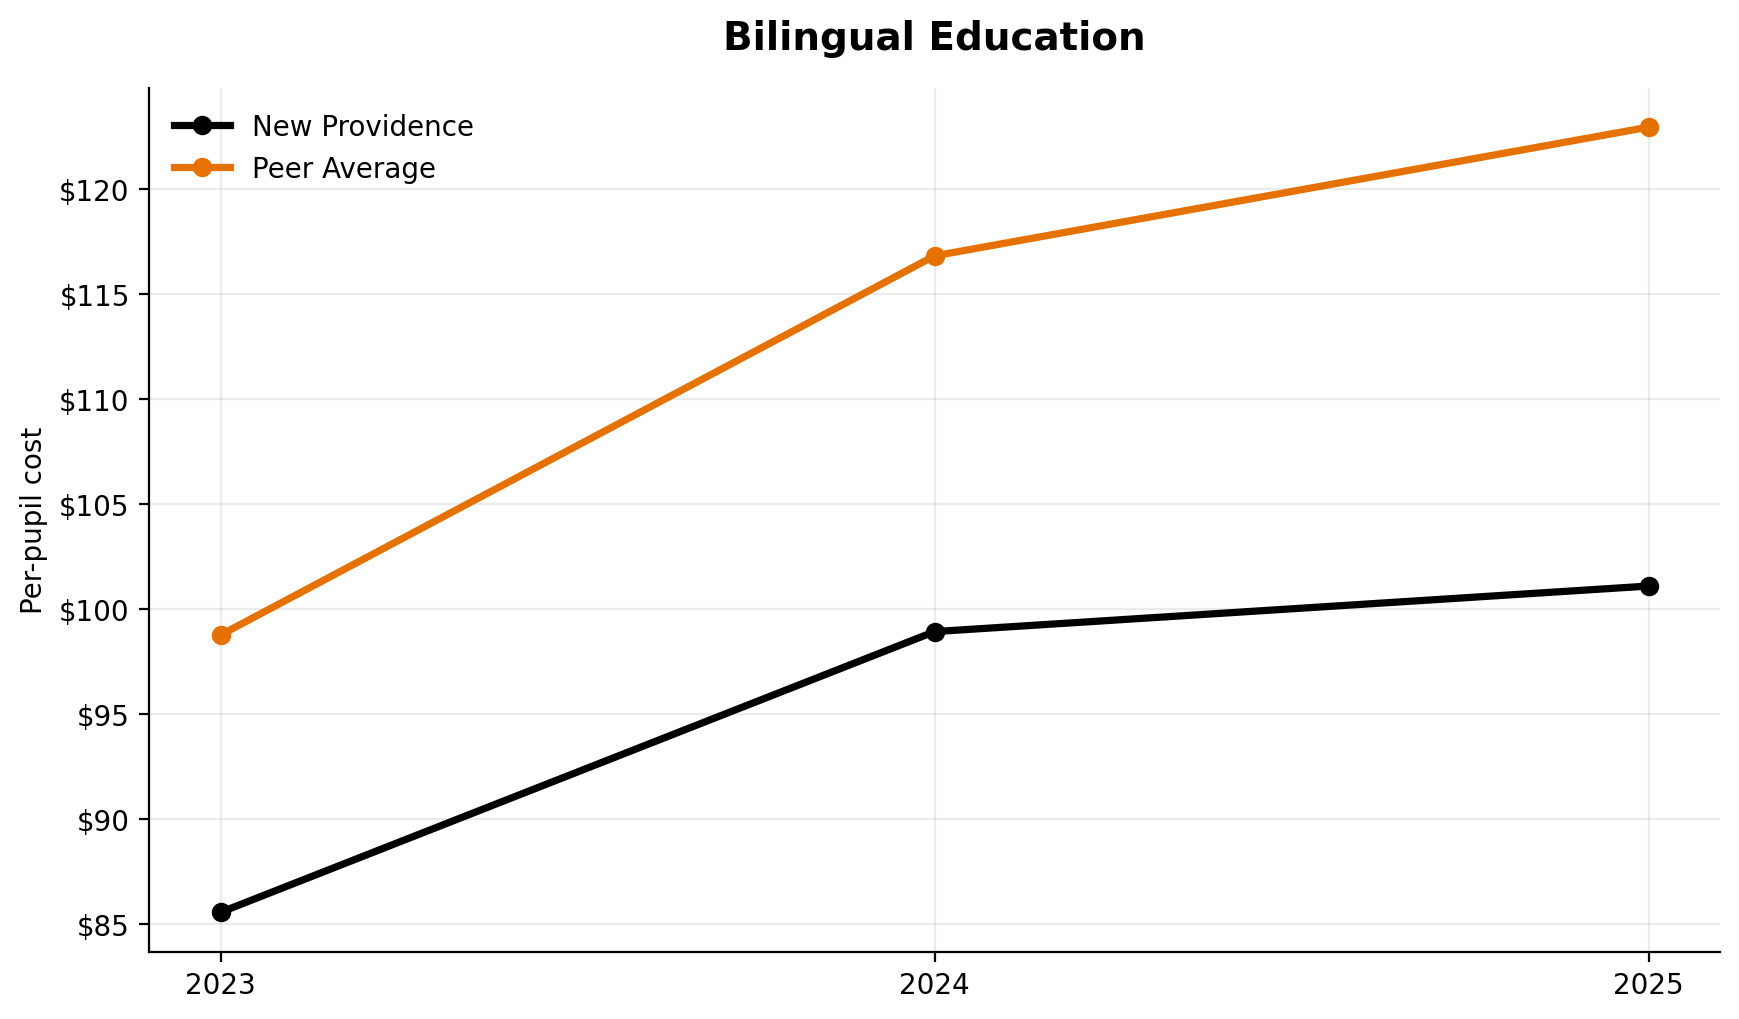
Bilingual Education
Bilingual education ranks 5th of 7.
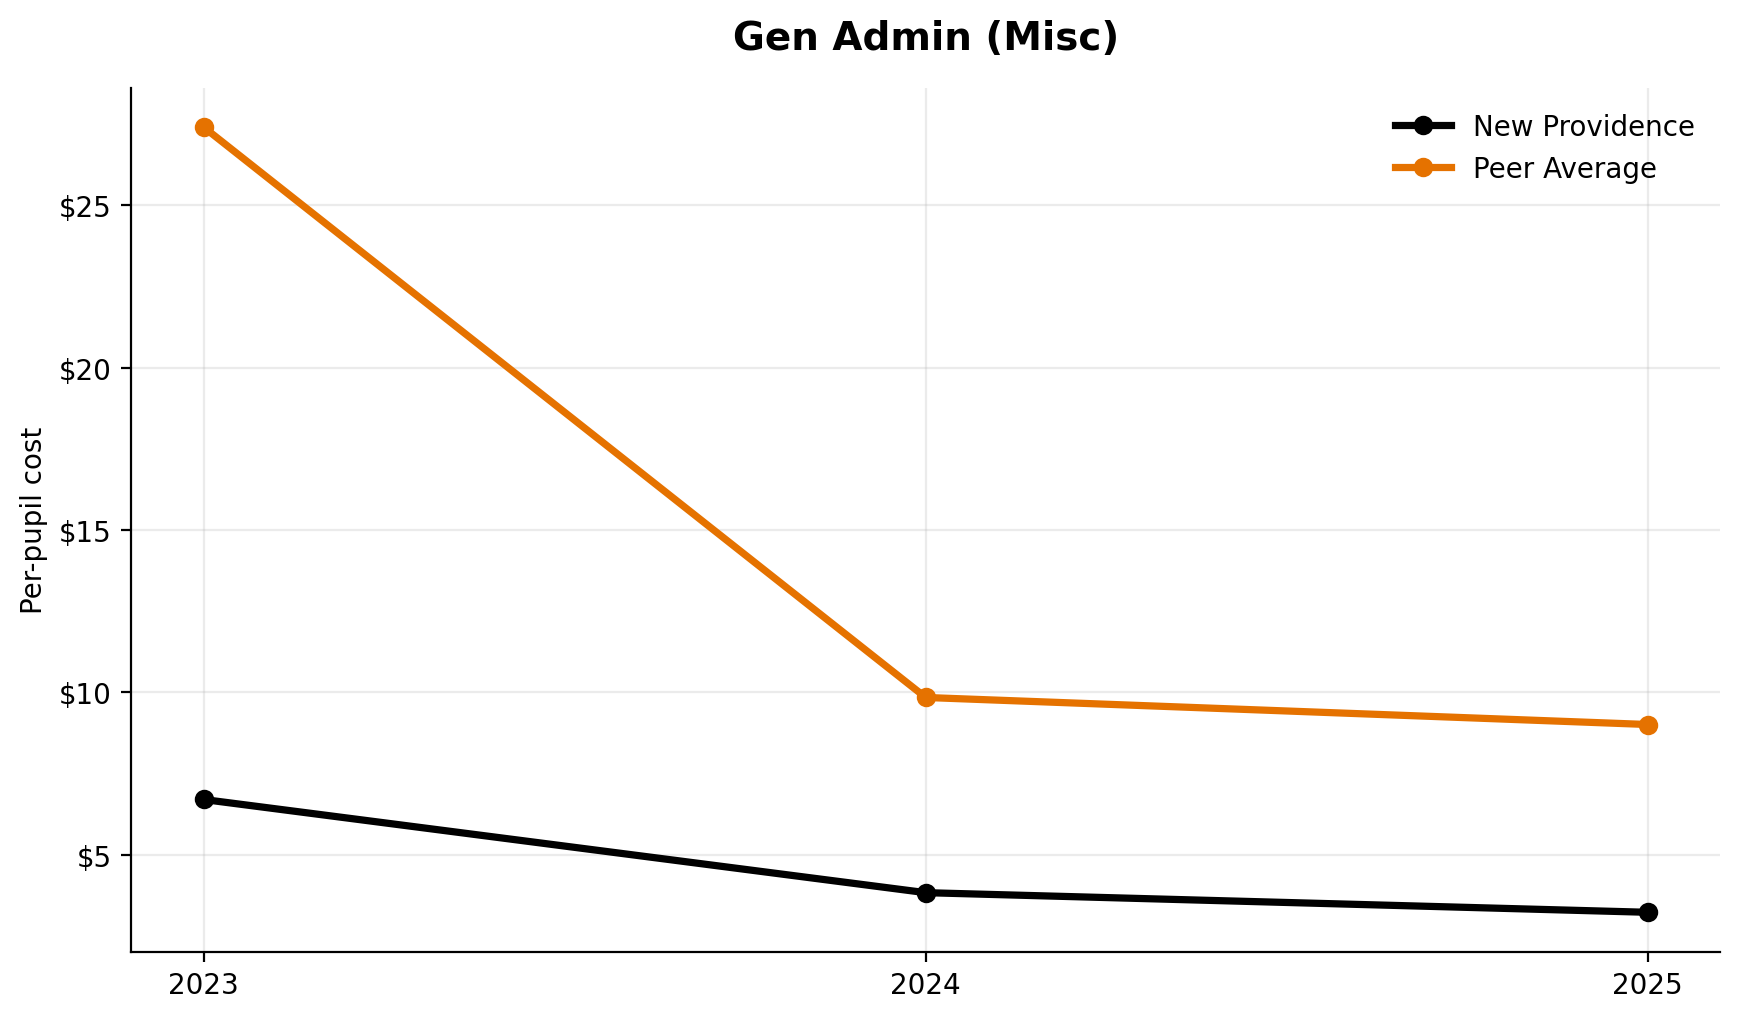
Gen Admin (Misc)
This line item ranks 3rd of 7.
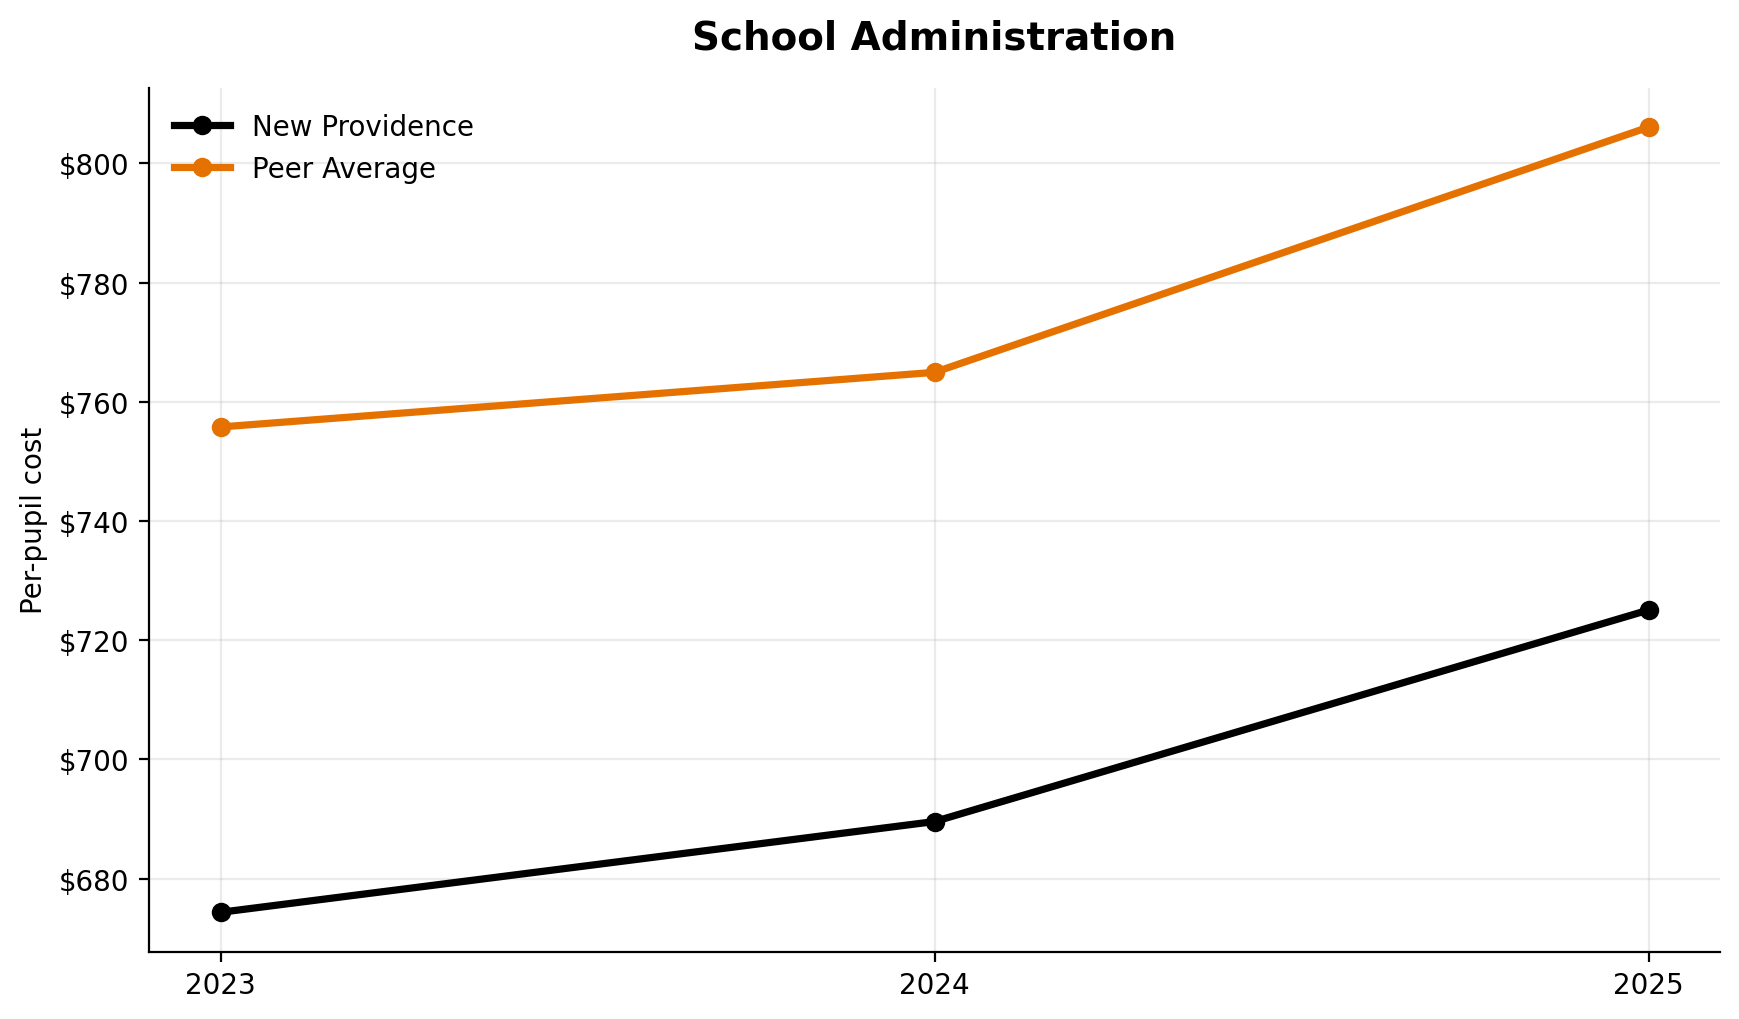
School Administration
School administration ranks 6th of 7.
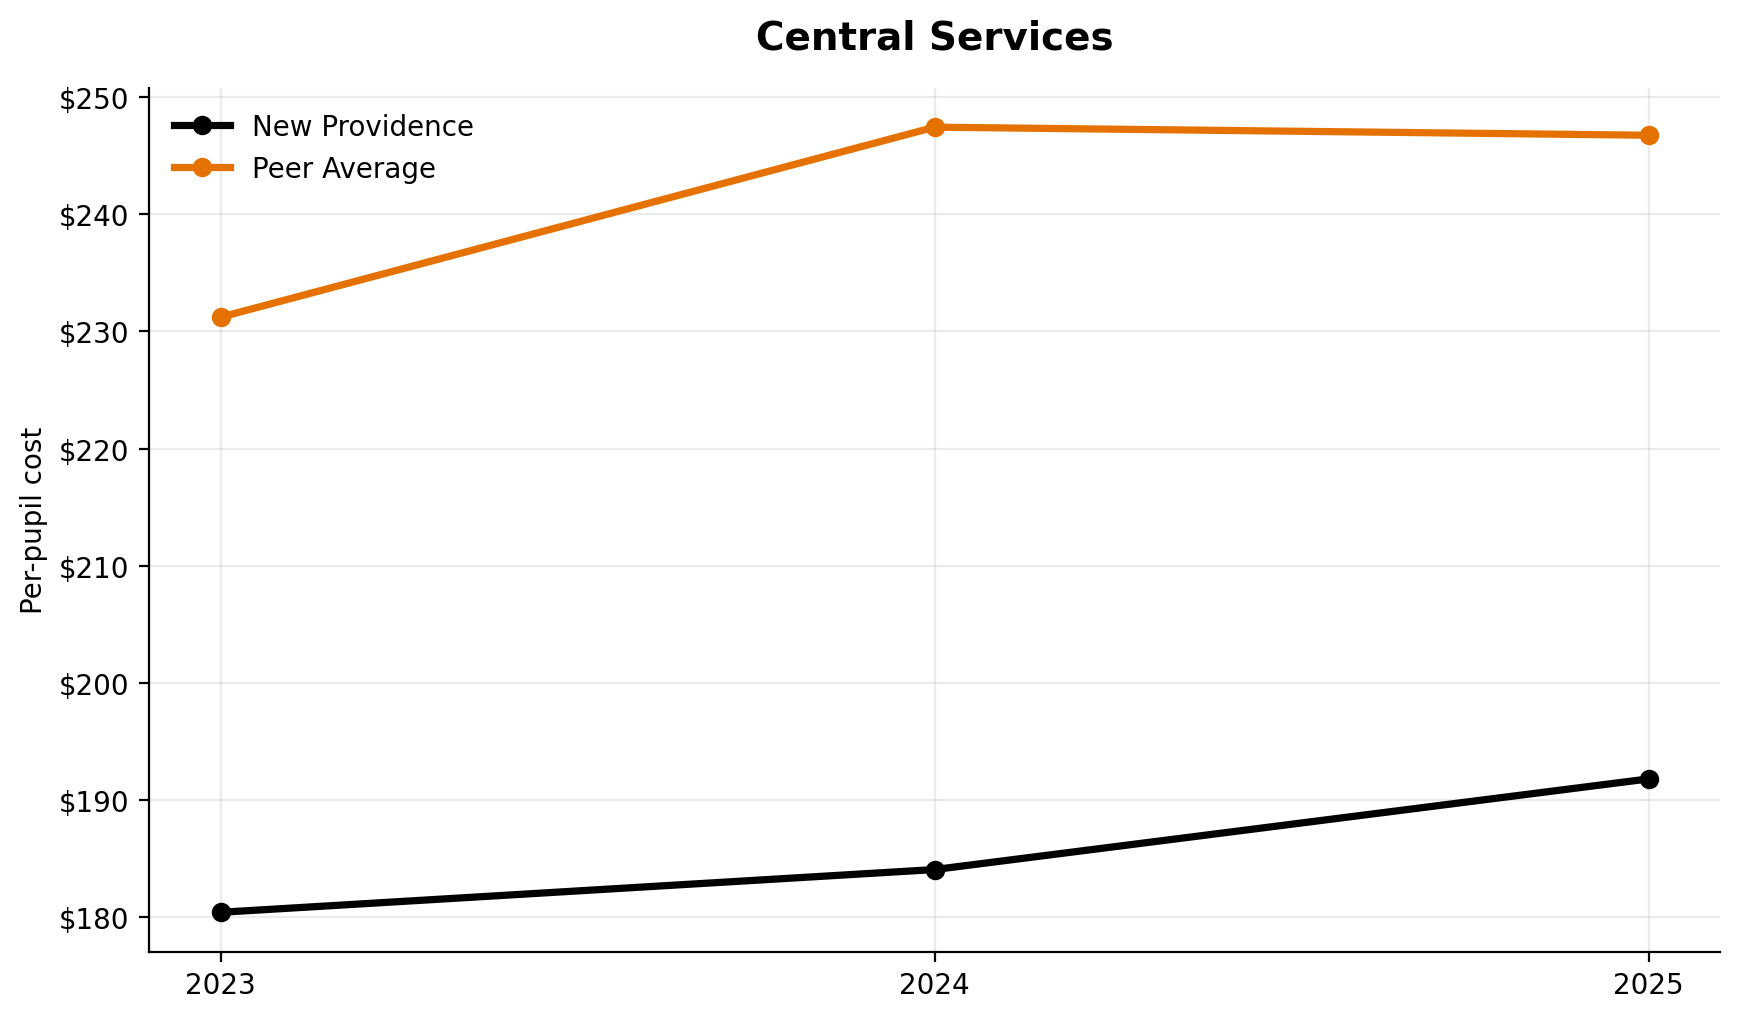
Central Services
Central services rank 7th of 7.
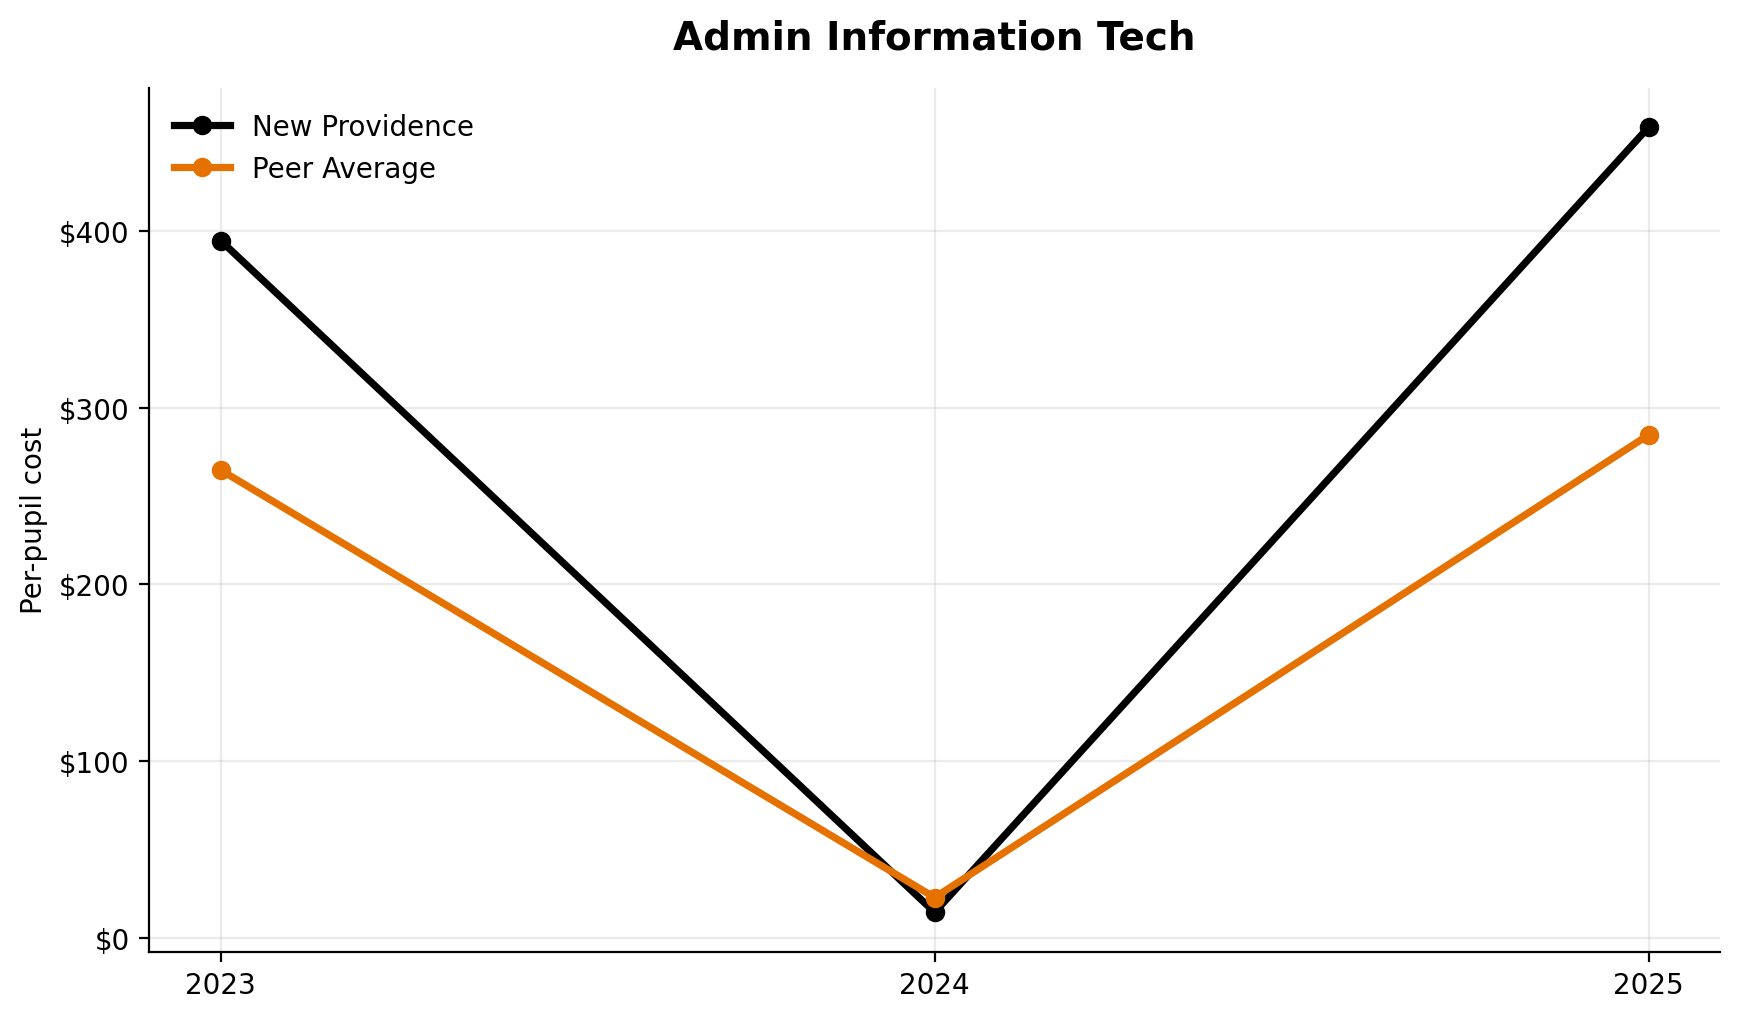
Admin Information Tech
Administrative information technology ranks 1st of 7.
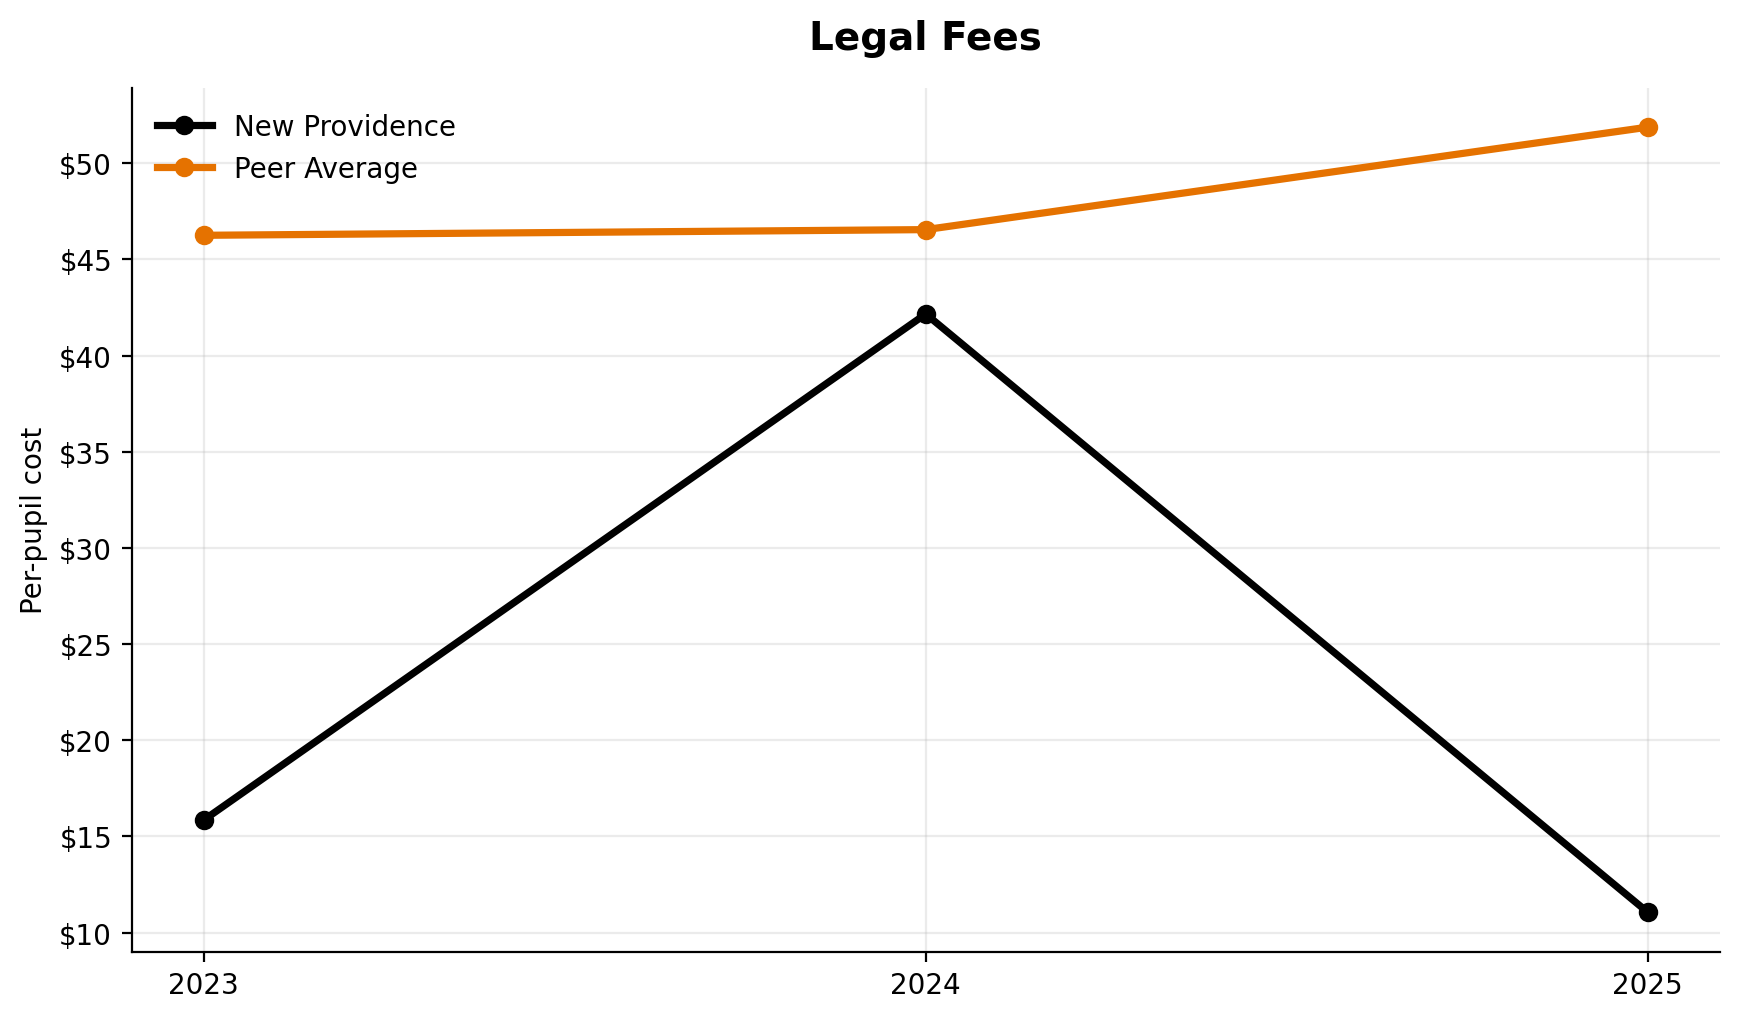
Legal Fees
Legal fees rank 7th of 7.
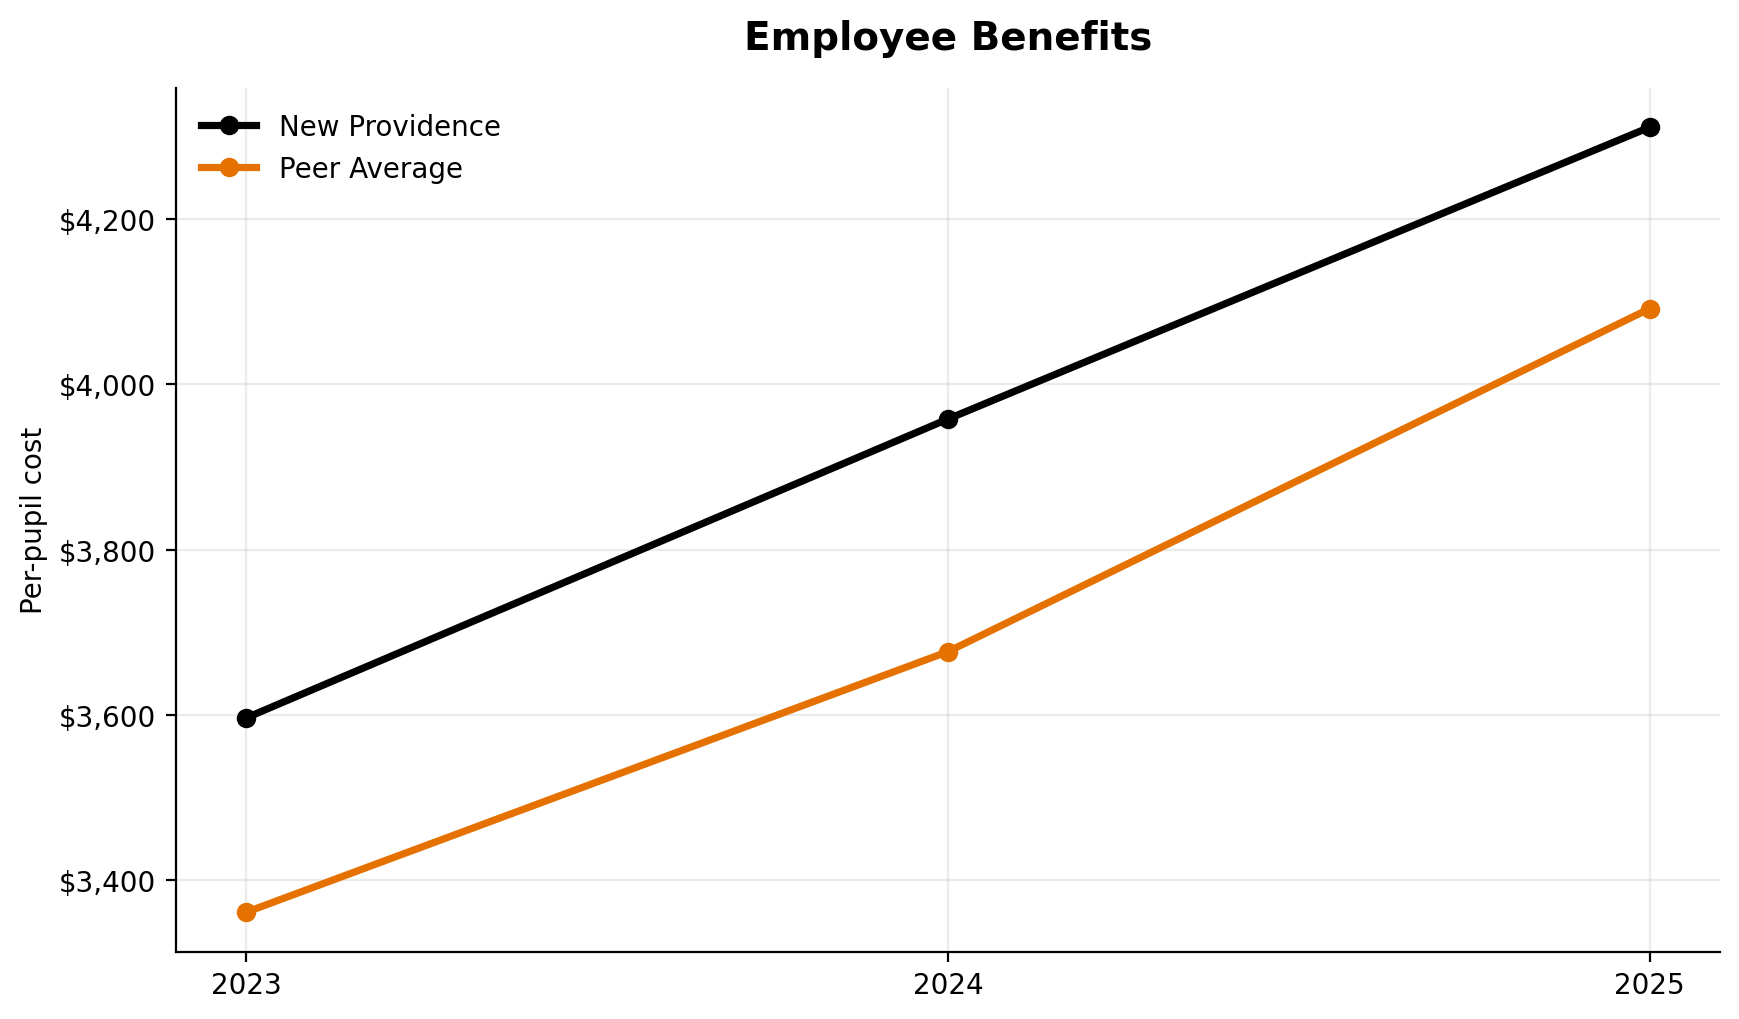
Employee Benefits
Employee benefits rank 3rd of 7.
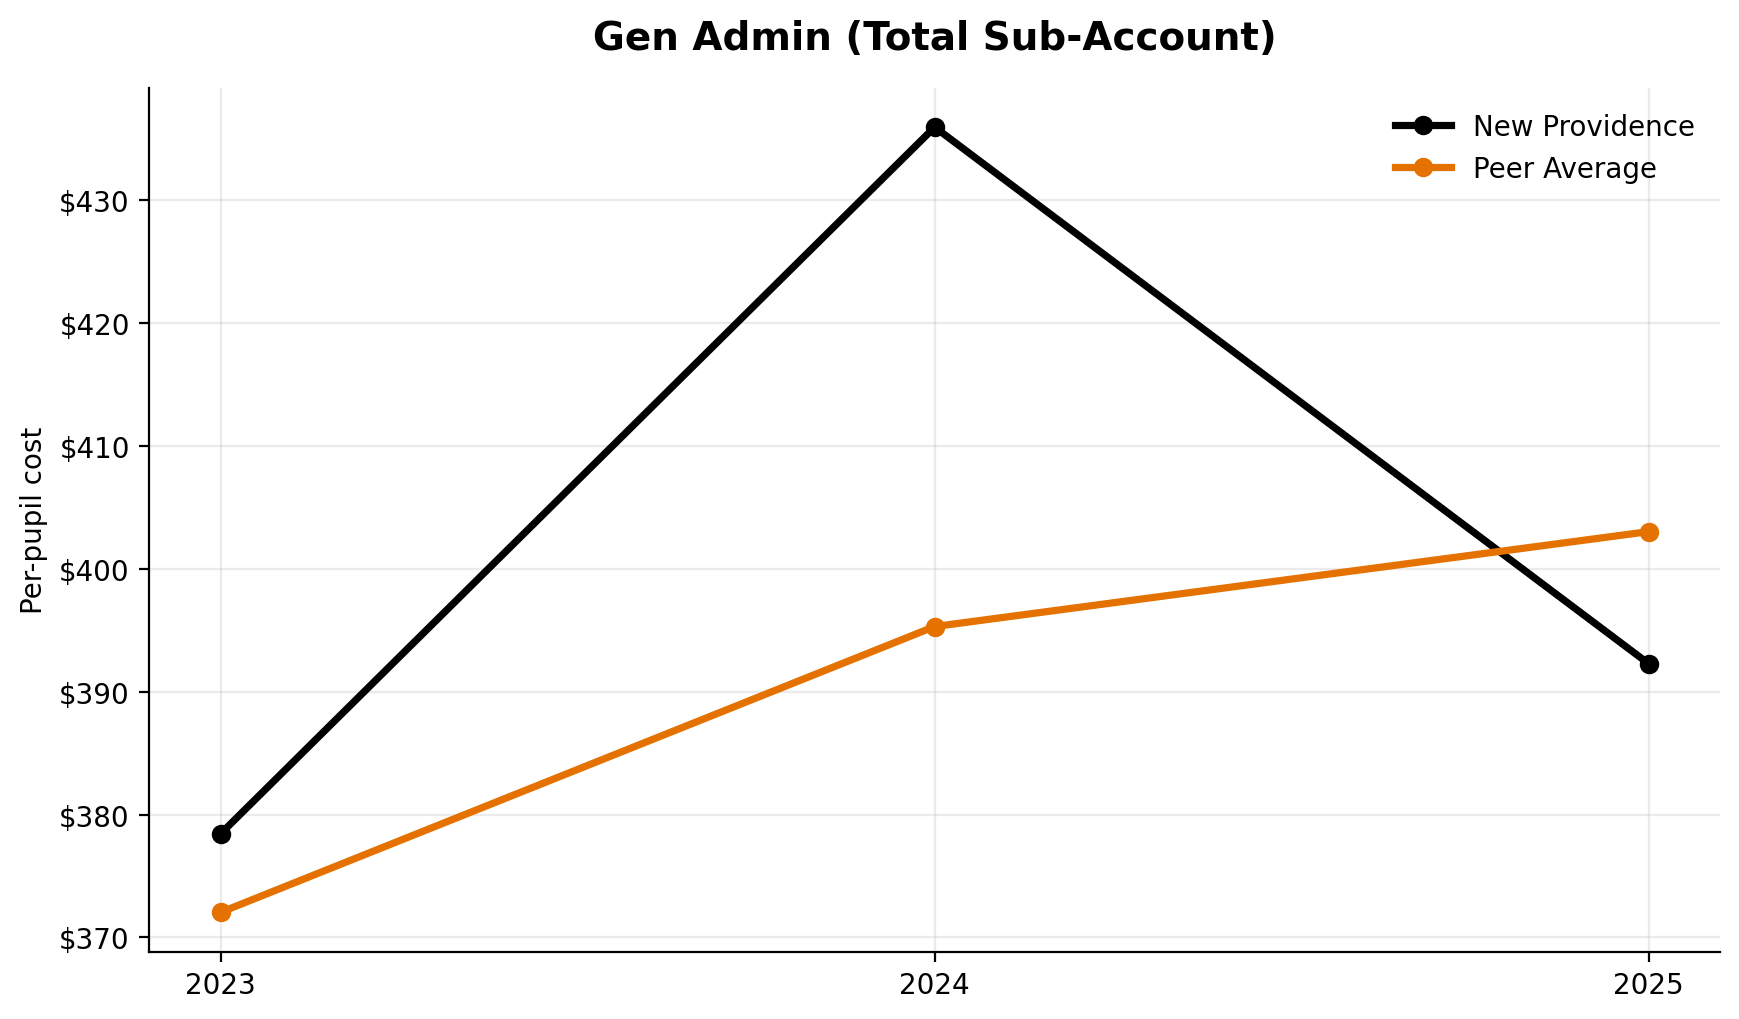
Gen Admin (Total Sub-Account)
This broader admin bucket ranks 3rd of 7.
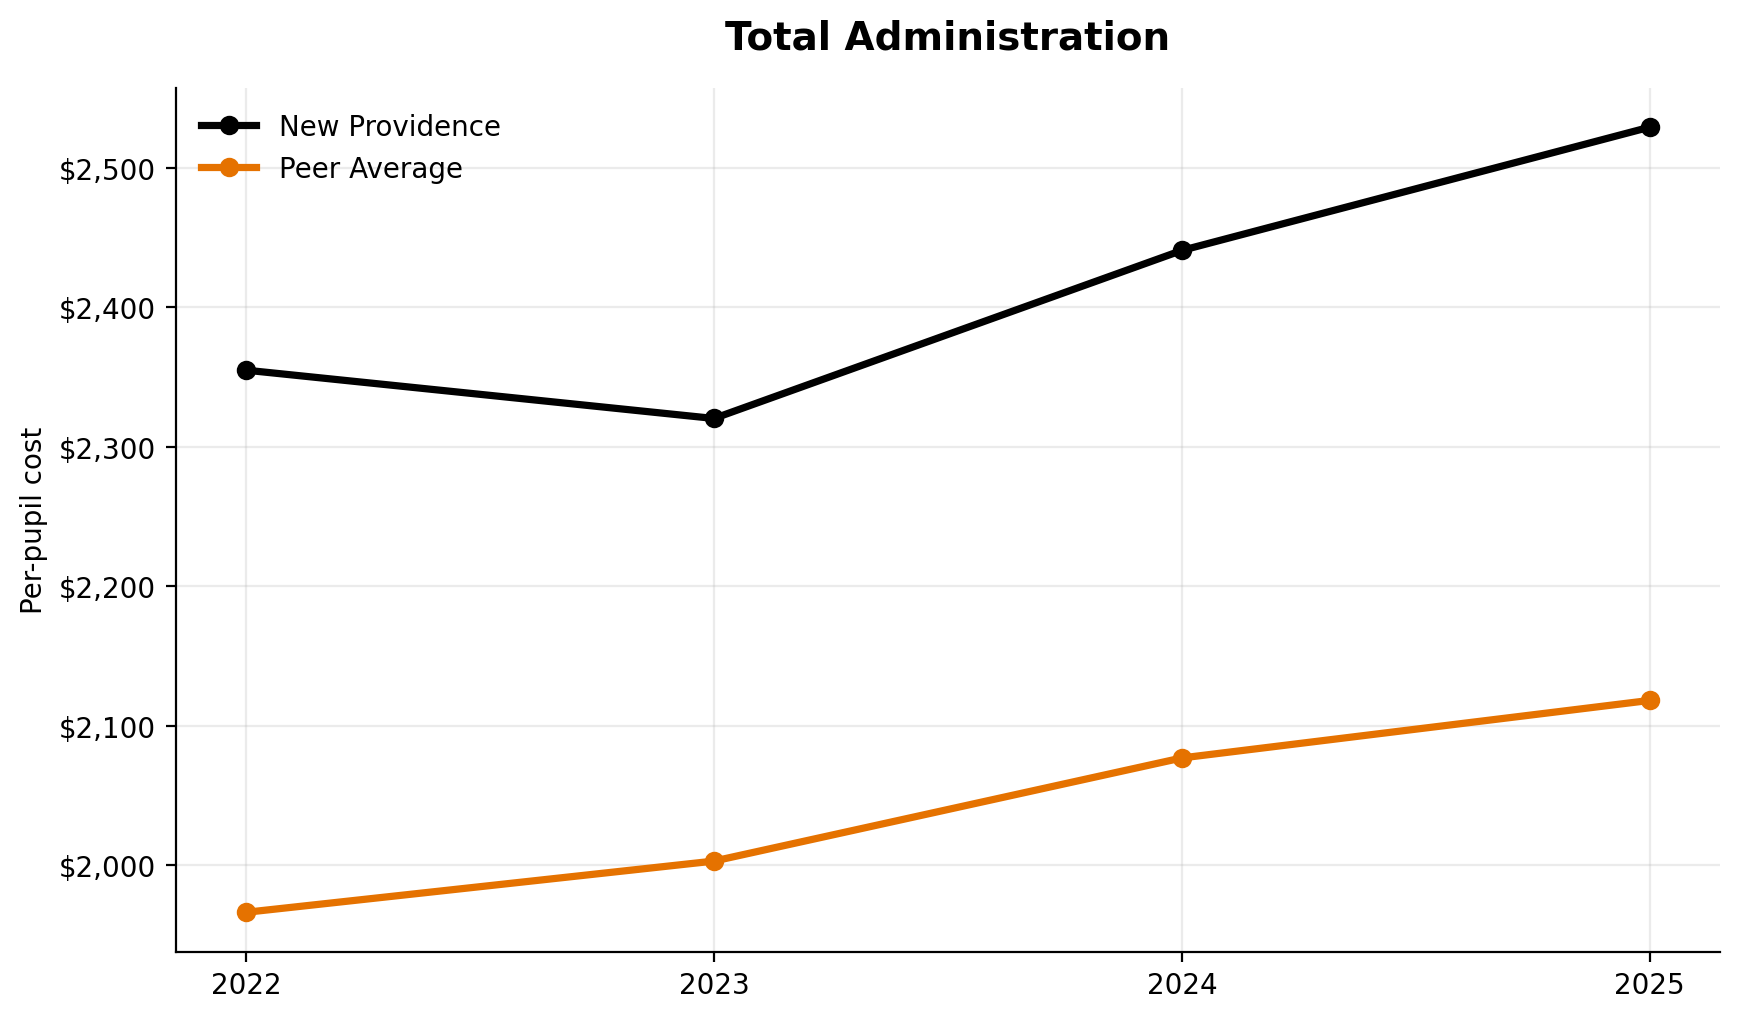
Total Administration
Total administration ranks 1st of 7 overall.
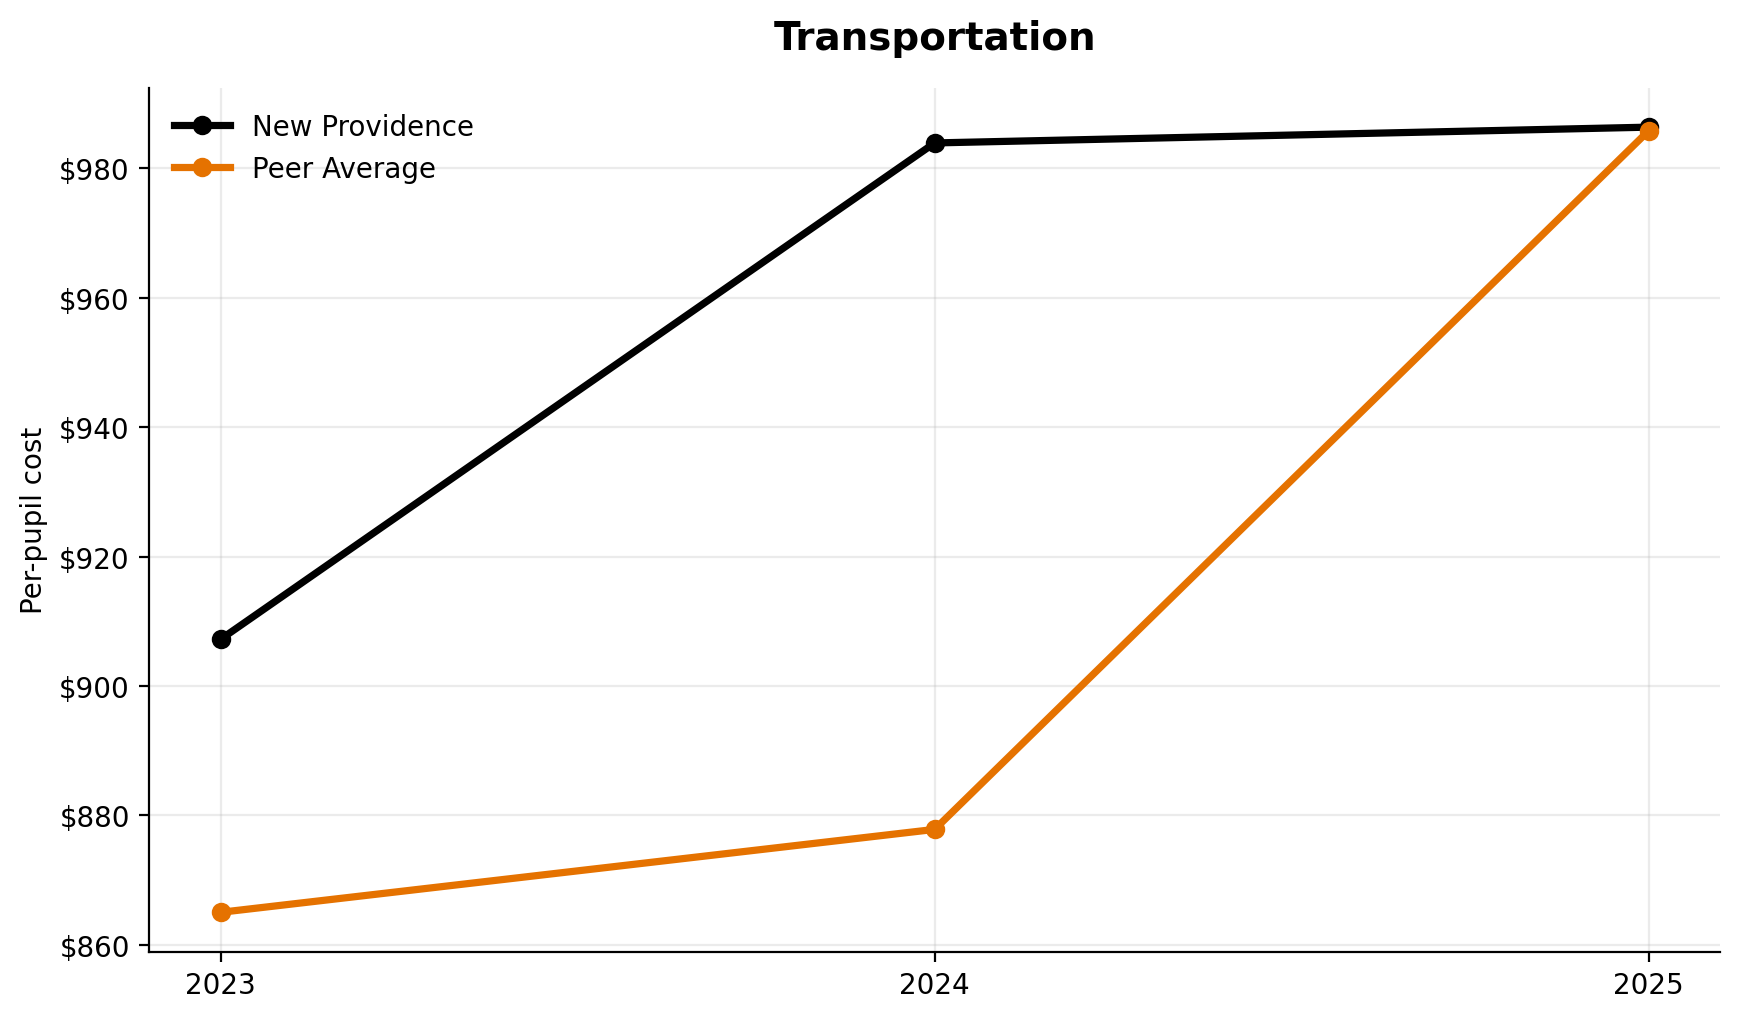
Transportation
Transportation ranks 6th of 7.
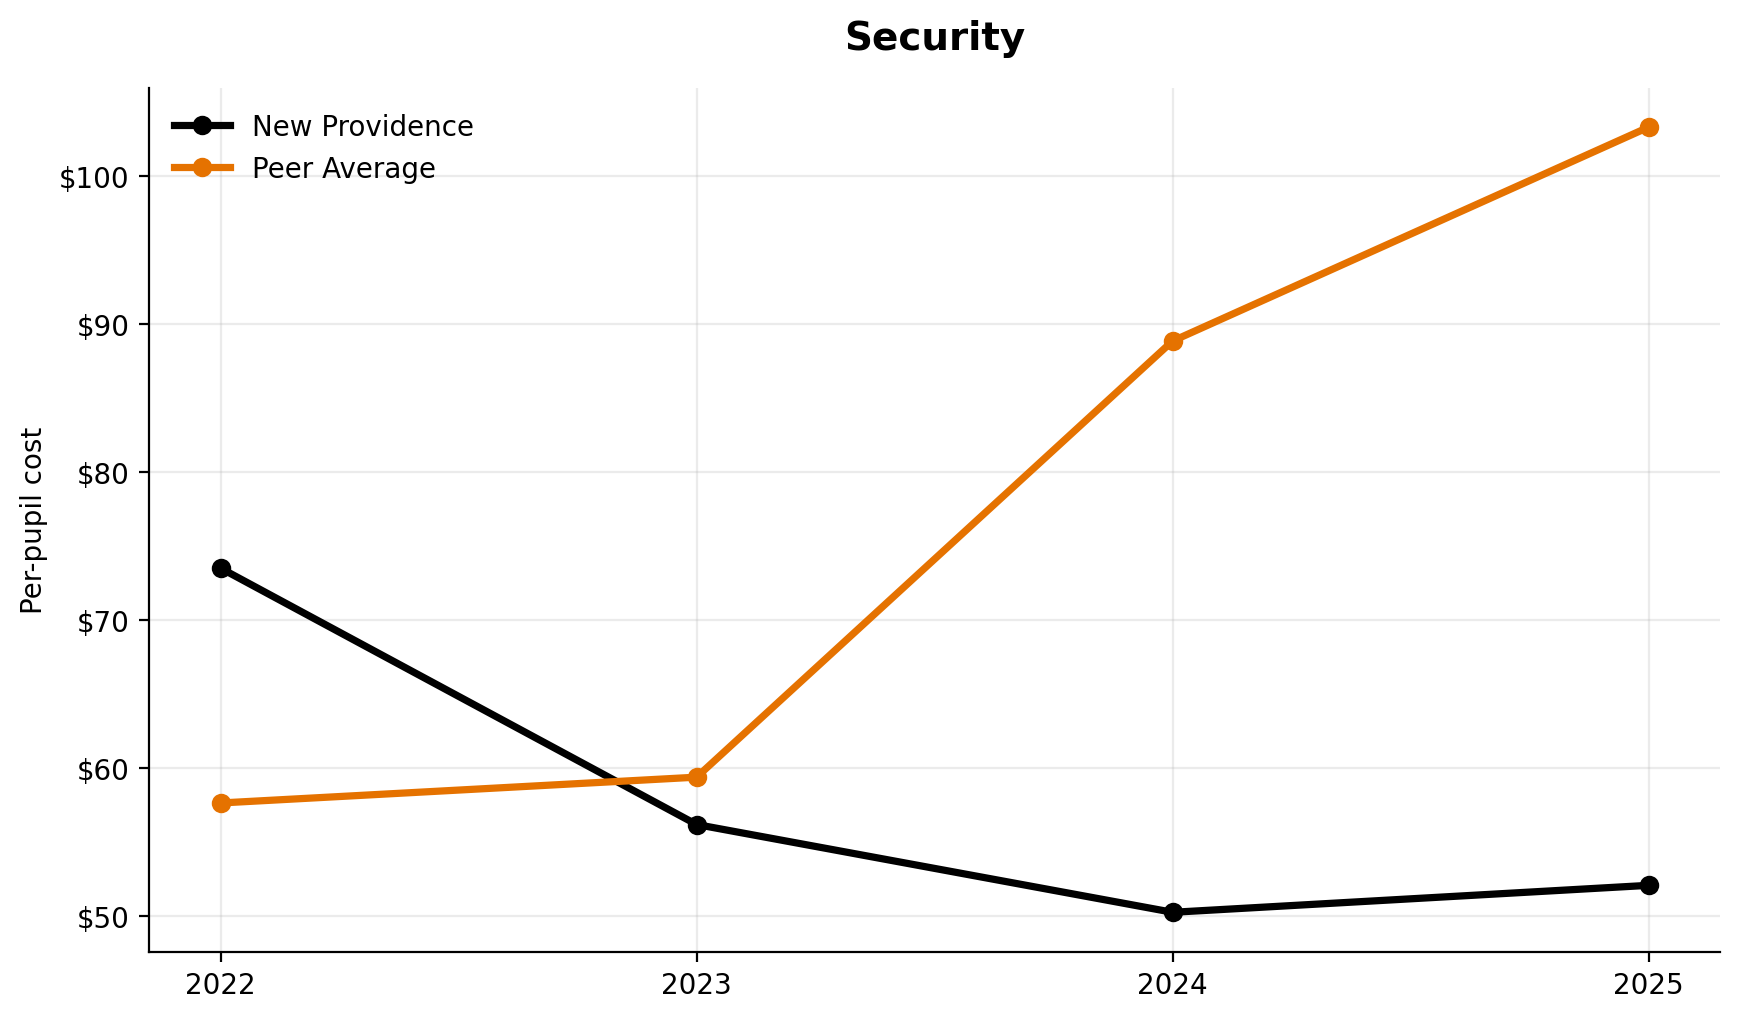
Security
Security ranks 6th of 7 and uses a 2022-2025 per-pupil trend.
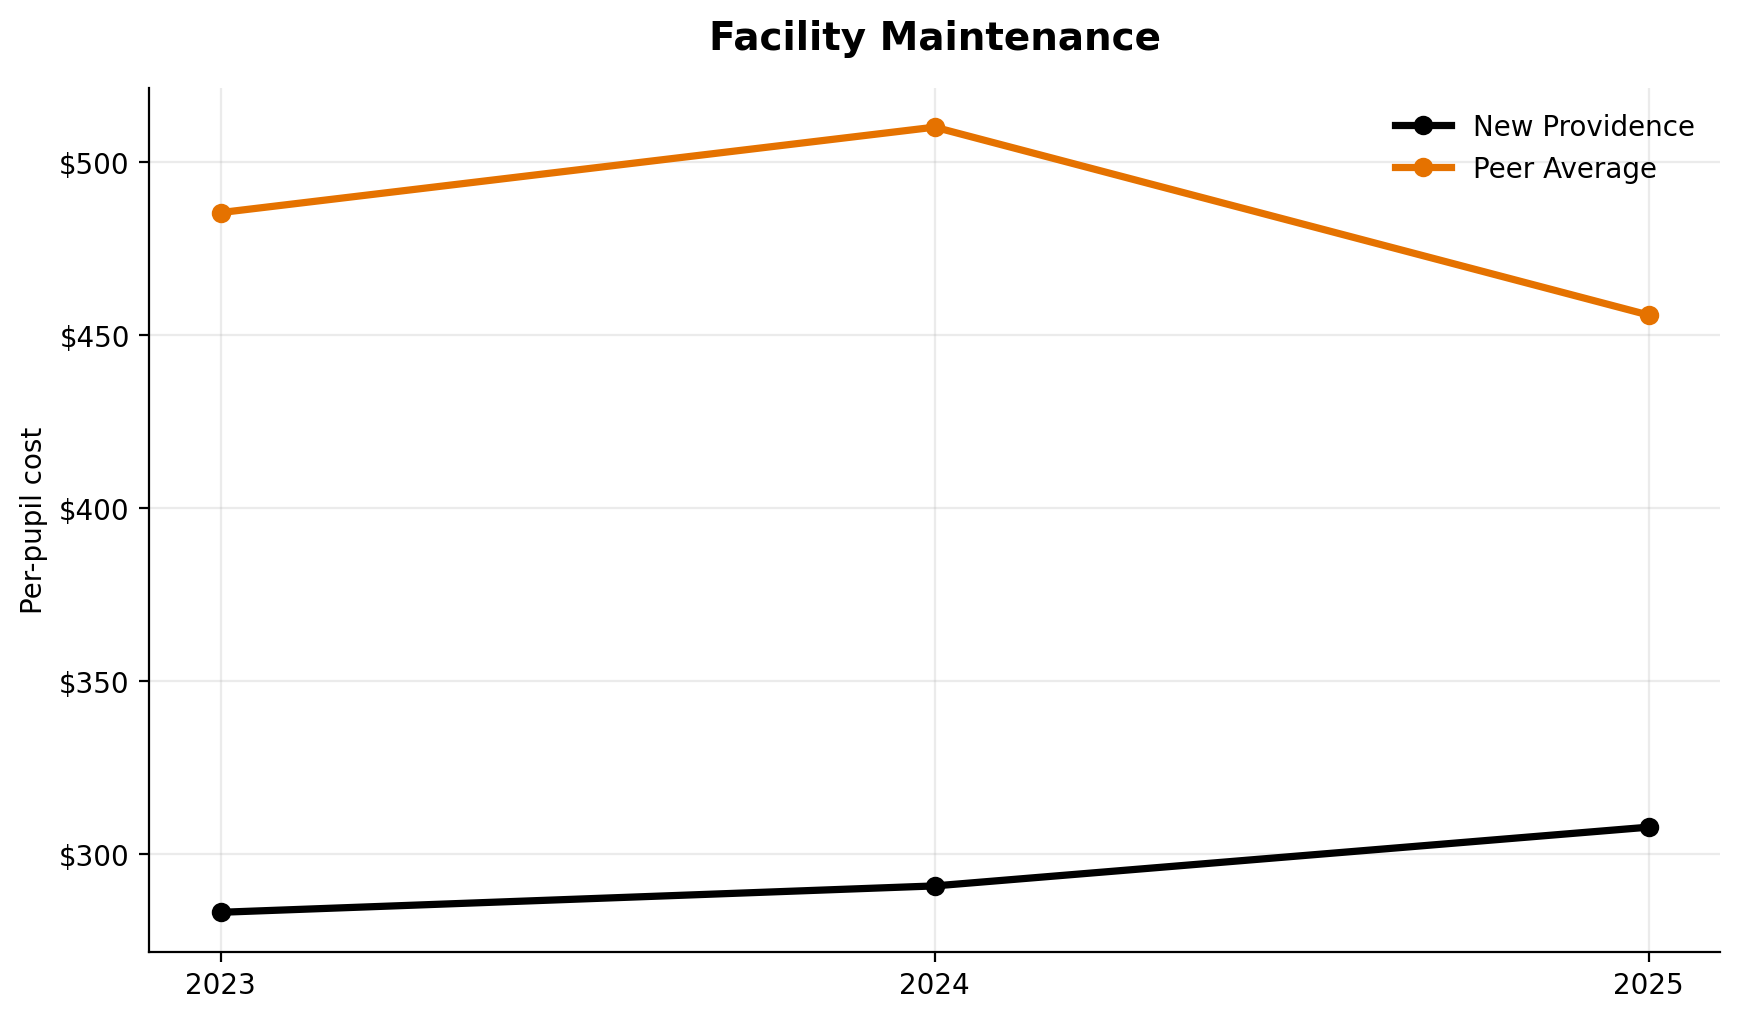
Facility Maintenance
Facility maintenance ranks 6th of 7.
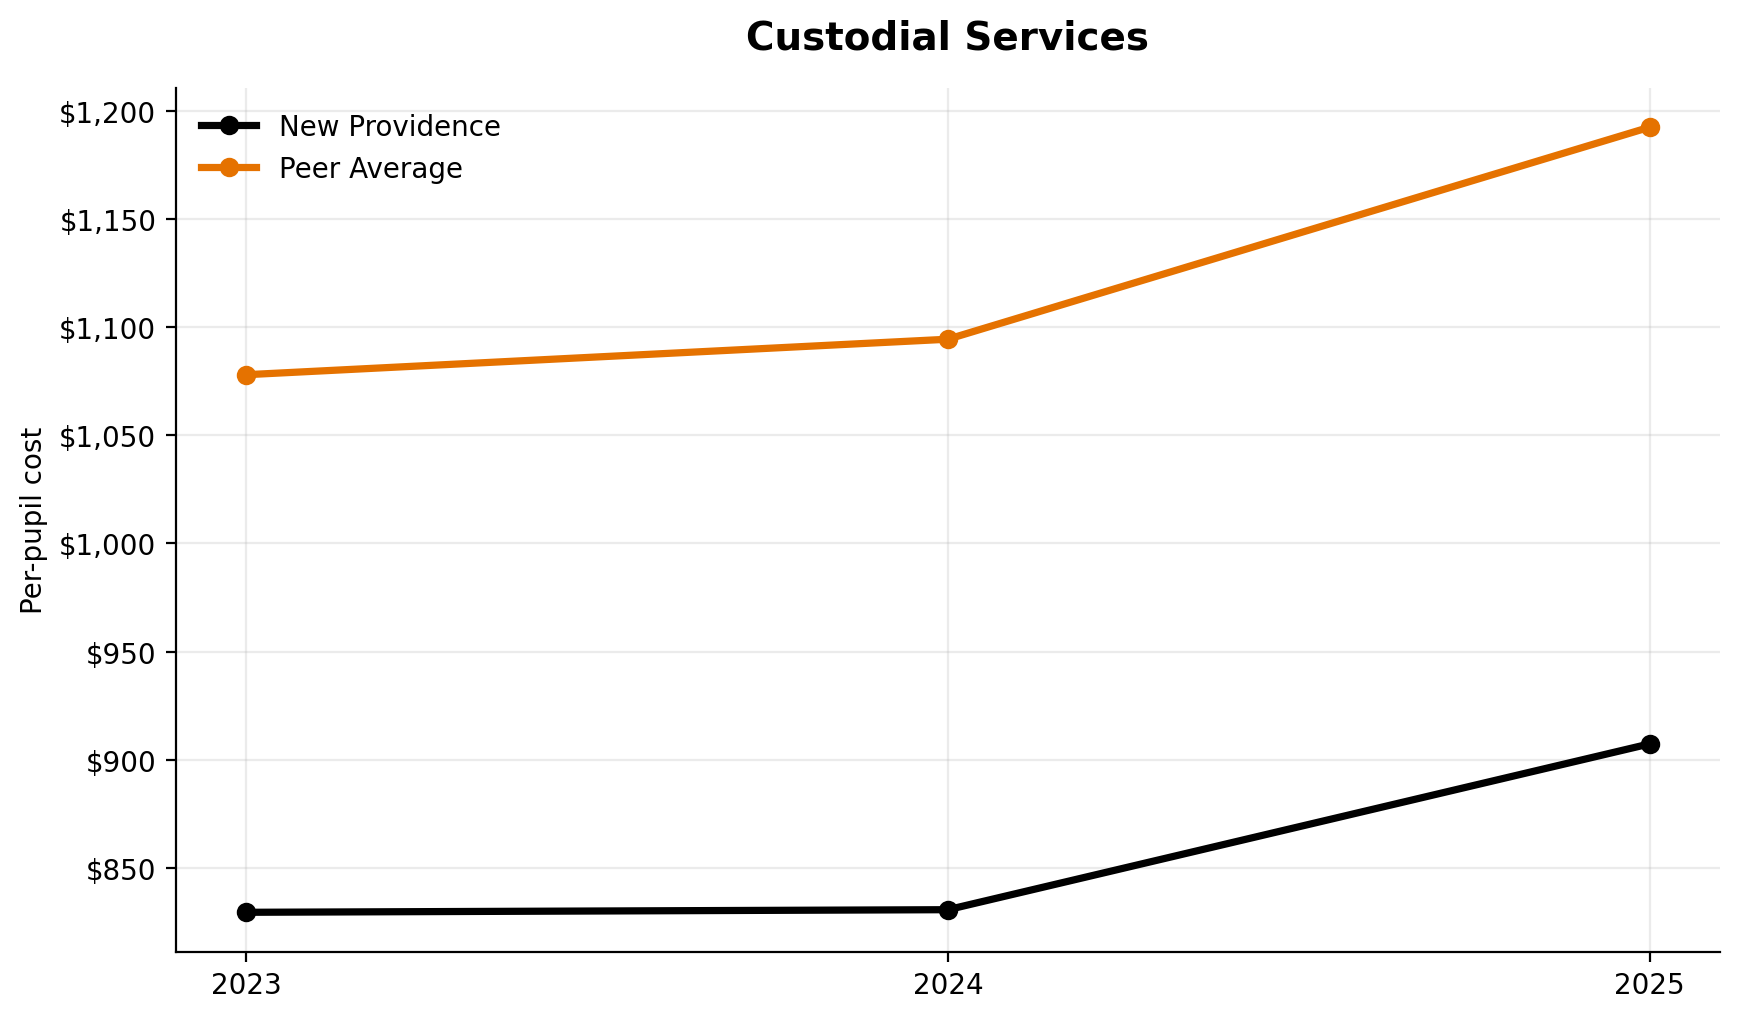
Custodial Services
Custodial services rank 7th of 7.
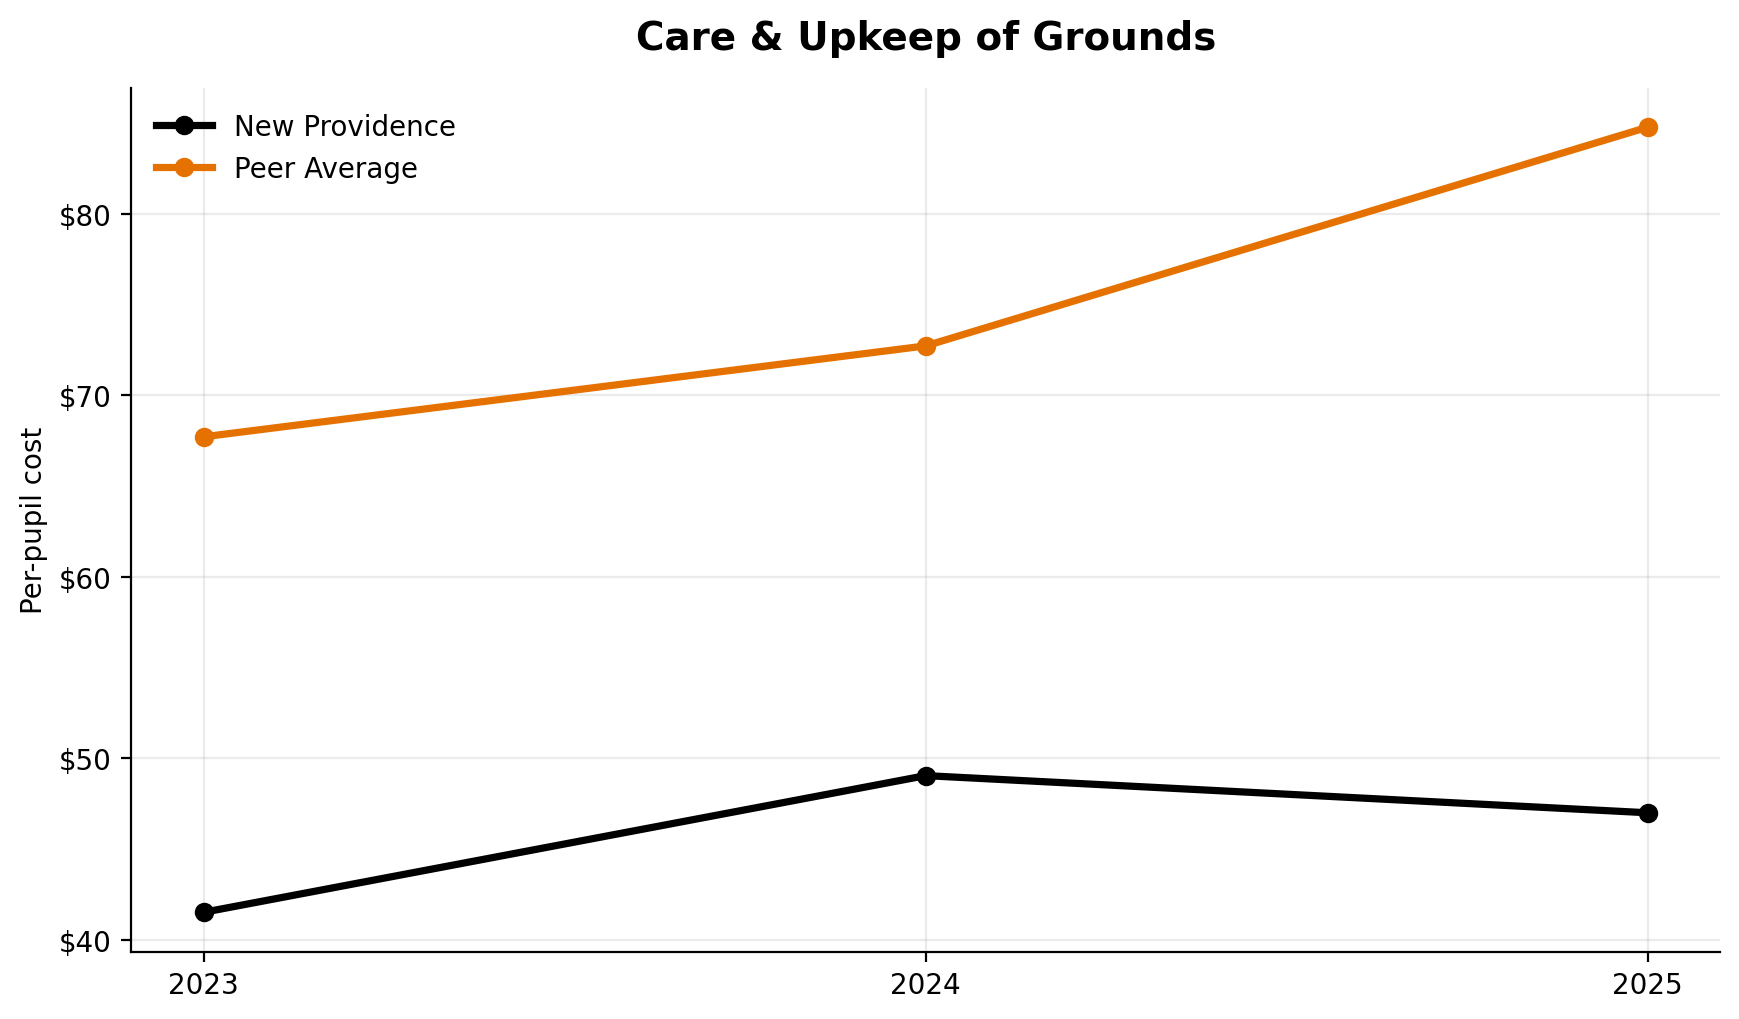
Care & Upkeep of Grounds
Grounds spending ranks 6th of 7.