Randolph ACFR Snapshot
This Randolph snapshot is a slightly scaled-down companion to our core district set and was added in response to requests from community members in Randolph. An ACFR, or Annual Comprehensive Financial Report, is the district’s audited year-end financial report and can help residents see how spending was actually reported across major categories. Like the other ACFR pages, this one uses per-pupil comparisons to show how Randolph lines up against the core seven-district average. That seven-district average is made up of Berkeley Heights, Chatham, Madison, Millburn, New Providence, Summit, and Westfield, with Randolph shown separately and excluded from the average. Per-pupil cost was used because it gives readers a cleaner way to compare districts of different sizes by showing how spending breaks down on a student-by-student basis rather than just through raw totals.
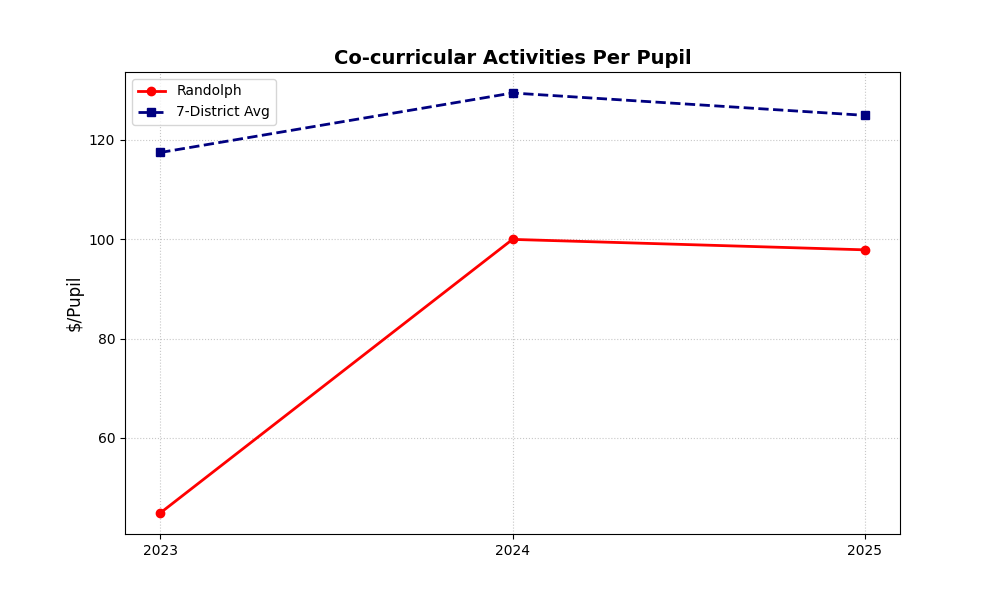
Relevant point: Randolph tracks below the 7-district average in this category across all three years shown.
Questions to ask: Is the lower spending a reflection of fewer offerings, lower participation, or a different accounting structure? Are comparable student opportunities being funded somewhere else in the budget?
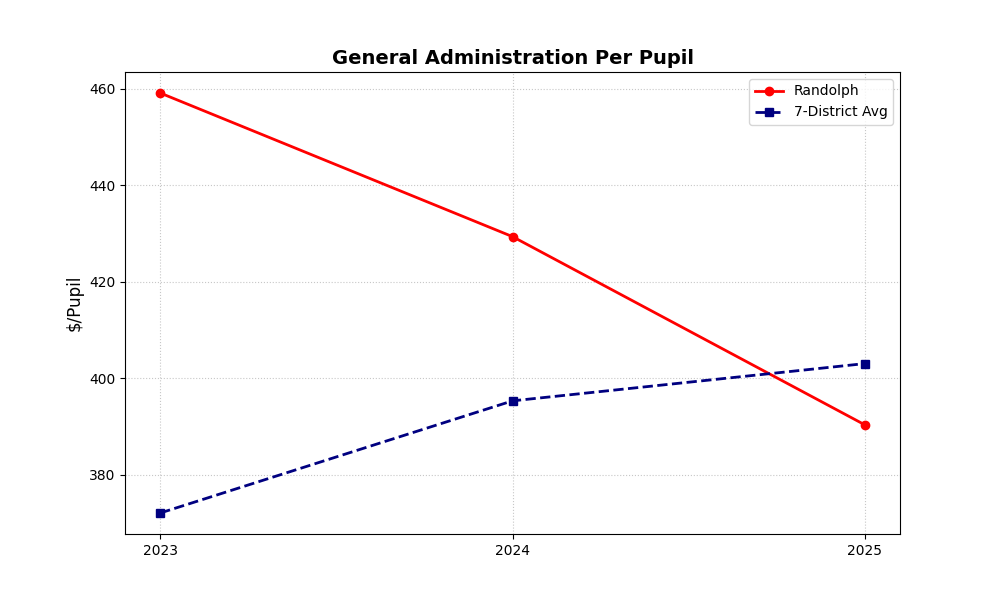
Relevant point: Randolph sits above the 7-district average here, though the line trends downward over time.
Questions to ask: What is driving general administration costs? Is the district reducing overhead, or are some expenses being reclassified into other categories?
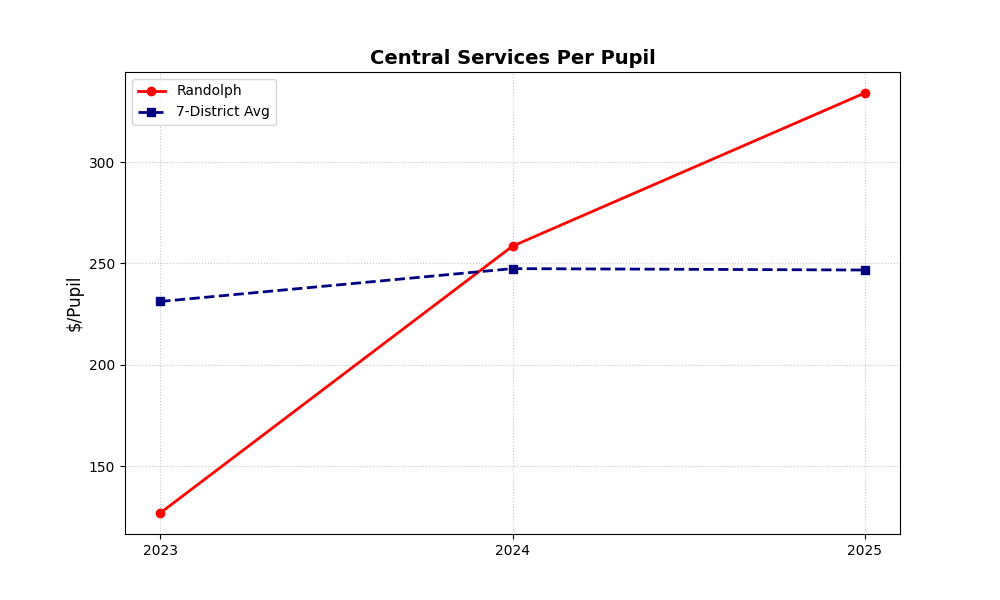
Relevant point: Randolph starts below average and then rises sharply, ending above the group average.
Questions to ask: What changed in central services over this period? Were staffing, technology, business-office, or support functions expanded or shifted into this category?
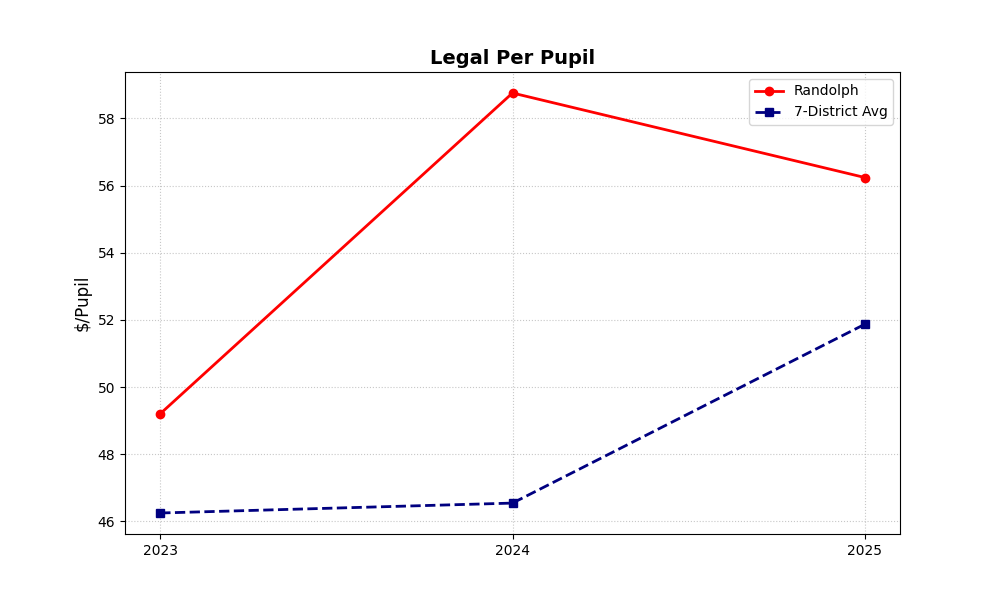
Relevant point: Legal costs can swing significantly year to year, so even one spike can be worth watching closely.
Questions to ask: Did Randolph face unusual litigation, special counsel expenses, labor matters, or one-time legal work in any of these years? Is there a pattern or just a one-year event?
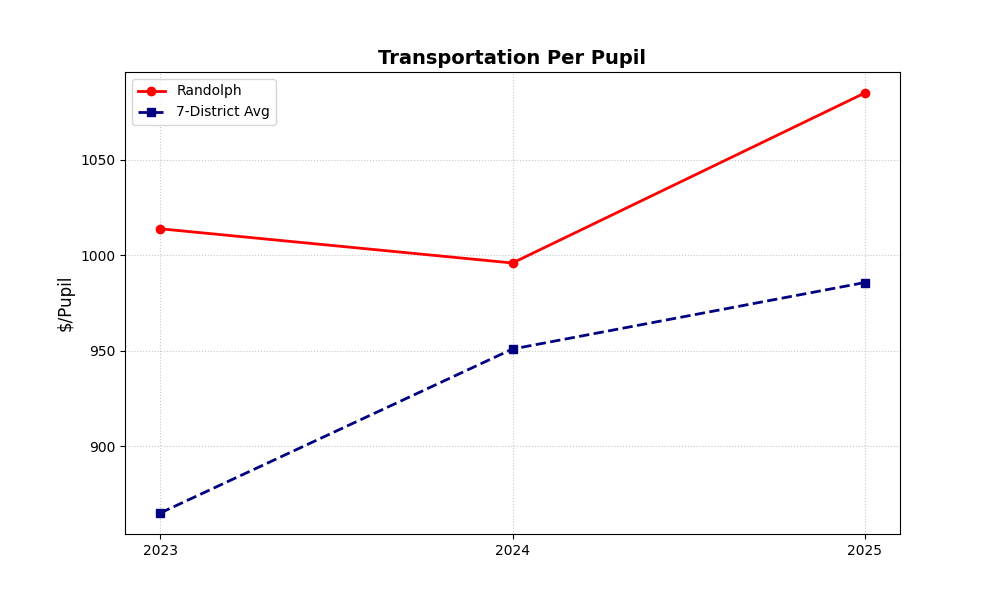
Relevant point: Randolph stays above the 7-district average in transportation and trends upward by the last year shown.
Questions to ask: Are route lengths, district geography, special education transportation, contractor rates, or fuel and labor costs pushing this line higher?
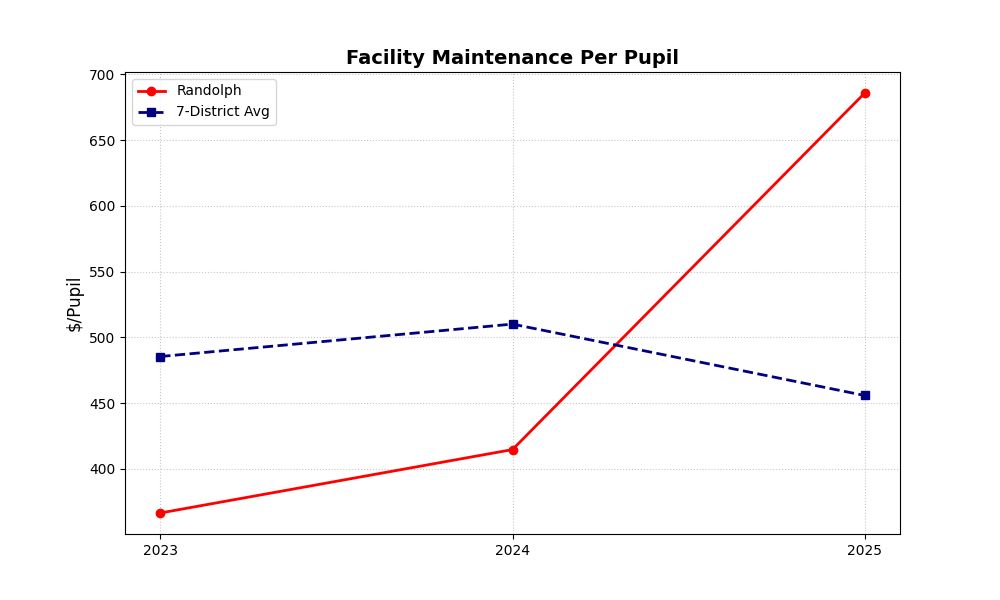
Relevant point: Facility spending helps show whether a district is devoting unusually large or unusually small resources to maintaining buildings.
Questions to ask: Are higher costs tied to aging facilities, deferred maintenance, outsourced services, or capital-related needs that are showing up in operating costs?
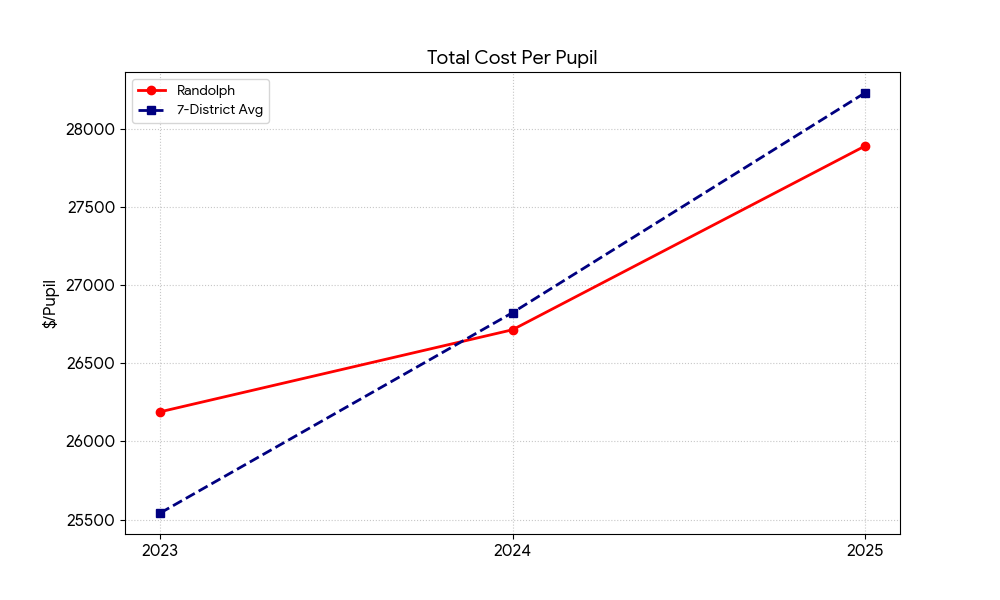
Relevant point: Randolph’s total cost per pupil rises over time and remains in the same general range as the 7-district average.
Questions to ask: What is driving the increase year to year? Is spending growth concentrated in instruction, benefits, transportation, administration, or facilities?
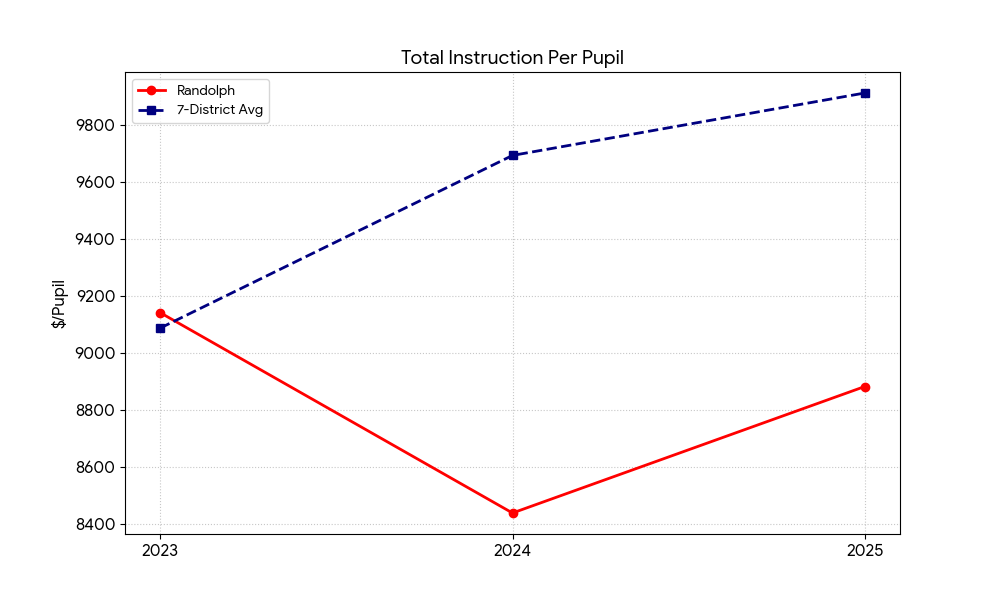
Relevant point: Randolph’s instruction spending sits below the 7-district average in the later years shown.
Questions to ask: Is the district delivering instruction more efficiently, or are dollars being concentrated elsewhere? How does this compare with staffing, class size, student needs, and outcomes?
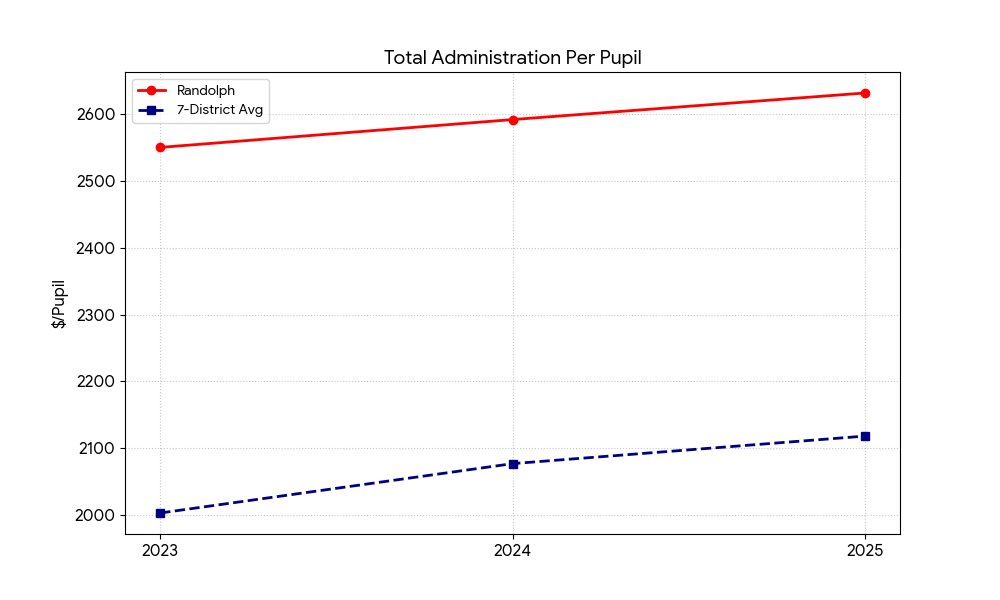
Relevant point: Randolph is above the 7-district average in total administration across the years shown.
Questions to ask: Why is administration running higher here? Is this explained by district structure, staffing choices, shared services, or categorization differences?
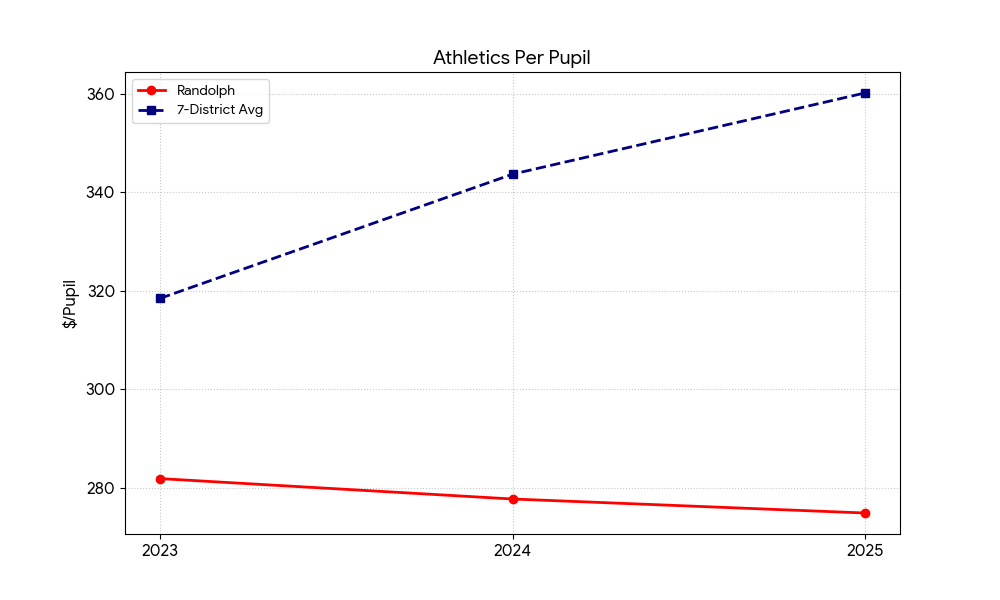
Relevant point: Athletics can be one of the clearer places to compare local priorities against classroom spending.
Questions to ask: Is athletics spending rising faster than instruction? Are coaching, transportation, facilities, or participation levels affecting this line?
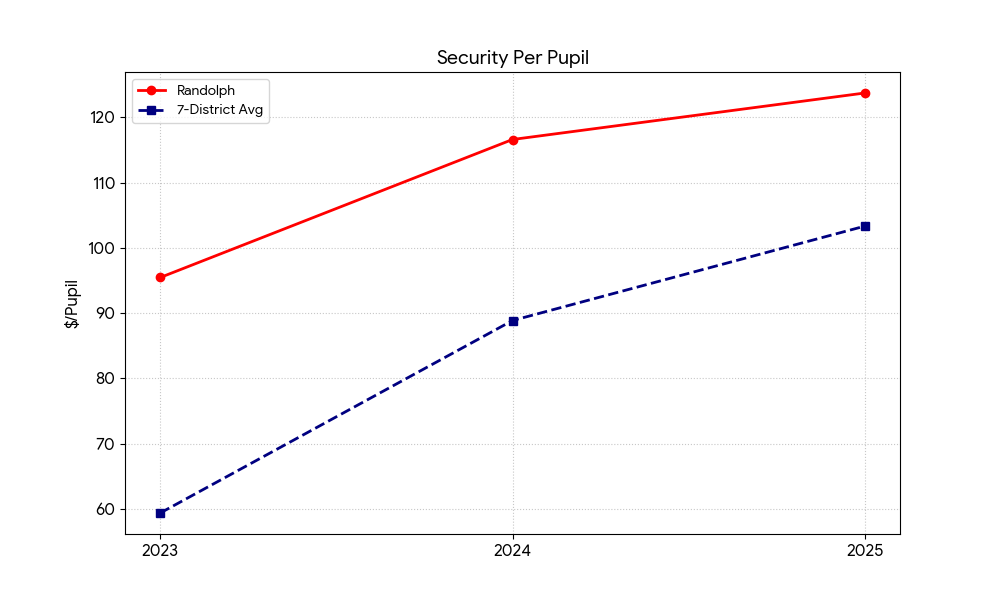
Relevant point: Security costs often reflect both district priorities and broader operational pressures.
Questions to ask: Did staffing, contracts, equipment, or school-entry changes alter this category? Is the increase temporary or part of a longer-term trend?
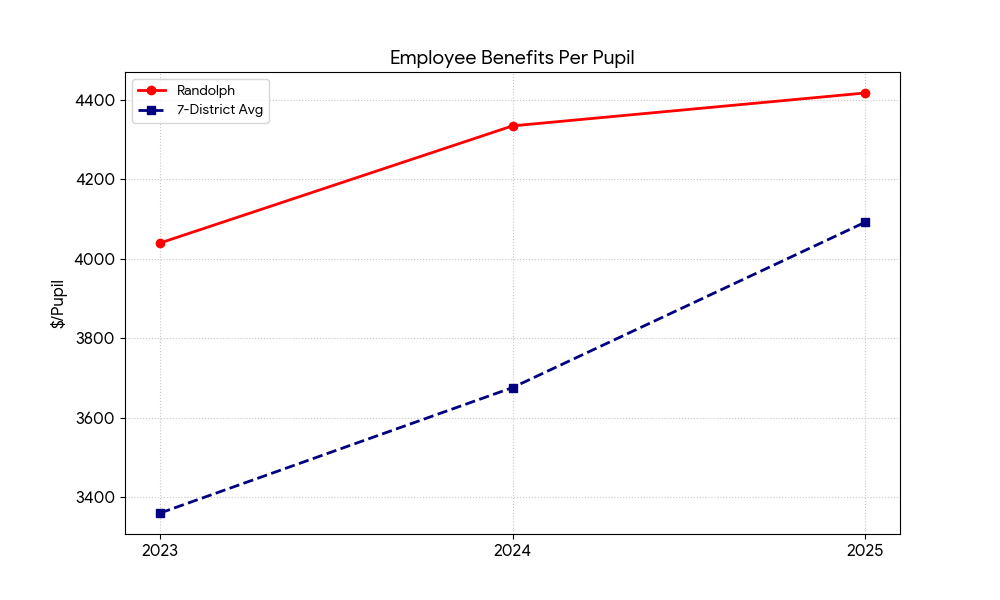
Relevant point: Employee benefits are one of the most important long-term cost drivers in any district budget, and Randolph is above the 7-district average here.
Questions to ask: Are health insurance, pension-related costs, or staffing changes behind the increase? How much of future budget pressure is coming from benefits growth alone?
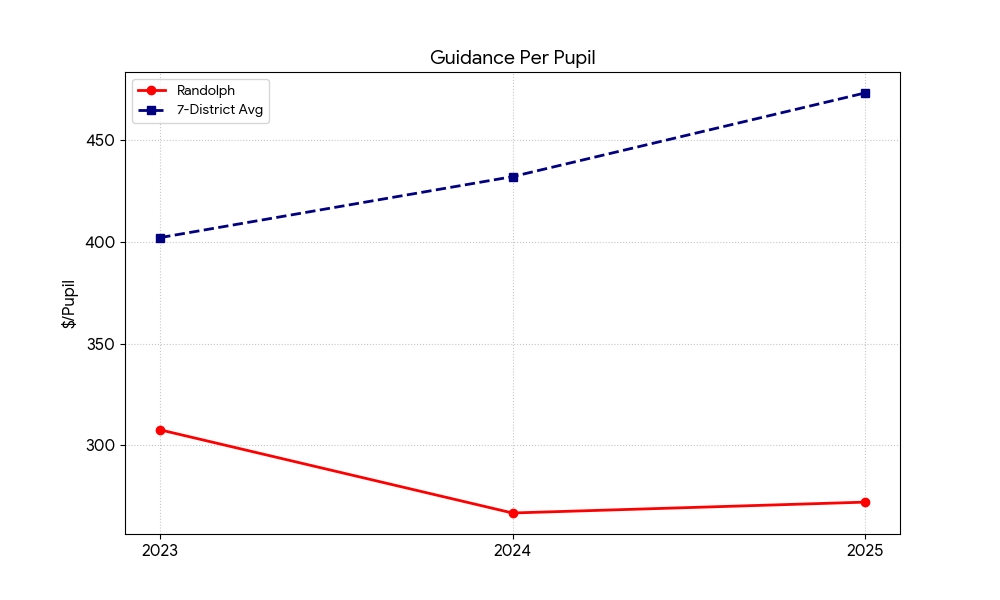
Relevant point: Guidance spending can reflect counseling access, student-support priorities, and staffing decisions.
Questions to ask: Is Randolph investing more or less than peers in student support services? Are counseling ratios and student needs helping explain the trend?
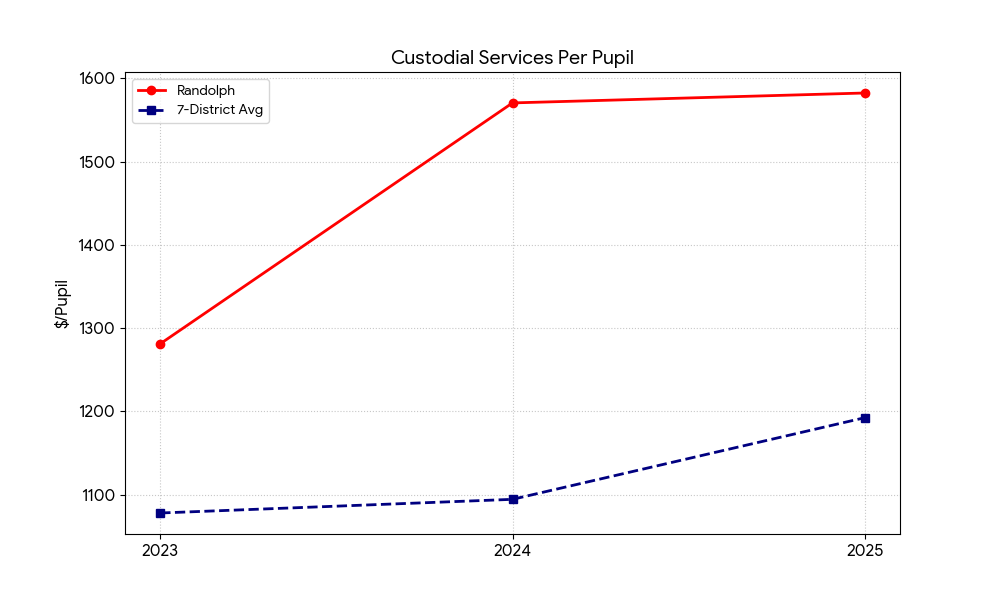
Relevant point: Custodial costs can shift based on staffing models, outsourcing, building usage, and square footage.
Questions to ask: Are these costs being driven by in-house staffing, overtime, contracted services, or the number and age of district buildings?
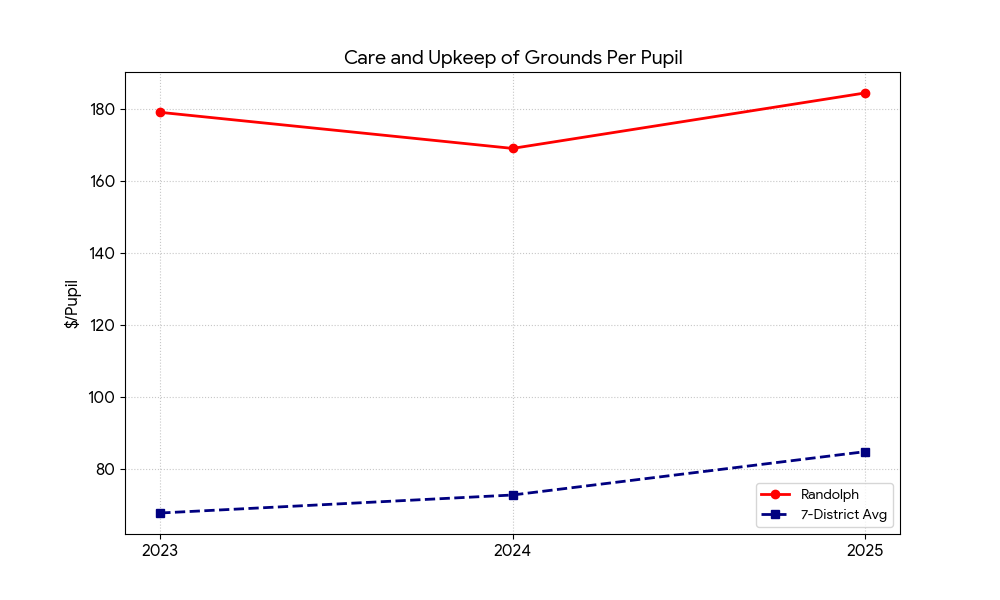
Relevant point: Grounds costs can reveal whether outdoor facilities and site maintenance are creating added operating pressure.
Questions to ask: Are athletic fields, snow removal, landscaping, or contracted grounds work pushing this line up? Is the district taking on recurring costs that residents should track over time?