Summit School District ACFR Profile
This page is meant to give residents a cleaner apples-to-apples view of how Summit compares with the six other districts on our ACFR dashboard. The rankings below are based on verified 2025 per-pupil figures unless otherwise noted. A rank of 1st means the highest per-student spending in that category among the seven-district peer group.
1. Total District Overview
Summit sits in the lower tier overall on total per-pupil cost, but not because every category is low. The district combines a handful of top-ranked line items with a number of bottom-tier categories, which creates a much more uneven spending profile than the top-line total suggests.
Top-Line Position
- Total Cost Per Pupil: 6th of 7 ($25,766)
- Instruction (All Categories): 5th of 7 ($9,788)
- Total Administration: 6th of 7
Questions Residents Can Ask
- If Summit is 6th overall, which top-ranked categories are offsetting much lower spending elsewhere?
- Which categories reflect deliberate priorities, and which may reflect coding or organizational structure?
- How does Summit’s uneven cost profile line up with district performance and student need?
2. Core Instruction & Classroom Spending
This section shows how Summit compares on classroom instruction and related instructional support categories.
Where Summit Ranks
- Regular Programs: 4th of 7
- Staff Training: 6th of 7
- Textbooks: 1st of 7
- Improvement of Instruction: 2nd of 7
What Stands Out
Summit is not near the top in overall instruction, but it does rank 1st of 7 in textbooks and 2nd of 7 in improvement of instruction. That suggests targeted instructional support spending even while total instruction and staff training rank lower. Those higher ranks are not self-justifying. They are categories residents should ask the district to explain.
3. Special Education Services
Summit’s special education profile is mixed, with a few middle-tier categories but several lines near the bottom of the peer group.
Where Summit Ranks
- Special Education (Total): 4th of 7
- Resource Room: 3rd of 7
- Autism: 5th of 7
- Child Study Teams: 7th of 7
- Speech, OT, PT & Related Services: 7th of 7
- Learning & Language Disabilities: 3rd of 7
- Other Support (Extra Services): 6th of 7
- Other School Placement: 7th of 7
What Stands Out
Summit sits in the middle on total special education, resource room, and learning/language disabilities, but ranks 7th of 7 in child study teams, speech/OT/PT, and other school placement. This is not an across-the-board special education profile. It is a split one, and the differences between those lines deserve explanation.
4. Student Activities & Support Services
These categories reflect counseling, student activities, health services, library/media, bilingual support, and remedial services.
Where Summit Ranks
- Athletics: 5th of 7
- Guidance: 7th of 7
- Health Services: 5th of 7
- Educational Media Services (Library): 1st of 7
- Bilingual Education: 1st of 7
- Cocurricular Activities: 6th of 7
- Basic Skills / Remedial: 4th of 7
What Stands Out
Summit ranks 1st of 7 in both educational media services and bilingual education, but 7th of 7 in guidance and 6th of 7 in cocurricular activities. This section shows one of the clearest examples of Summit’s uneven profile. The higher-ranked categories should be questioned the same way lower-ranked ones are, not treated as automatic wins.
5. Administration & Technology
Summit’s administrative profile includes one top-ranked category but several others in the lower tier. That makes this a place where residents should ask what is actually sitting inside the accounts, not just look at labels.
Where Summit Ranks
- Gen Admin (Total Sub-Account): 6th of 7
- Employee Benefits: 4th of 7
- Admin Information Tech: 7th of 7
- Legal Fees: 3rd of 7
- School Administration: 4th of 7
- Central Services: 1st of 7
- Gen Admin (Misc): 6th of 7
What Stands Out
Summit ranks 1st of 7 in central services, but 7th of 7 in admin information tech and 6th of 7 in both gen admin (misc) and the gen admin total sub-account. Total administration itself ranks 6th of 7. That means central services should not be read as a quiet positive. It is a line item the district should be able to explain specifically.
6. Operations, Safety & Maintenance
These are the costs of running the district day to day: transportation, security, facility maintenance, custodial services, and grounds. Lower rankings here are not automatically good or bad. They still need context.
Where Summit Ranks
- Care & Upkeep of Grounds: 5th of 7
- Transportation: 7th of 7
- Facility Maintenance: 5th of 7
- Security: 7th of 7
- Custodial Services: 3rd of 7
What Stands Out
Summit ranks 3rd of 7 in custodial services, but transportation and security both rank 7th of 7. Facility maintenance and grounds are also in the lower half of the group. This section, like others on the page, looks uneven rather than consistently high or consistently low.
Trend Charts
These charts show not just where Summit ranks in 2025, but how spending has moved over time relative to the seven-district average.
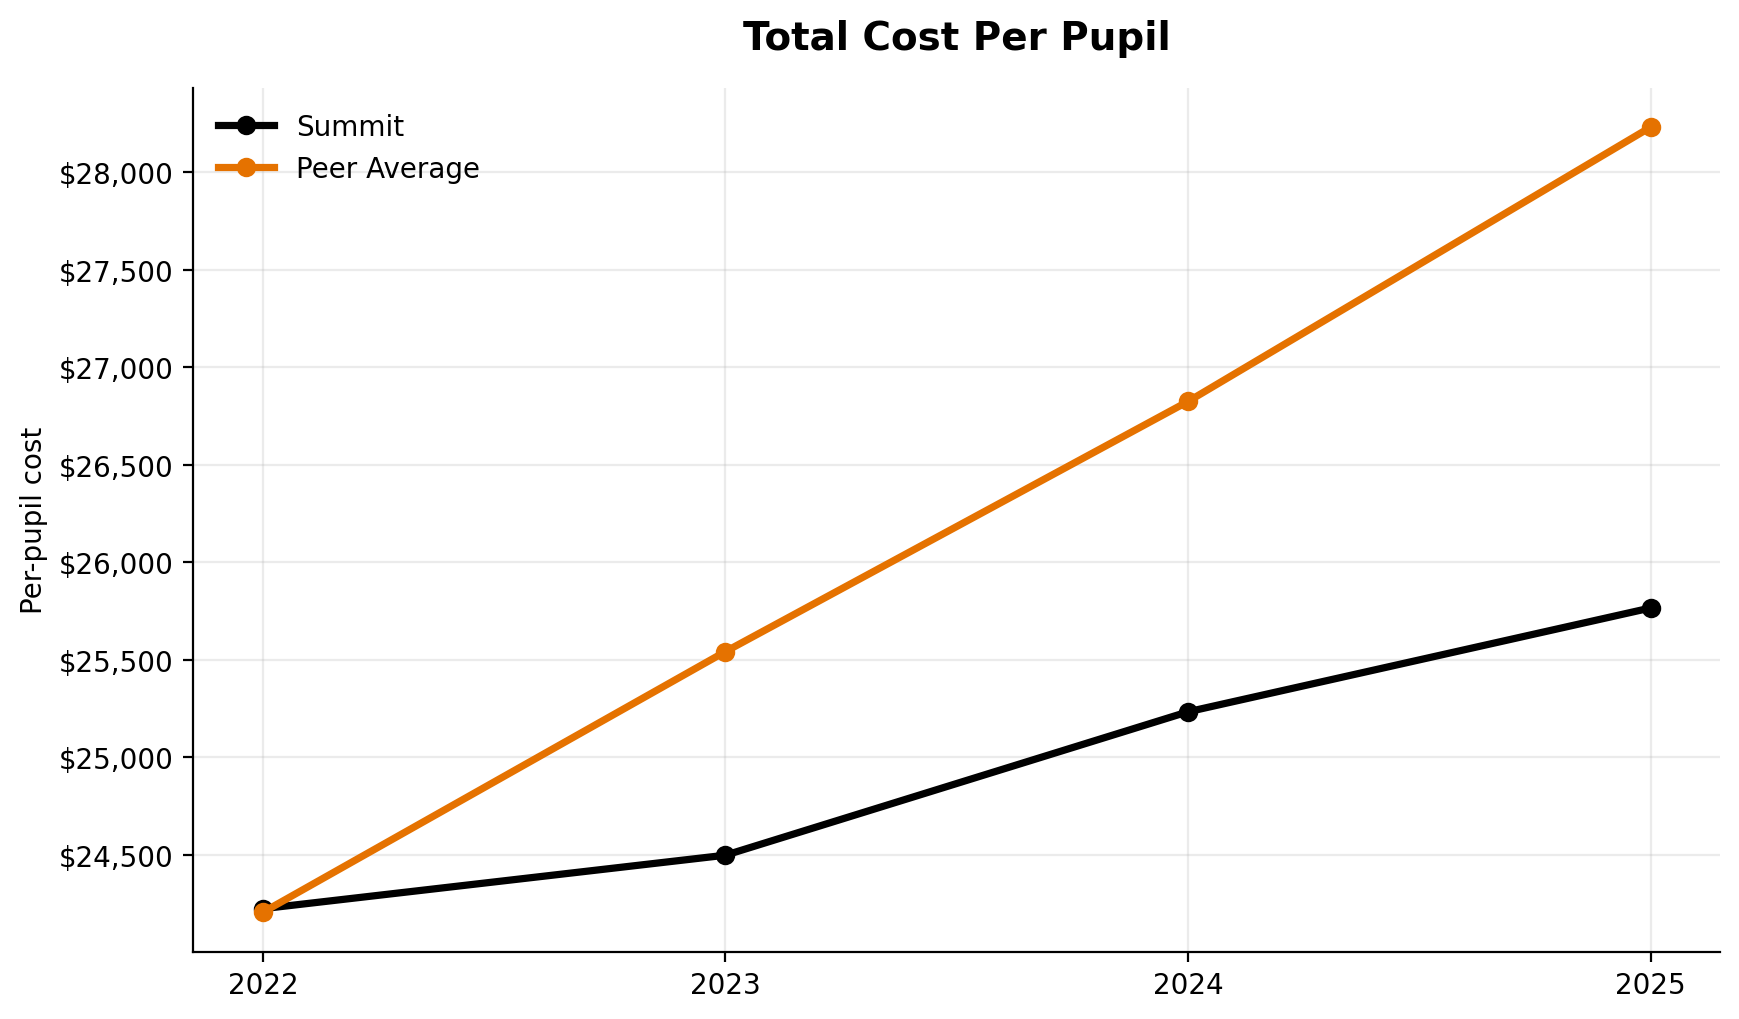
Total Cost Per Pupil
Summit ranks 6th of 7 overall on total per-pupil cost.
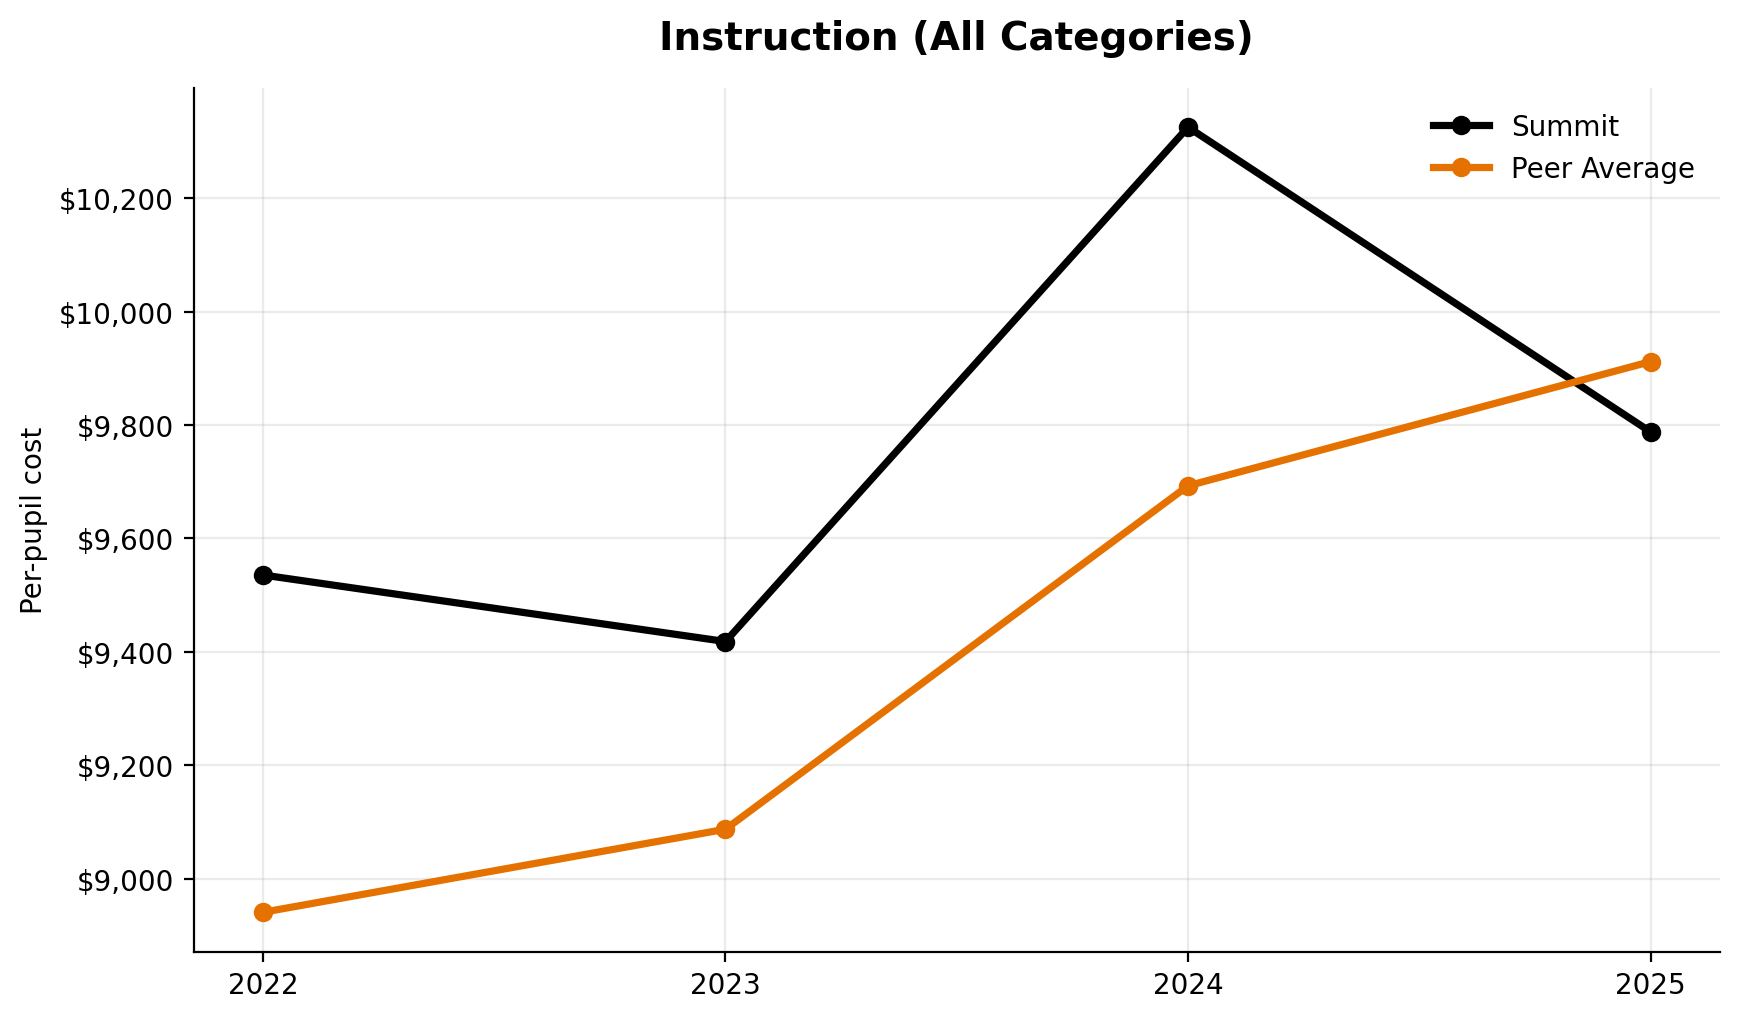
Instruction (All Categories)
Total instruction ranks 5th of 7 in 2025.
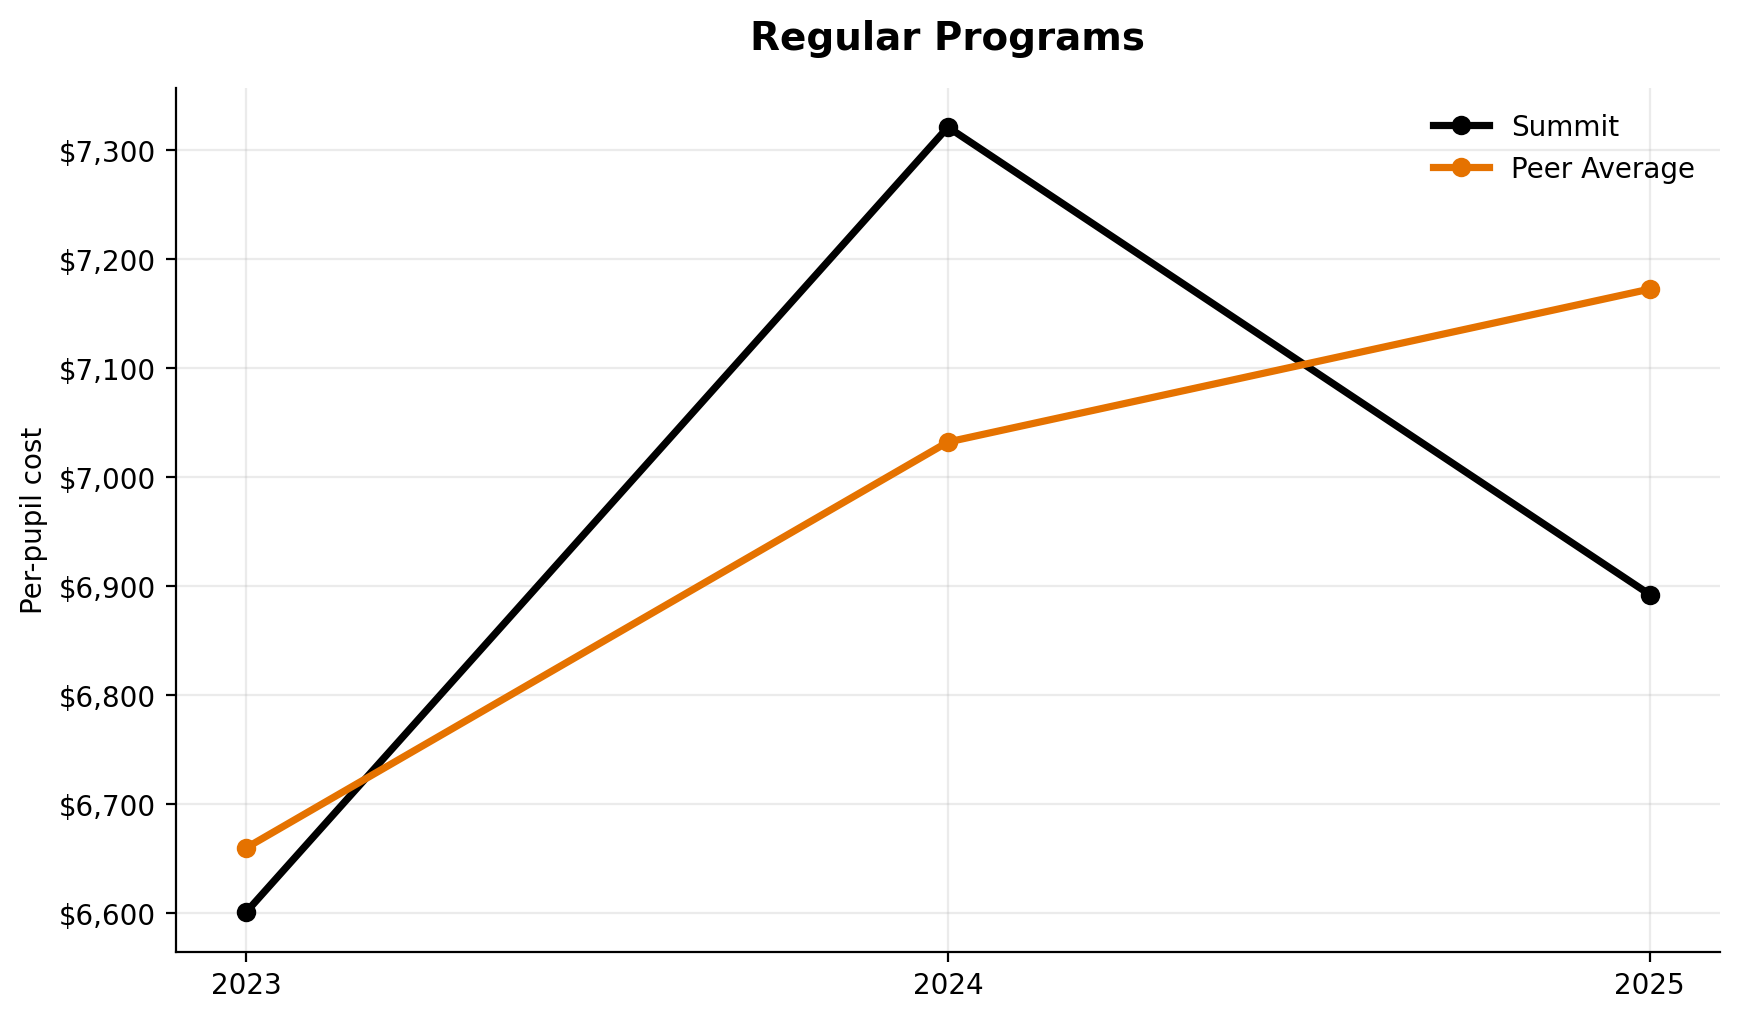
Regular Programs
Regular classroom instruction ranks 4th of 7.
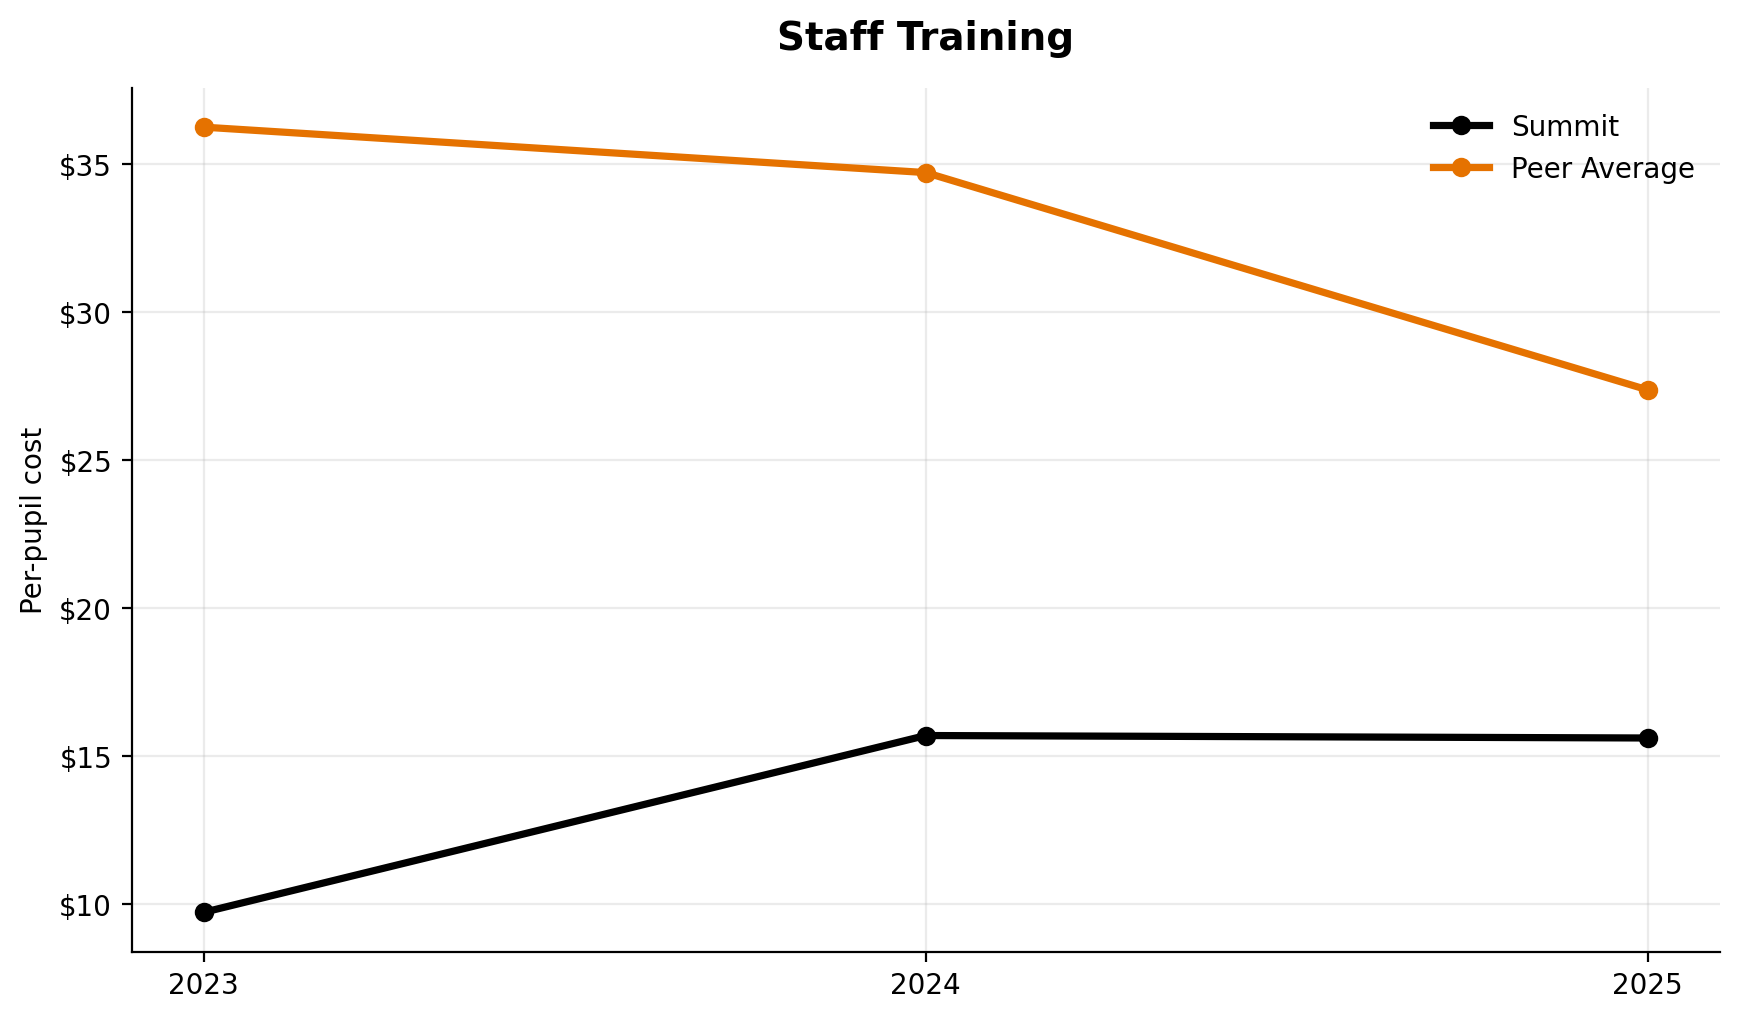
Staff Training
Staff training lands 6th of 7.
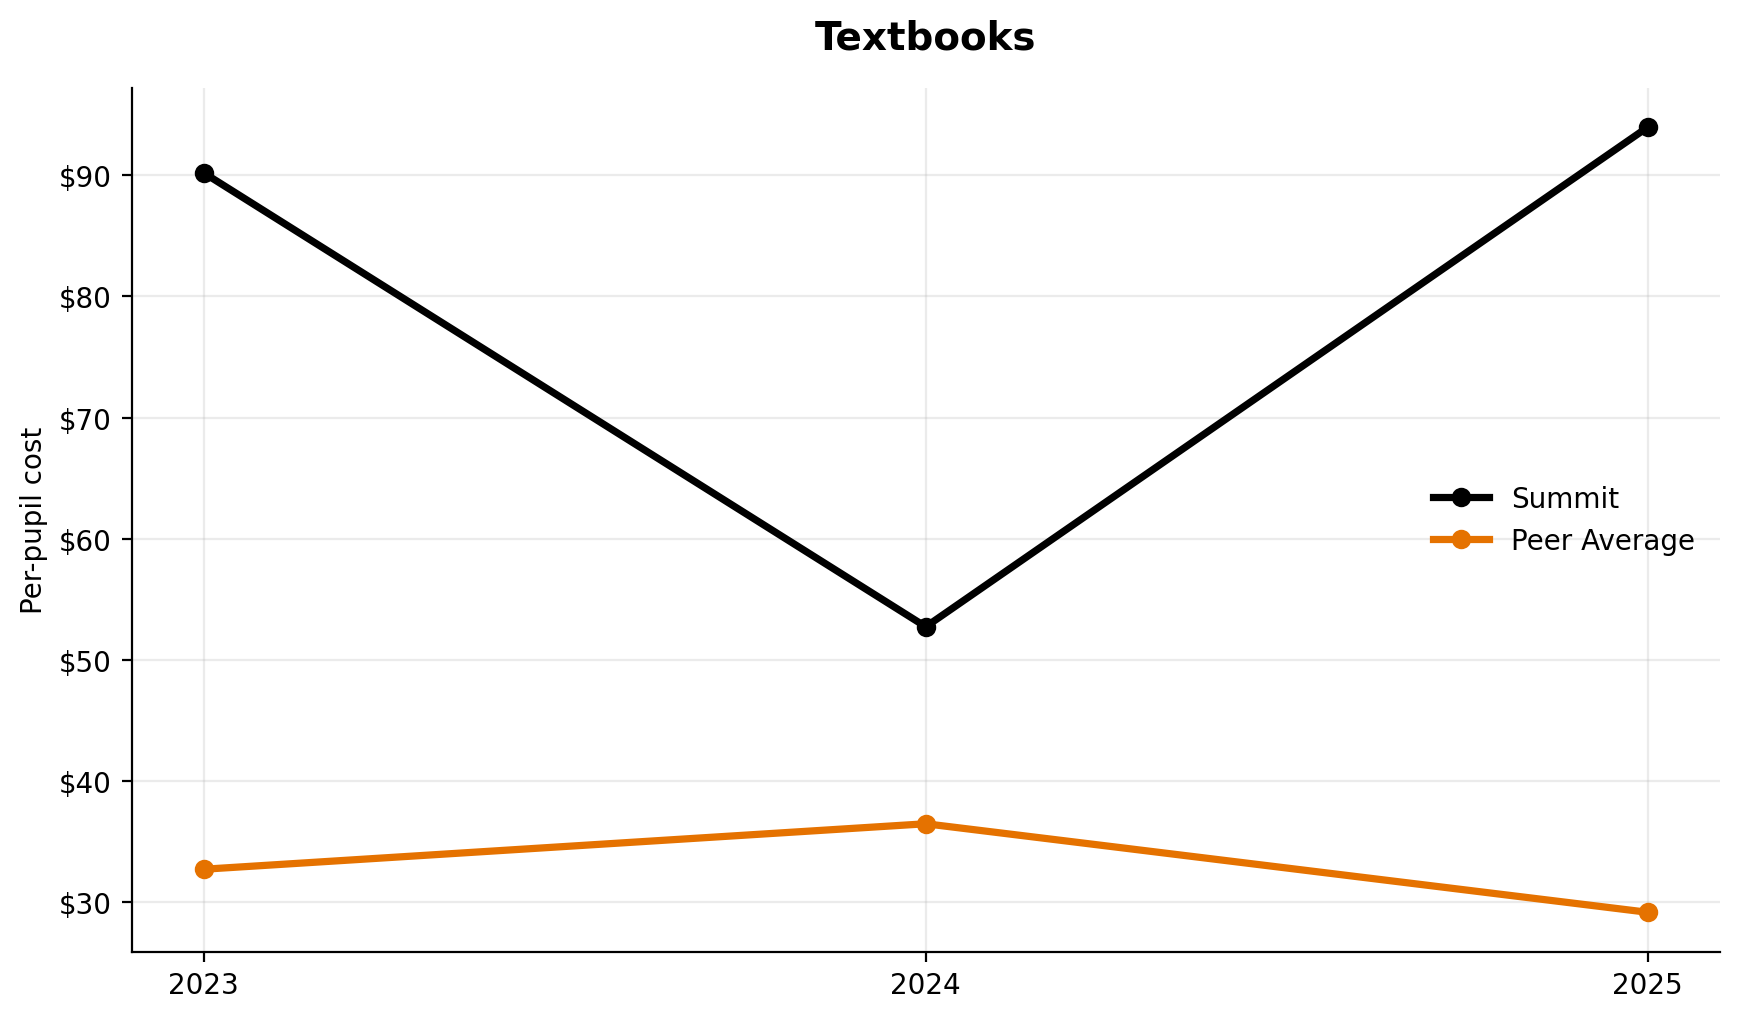
Textbooks
Textbook spending ranks 1st of 7. That should be explained in context, not treated as a built-in positive.
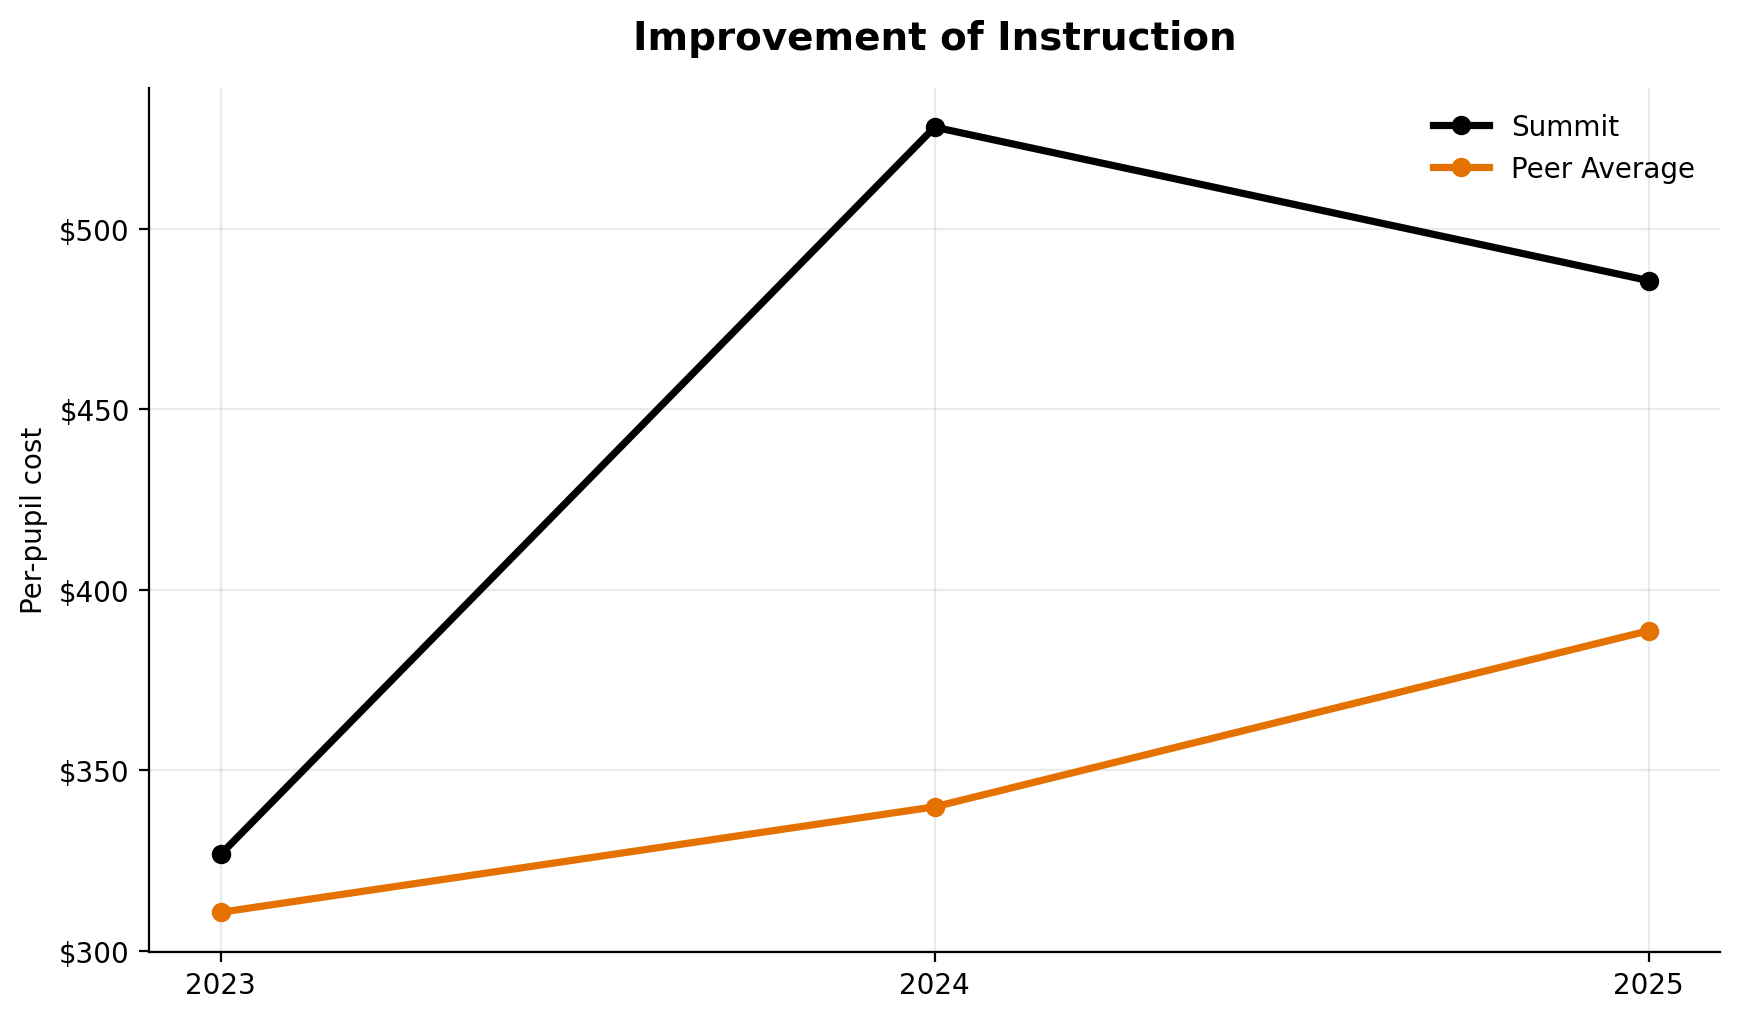
Improvement of Instruction
This category ranks 2nd of 7.
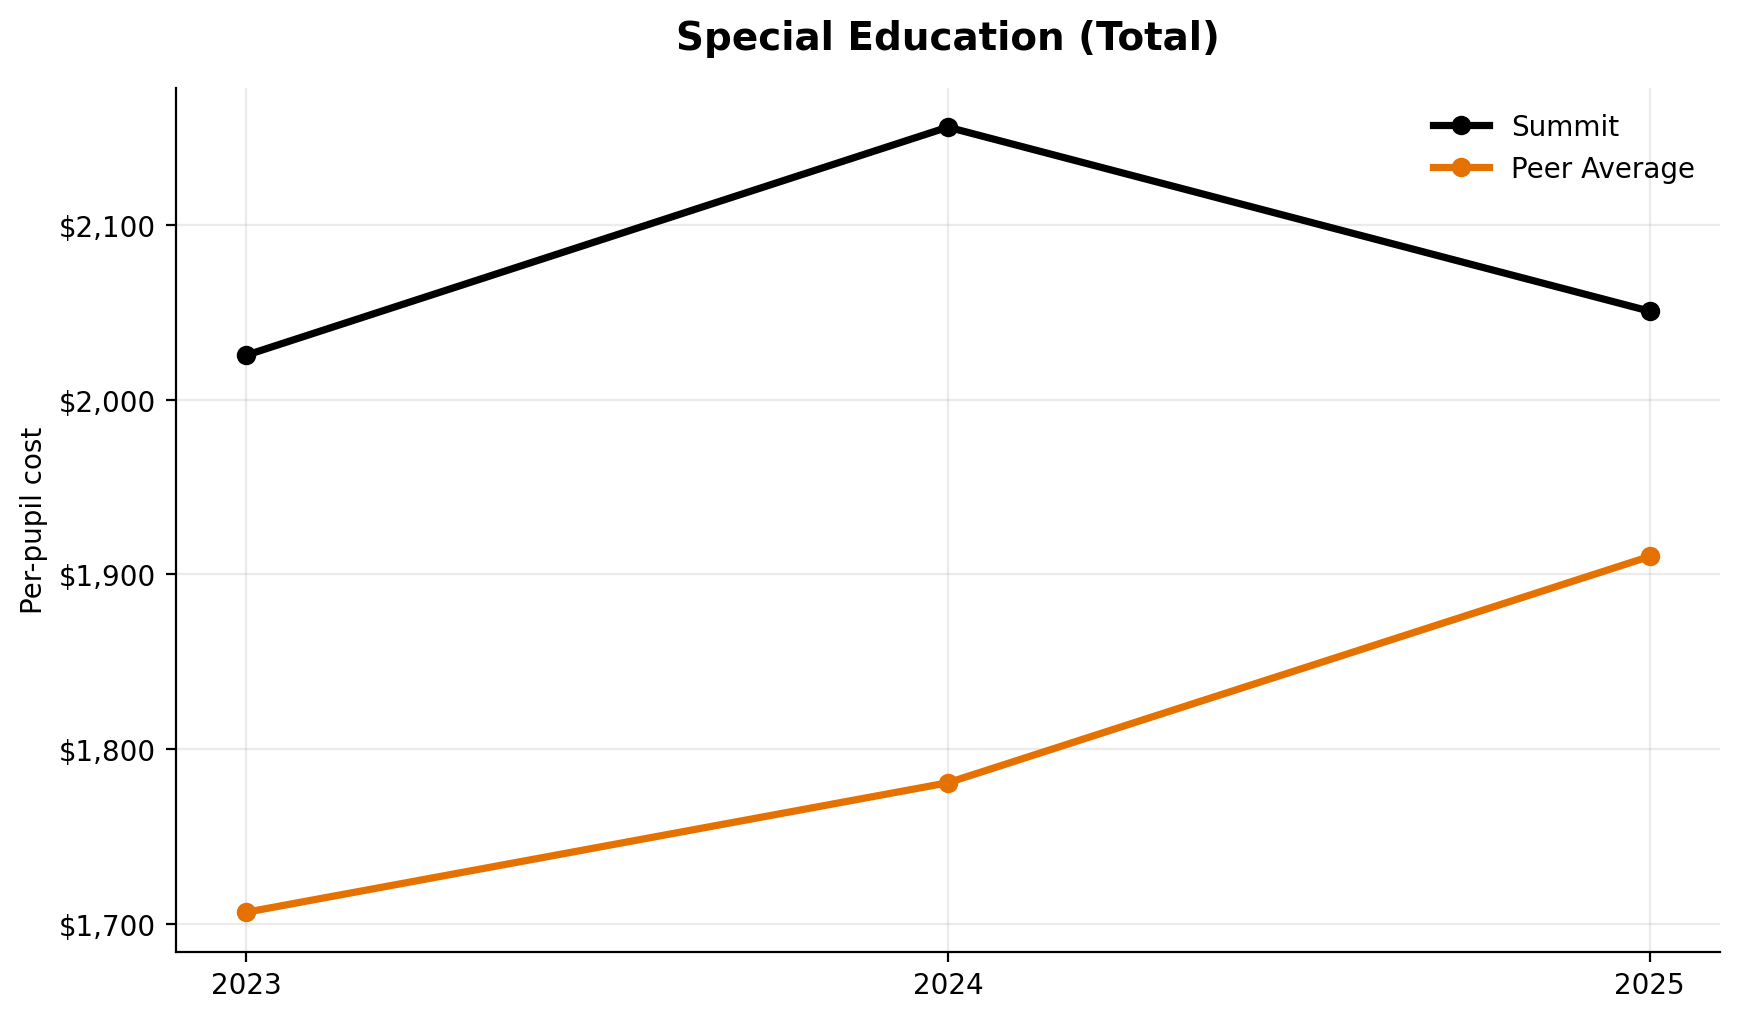
Special Education (Total)
Total special education ranks 4th of 7.
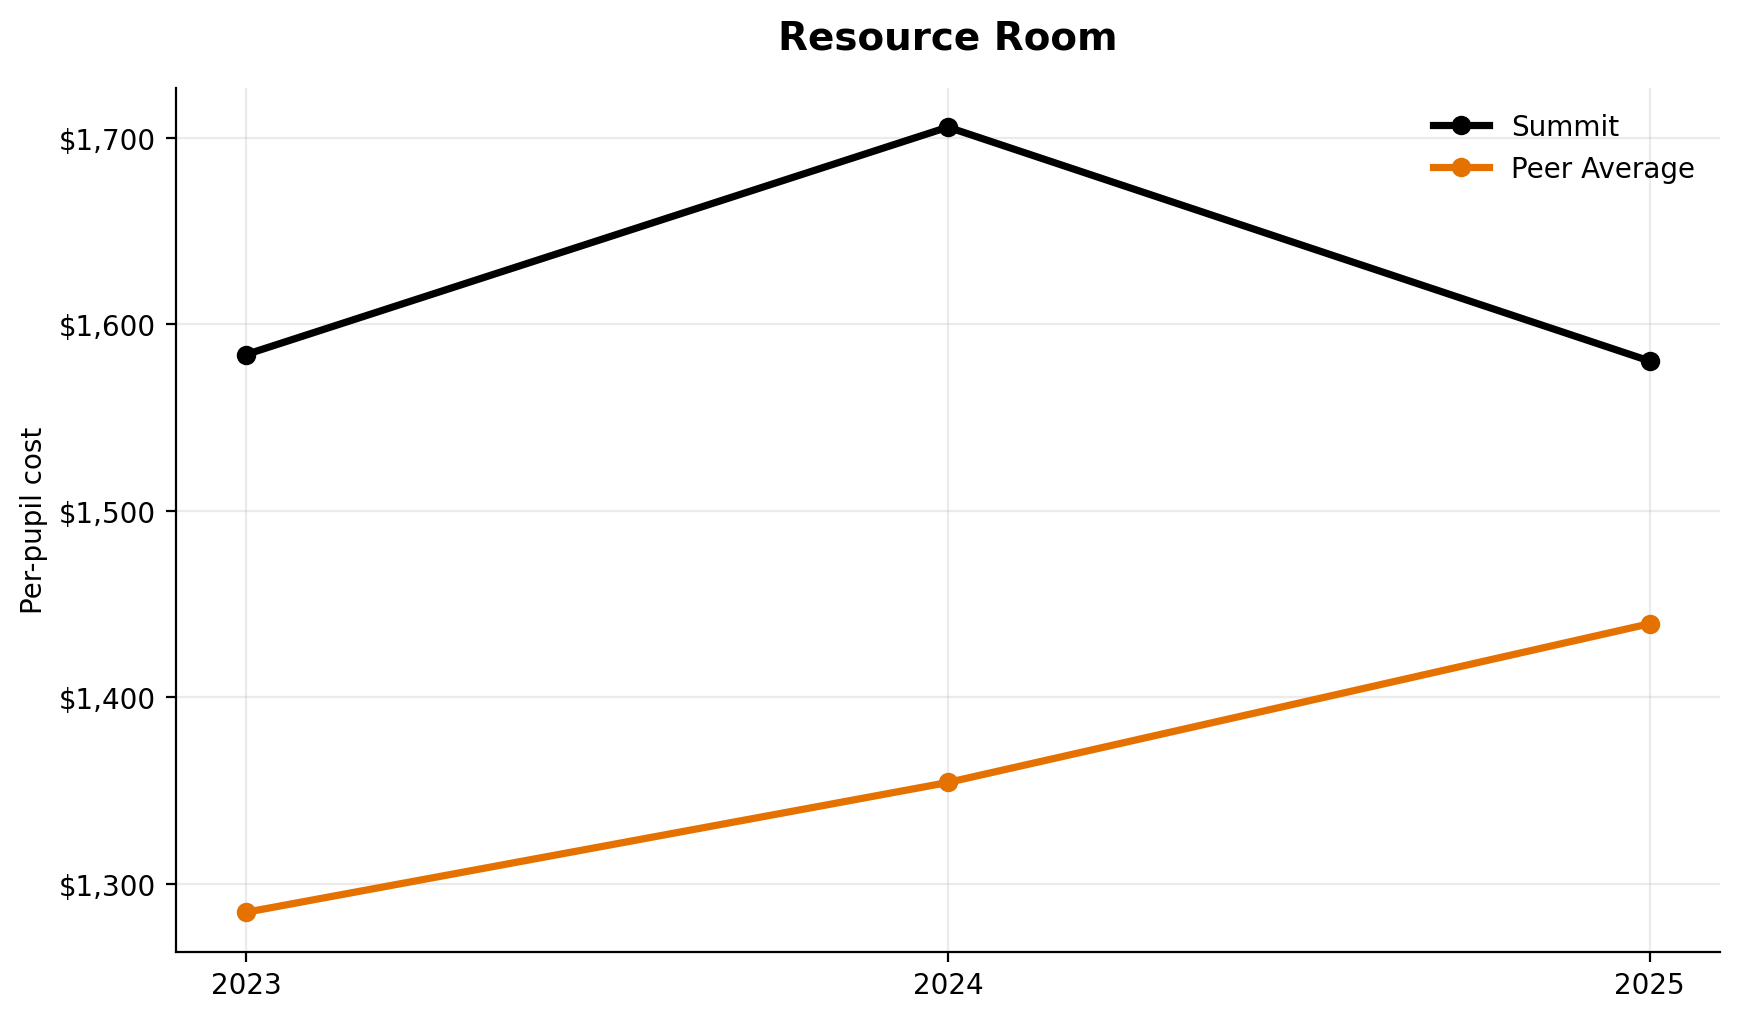
Resource Room
Resource room spending ranks 3rd of 7.
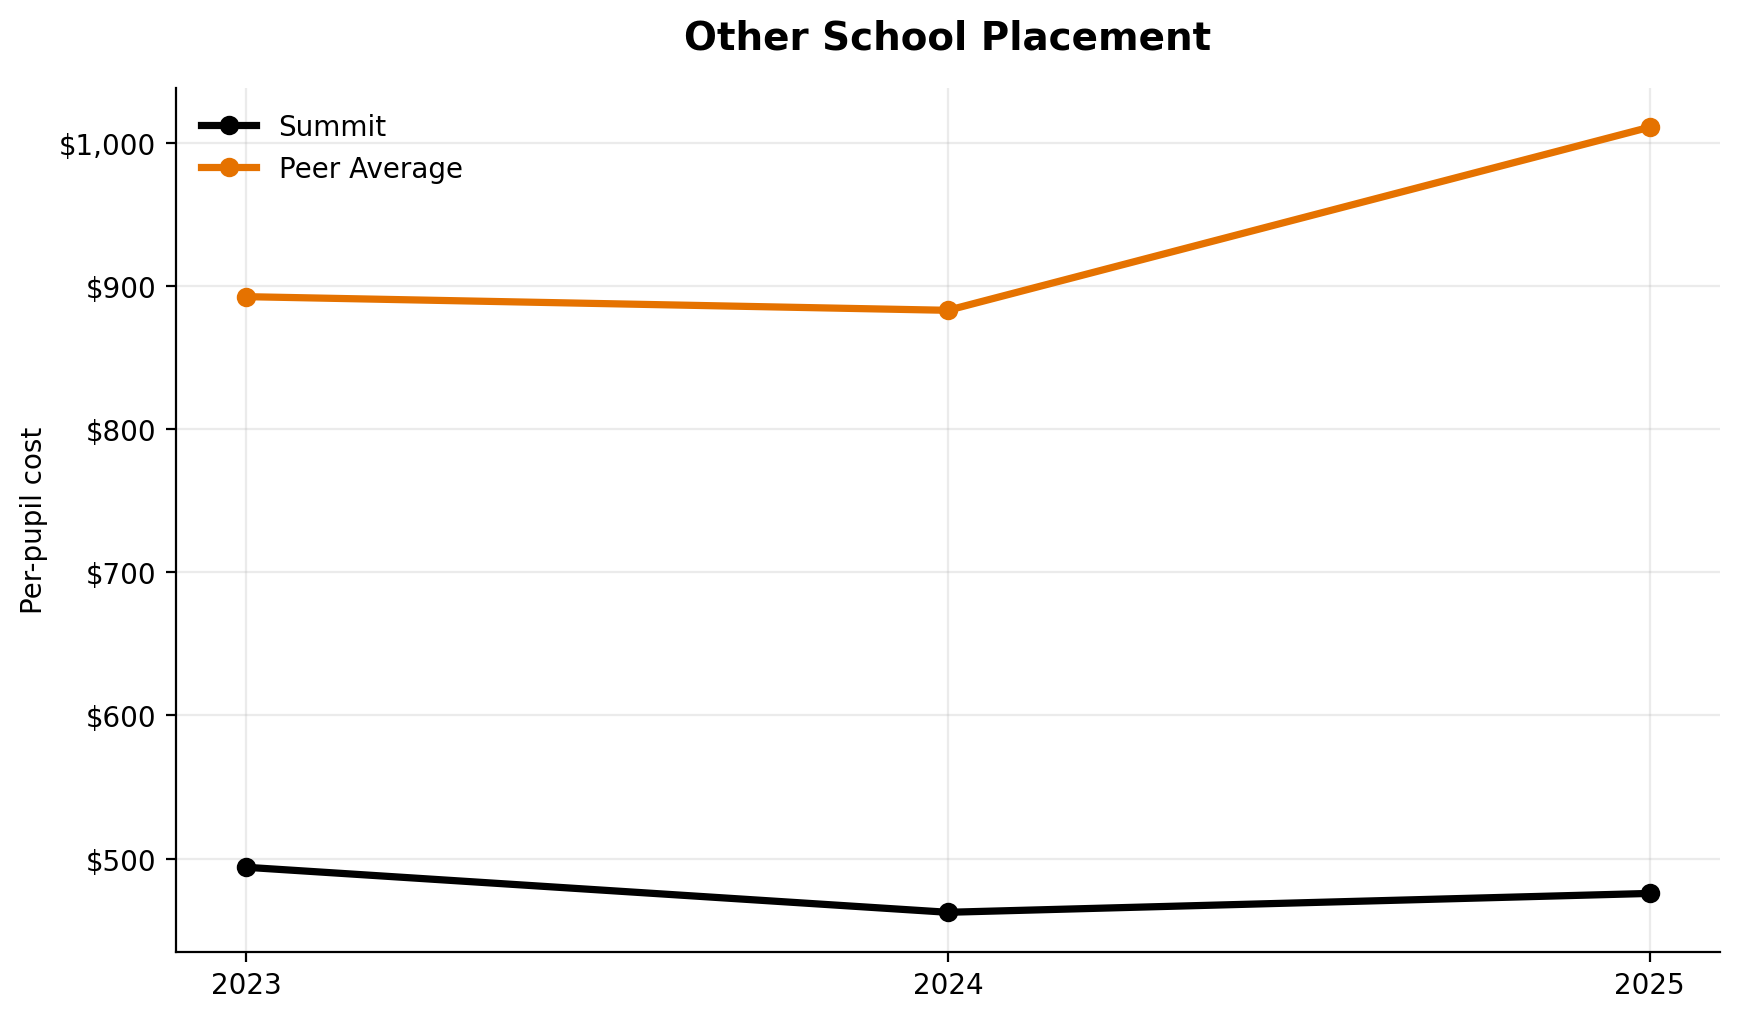
Other School Placement
Out-of-district placement ranks 7th of 7.
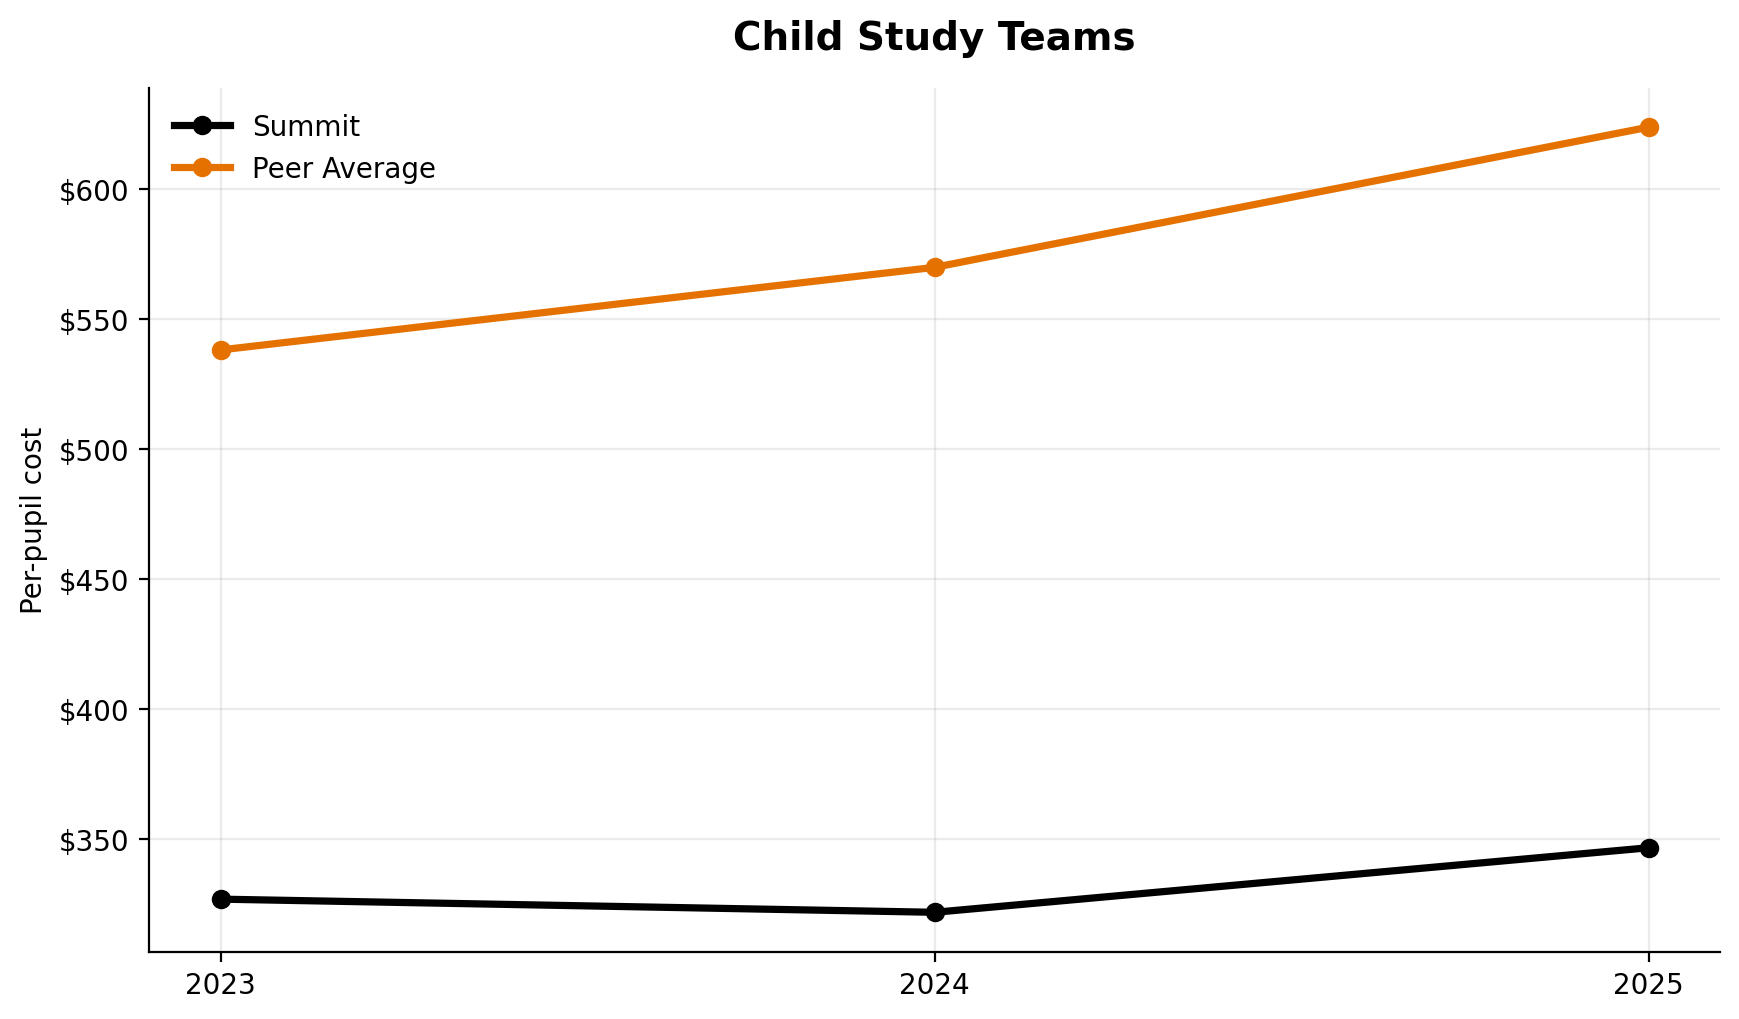
Child Study Teams
Child study teams rank 7th of 7.
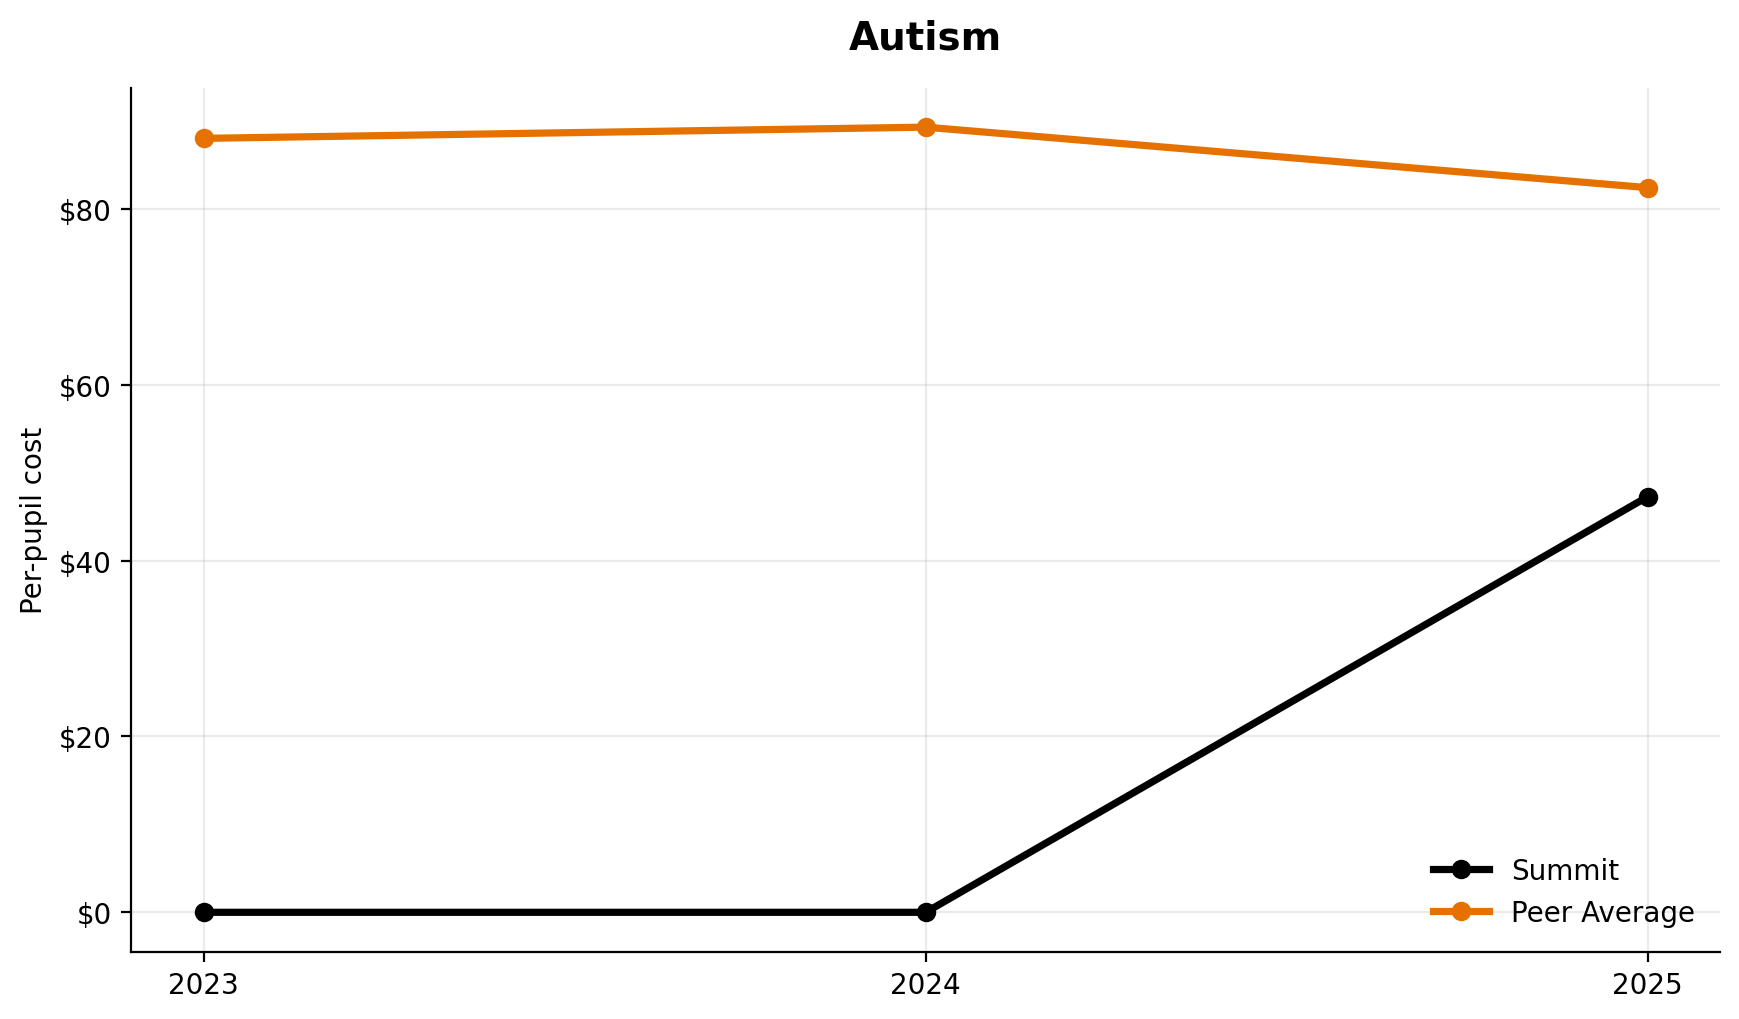
Autism
Autism services rank 5th of 7.
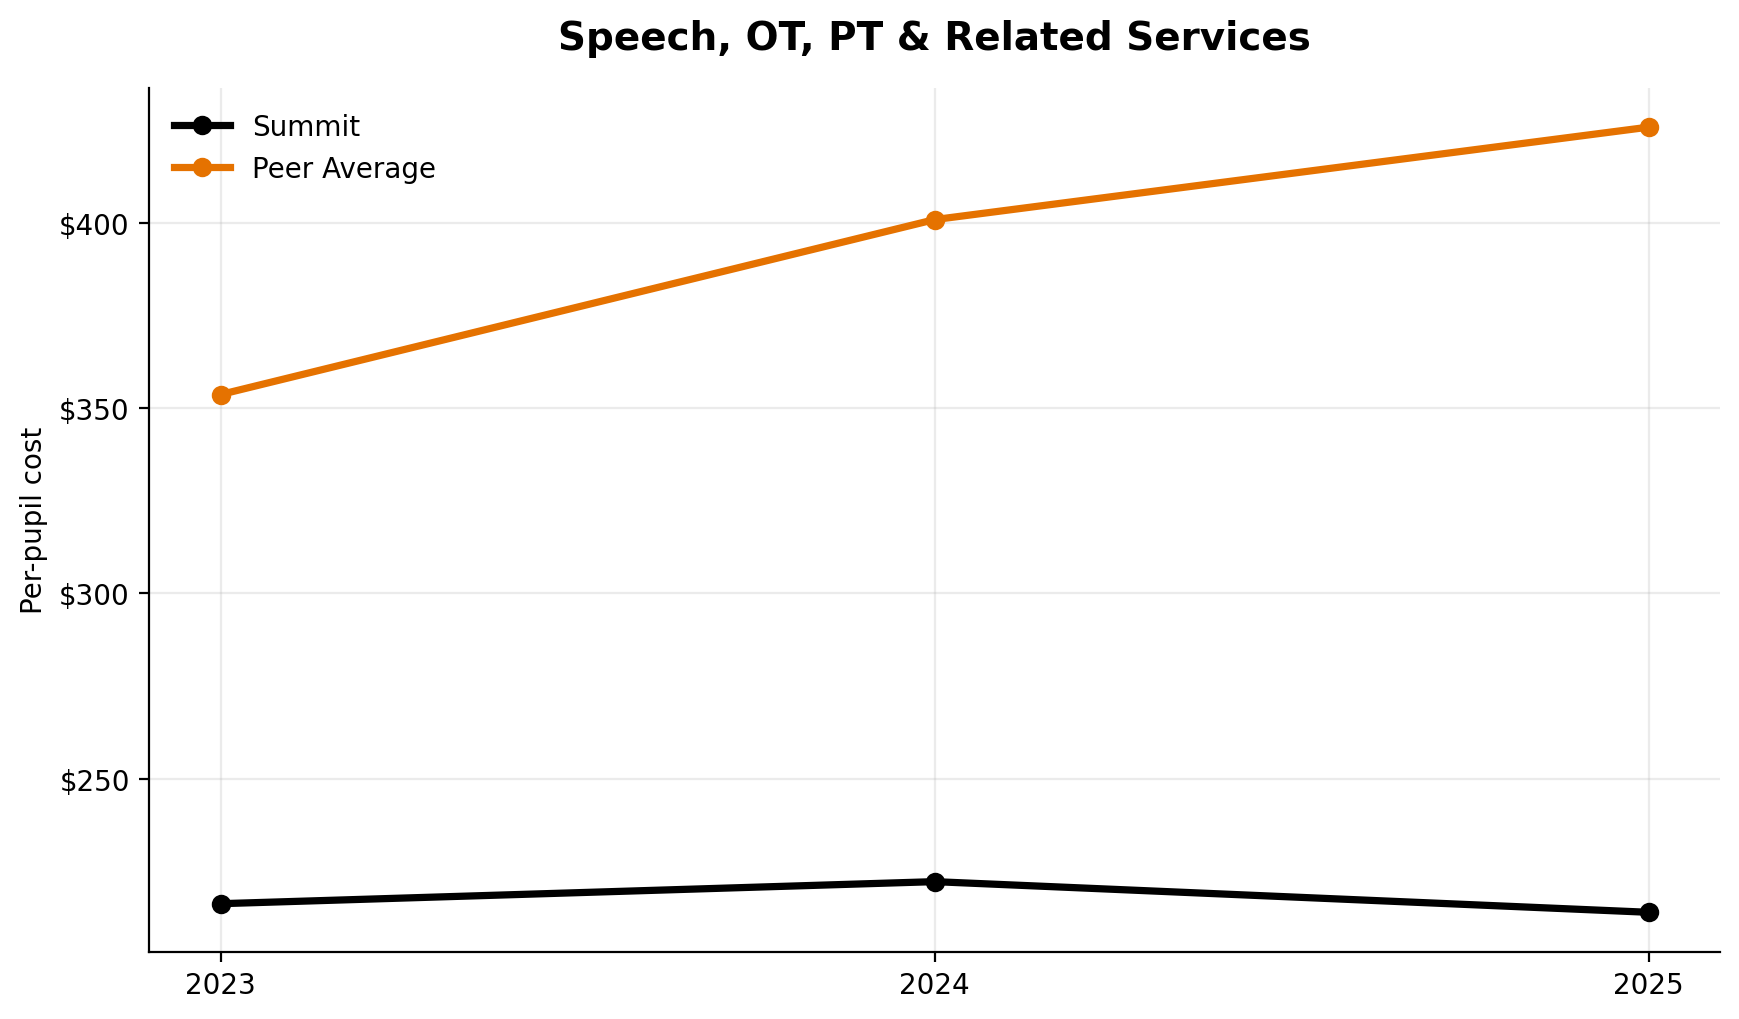
Speech, OT, PT & Related Services
Speech-related services rank 7th of 7.
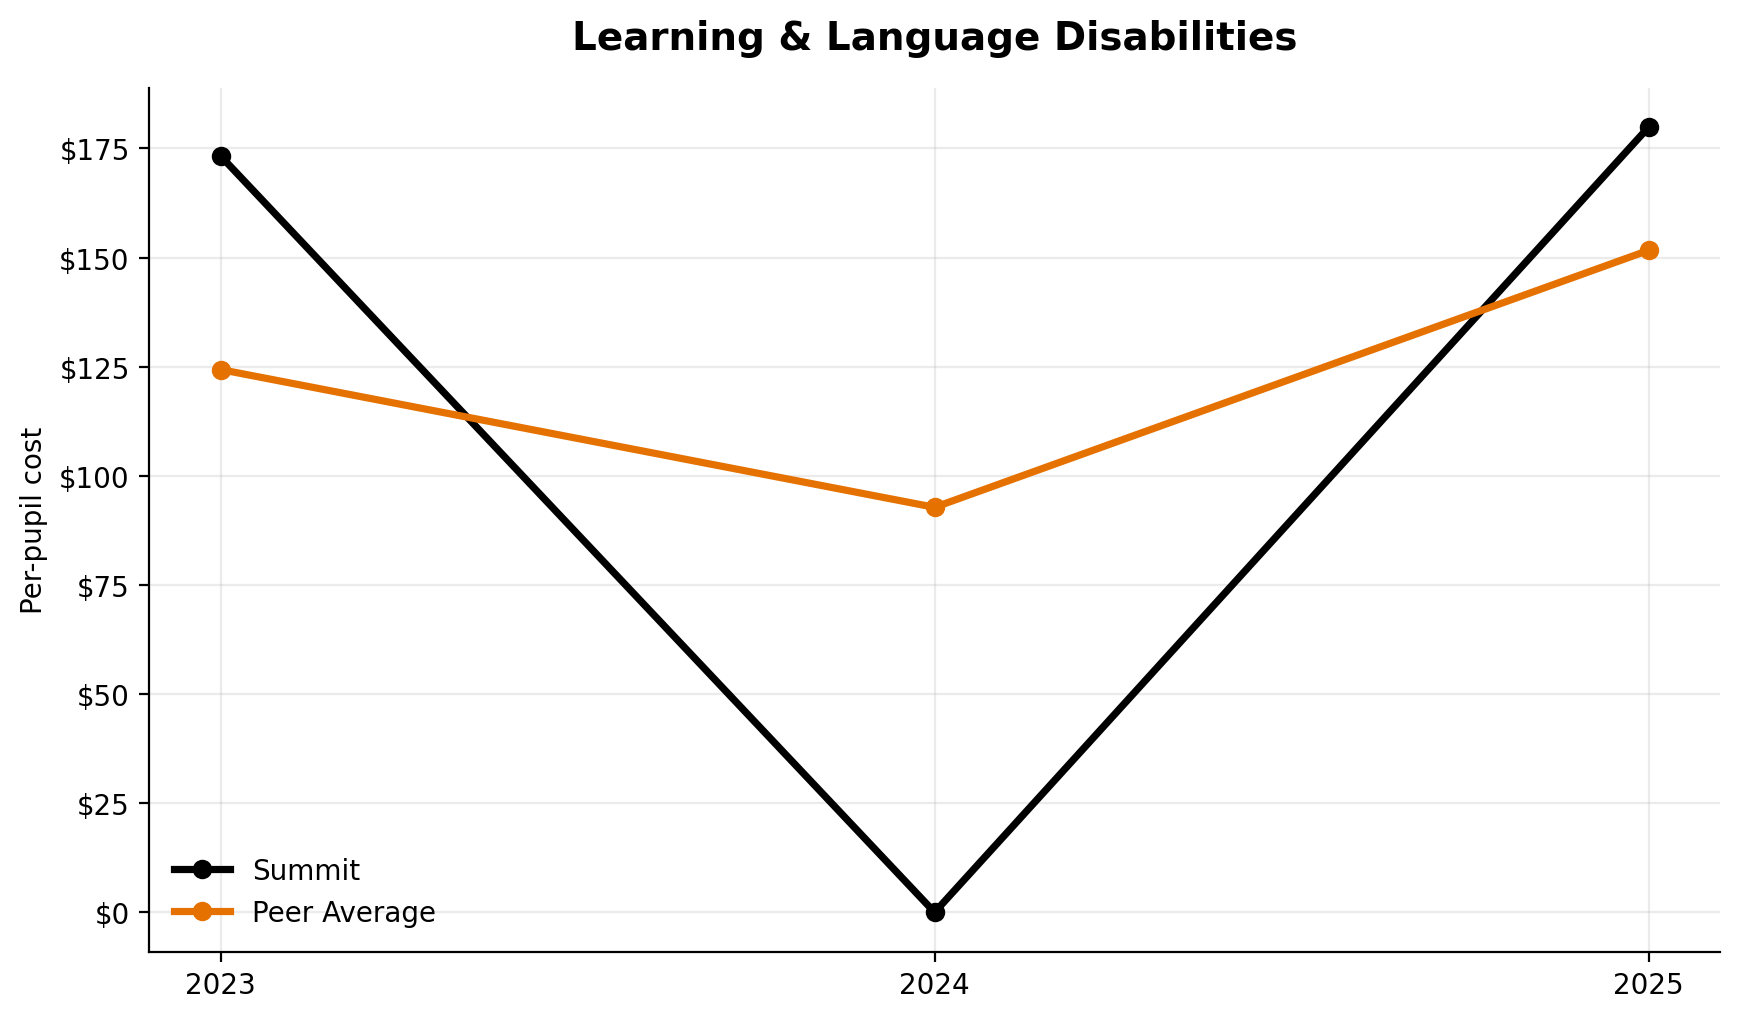
Learning & Language Disabilities
This category ranks 3rd of 7.
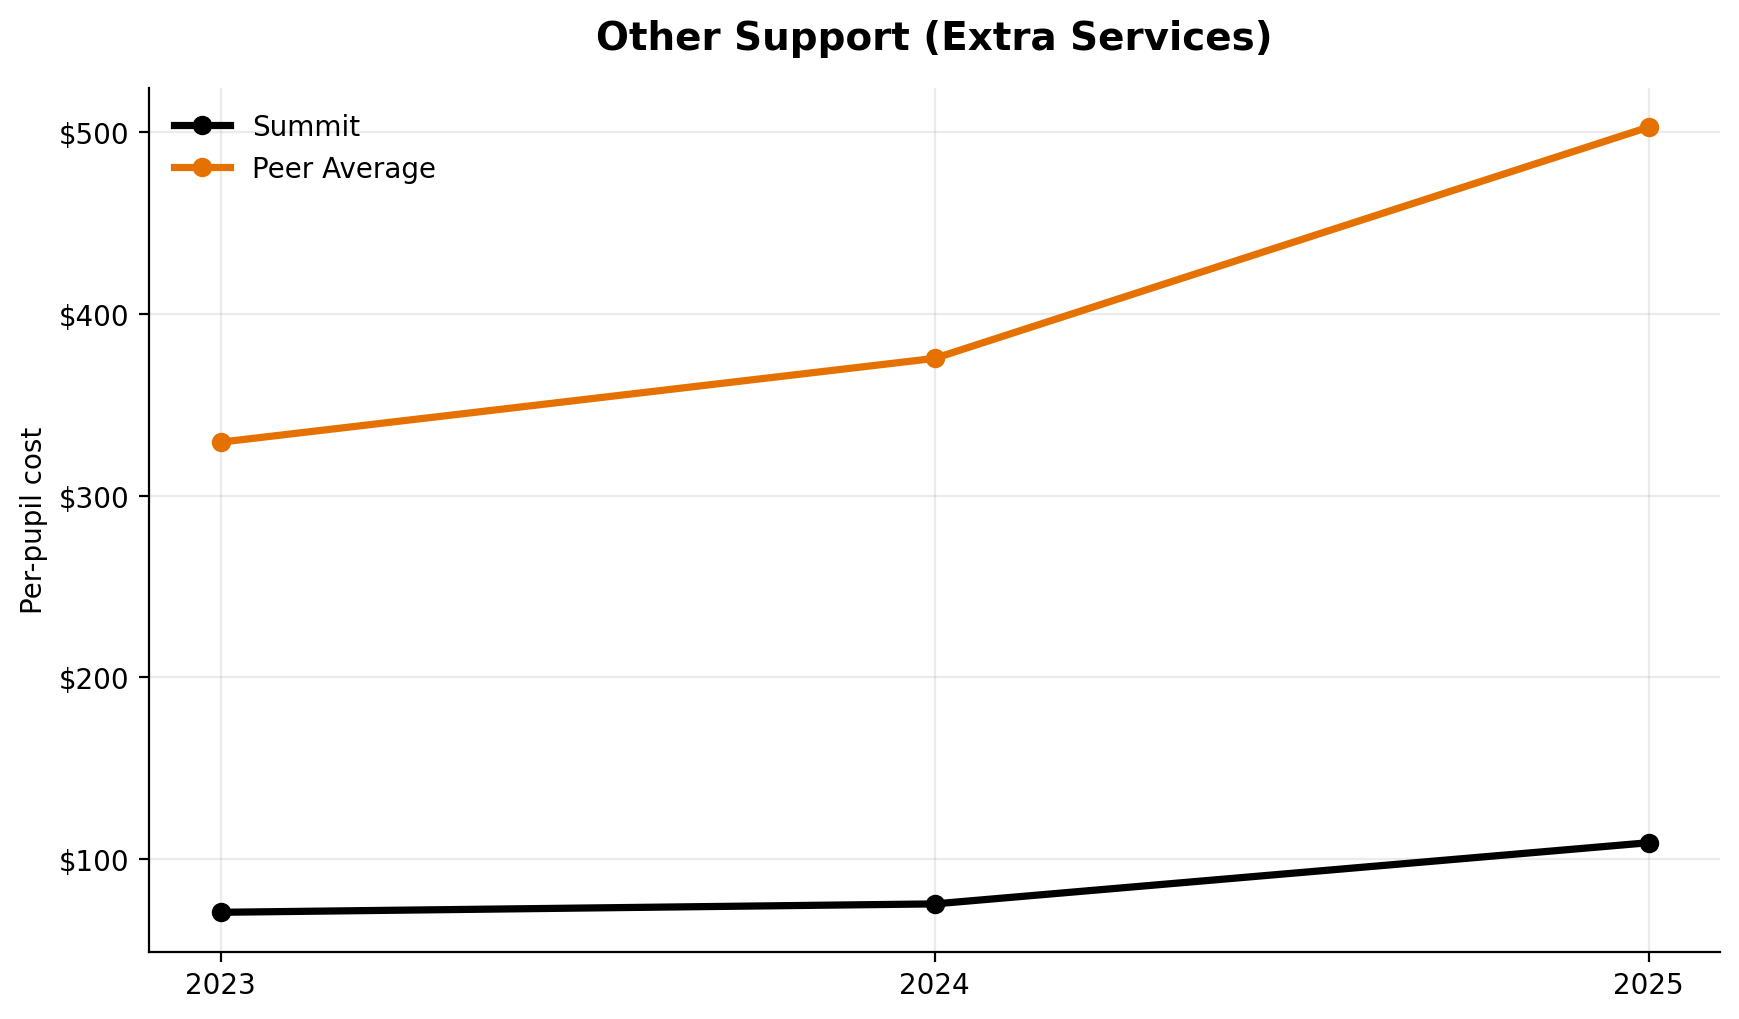
Other Support (Extra Services)
This category ranks 6th of 7.
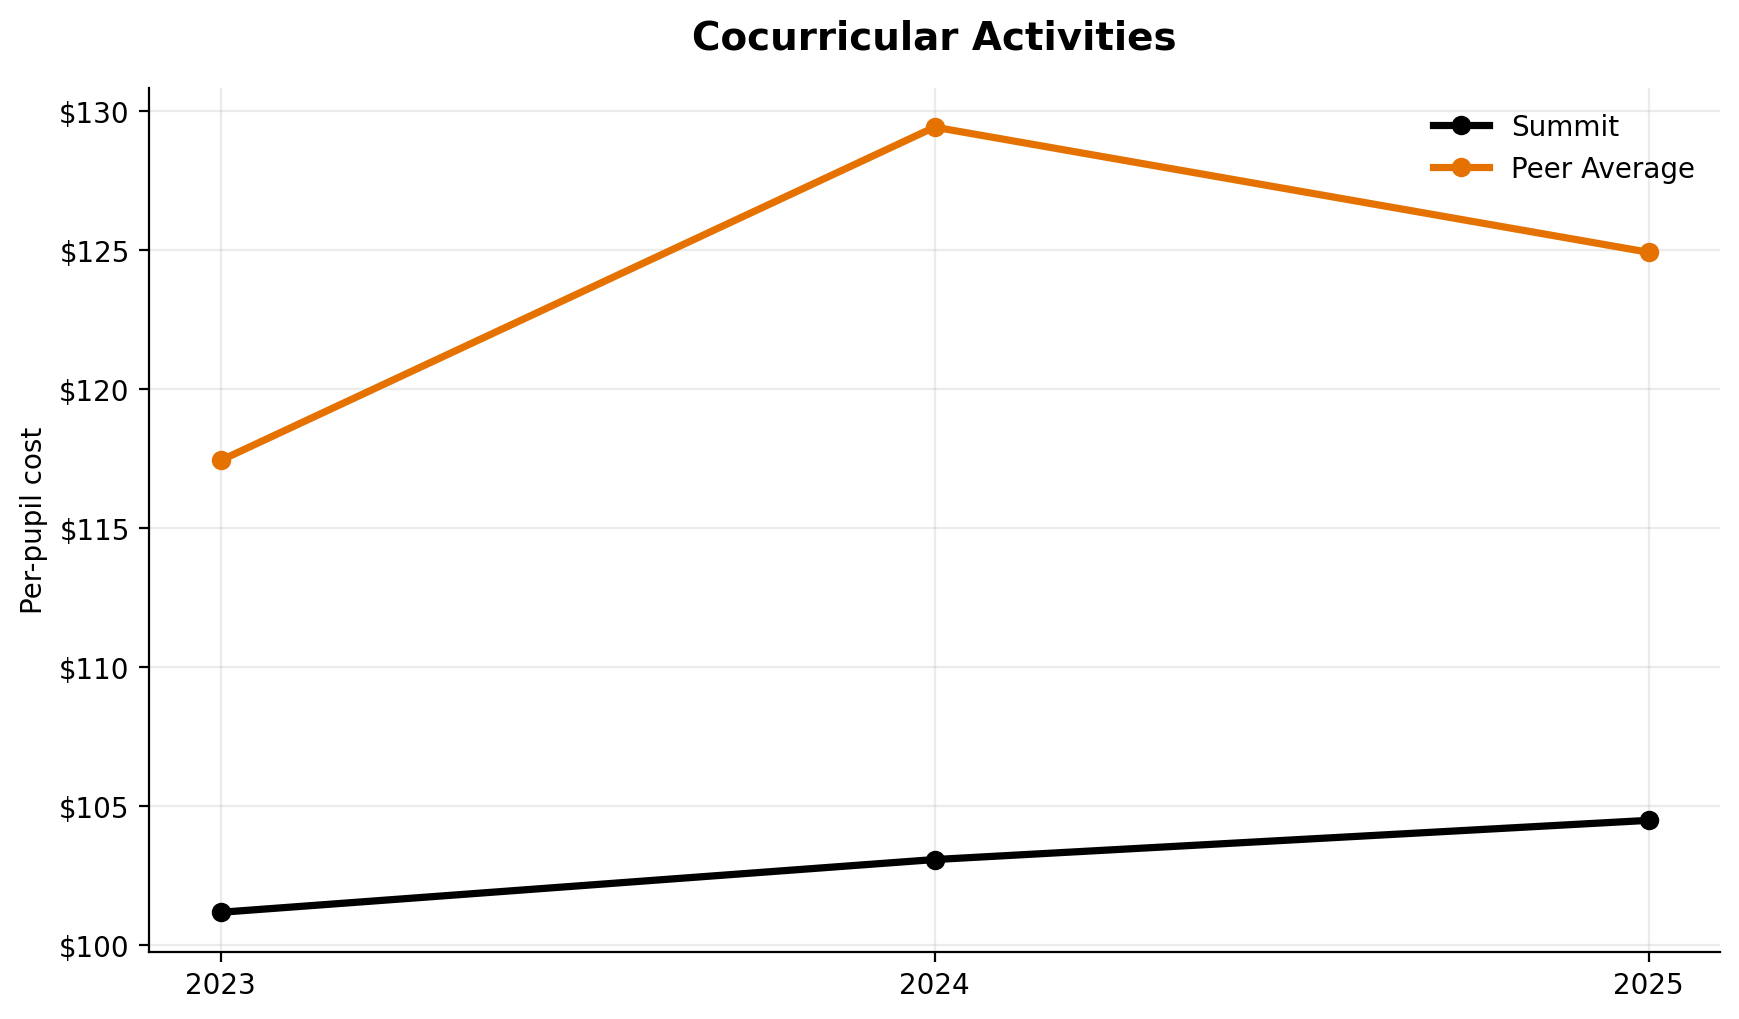
Cocurricular Activities
Cocurricular activities rank 6th of 7.
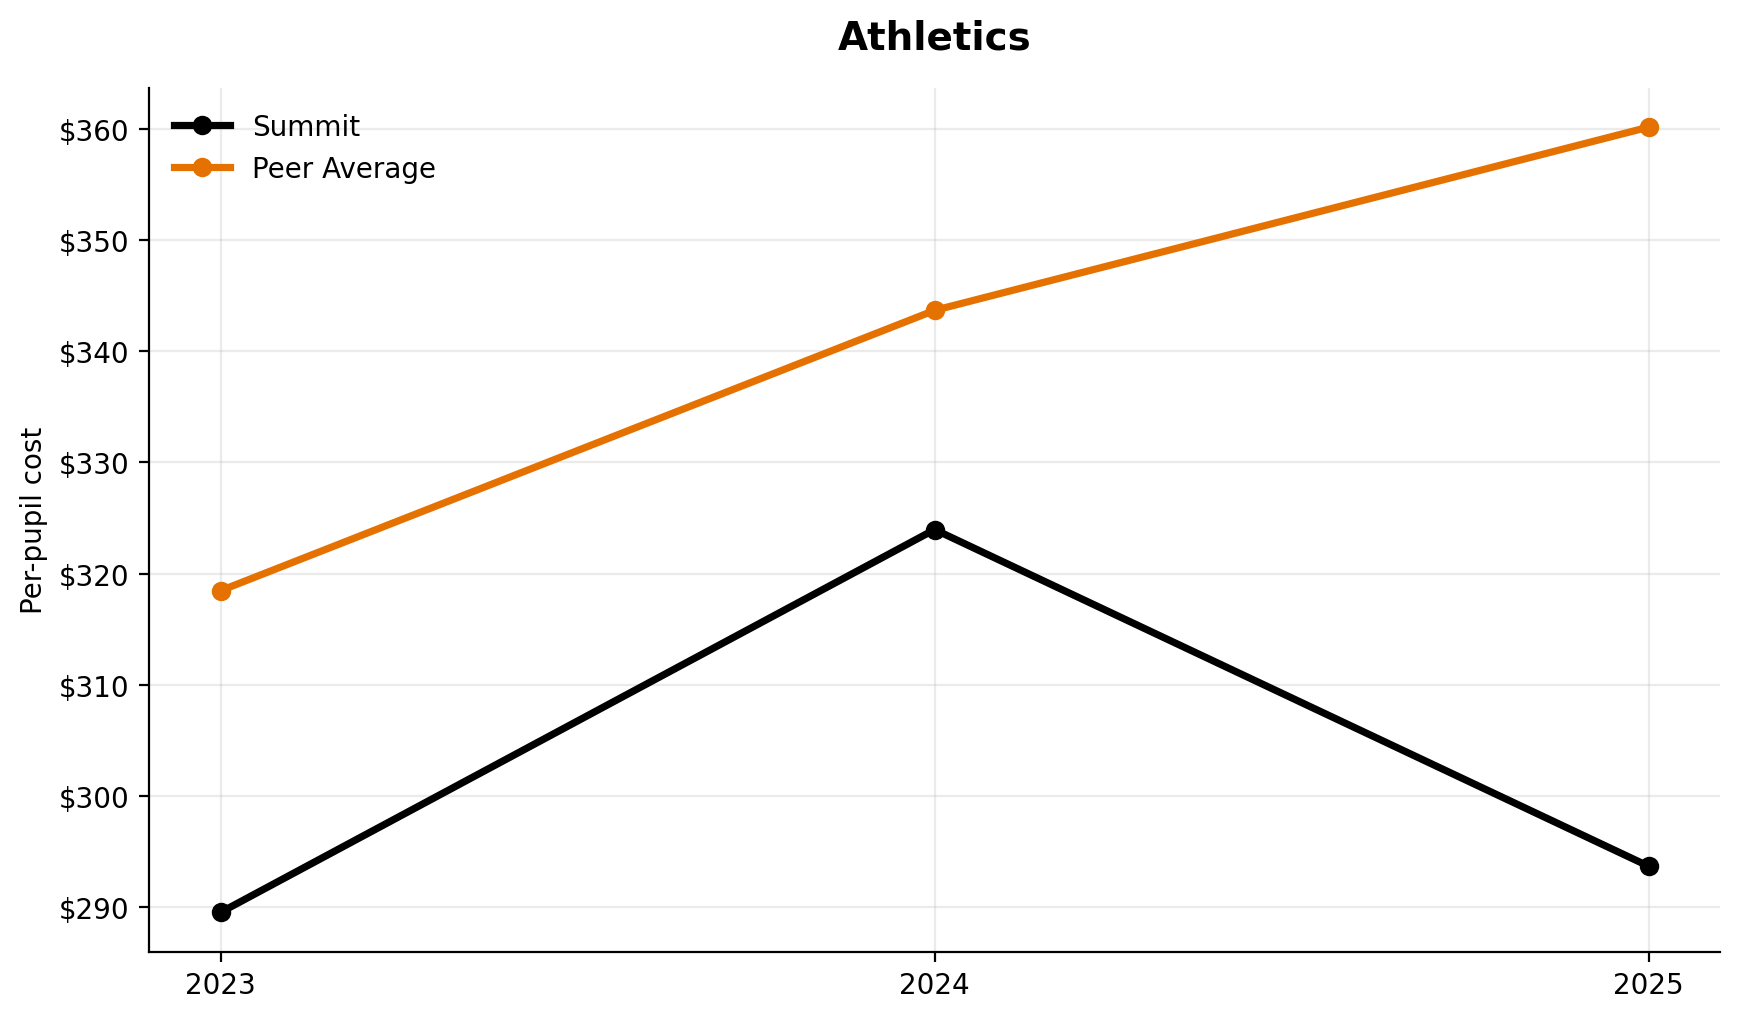
Athletics
Athletics ranks 5th of 7 among peers.
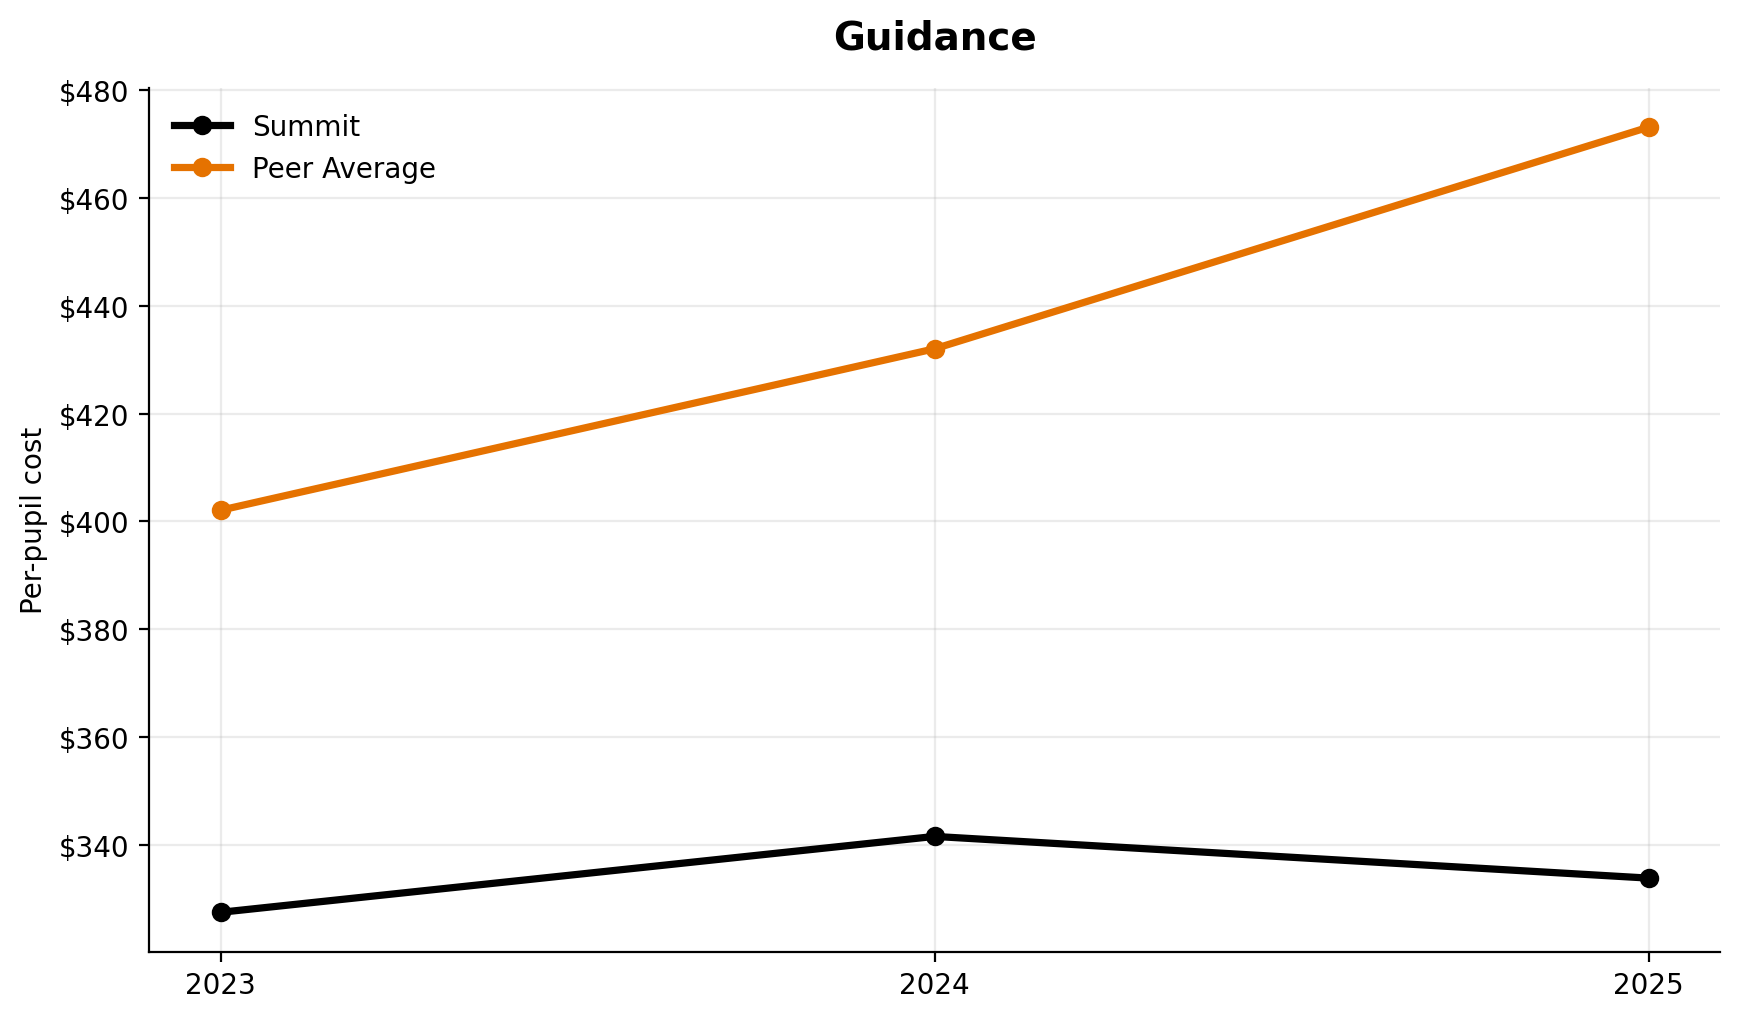
Guidance
Guidance spending ranks 7th of 7.
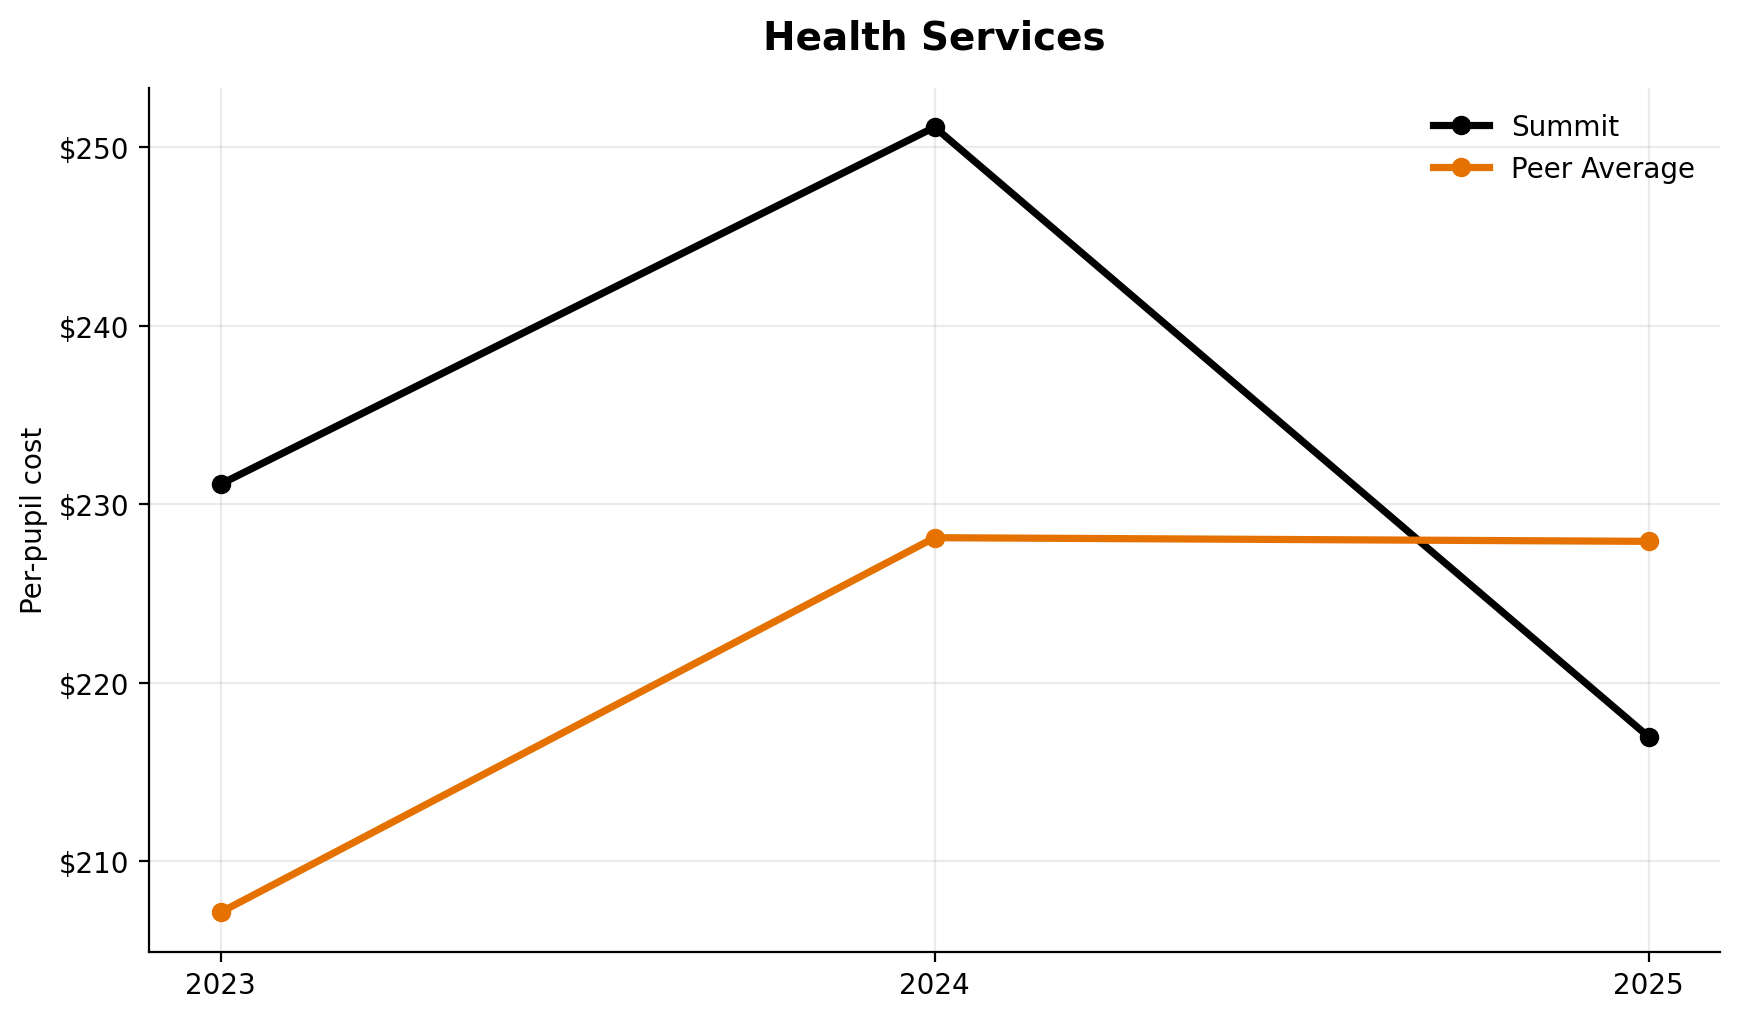
Health Services
Health services rank 5th of 7.
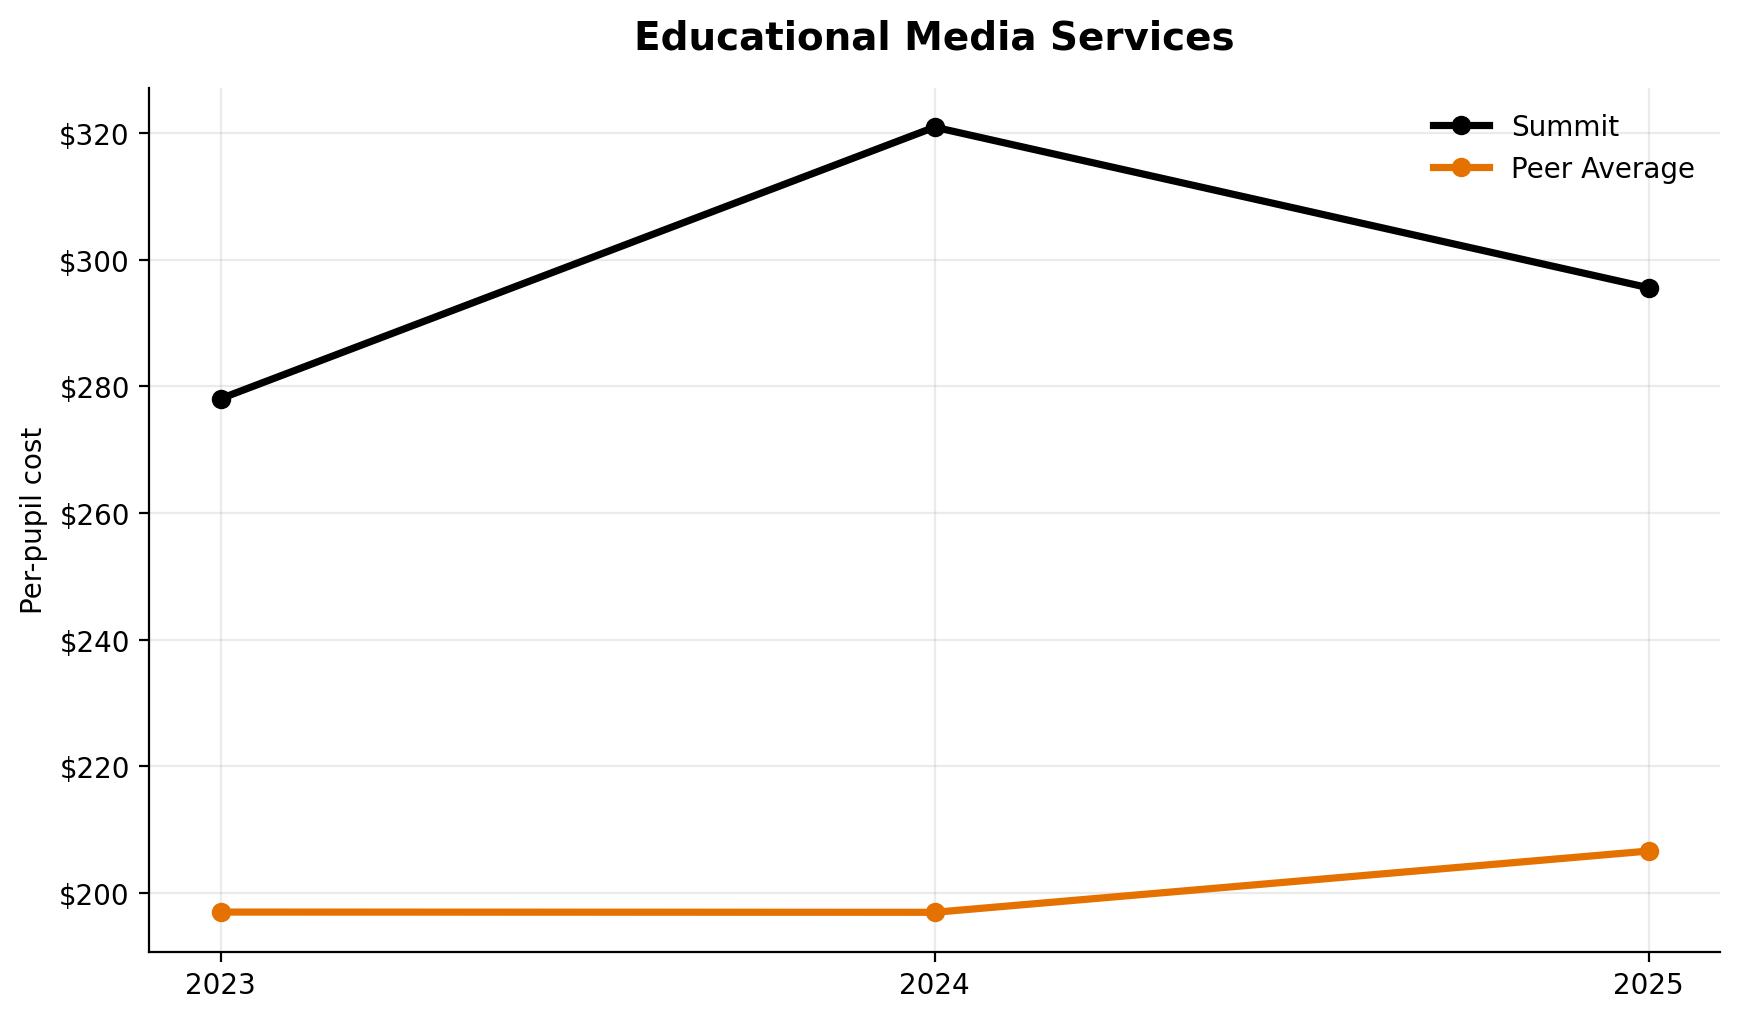
Educational Media Services
Library/media spending ranks 1st of 7, another category that should be read as a cost choice to explain.
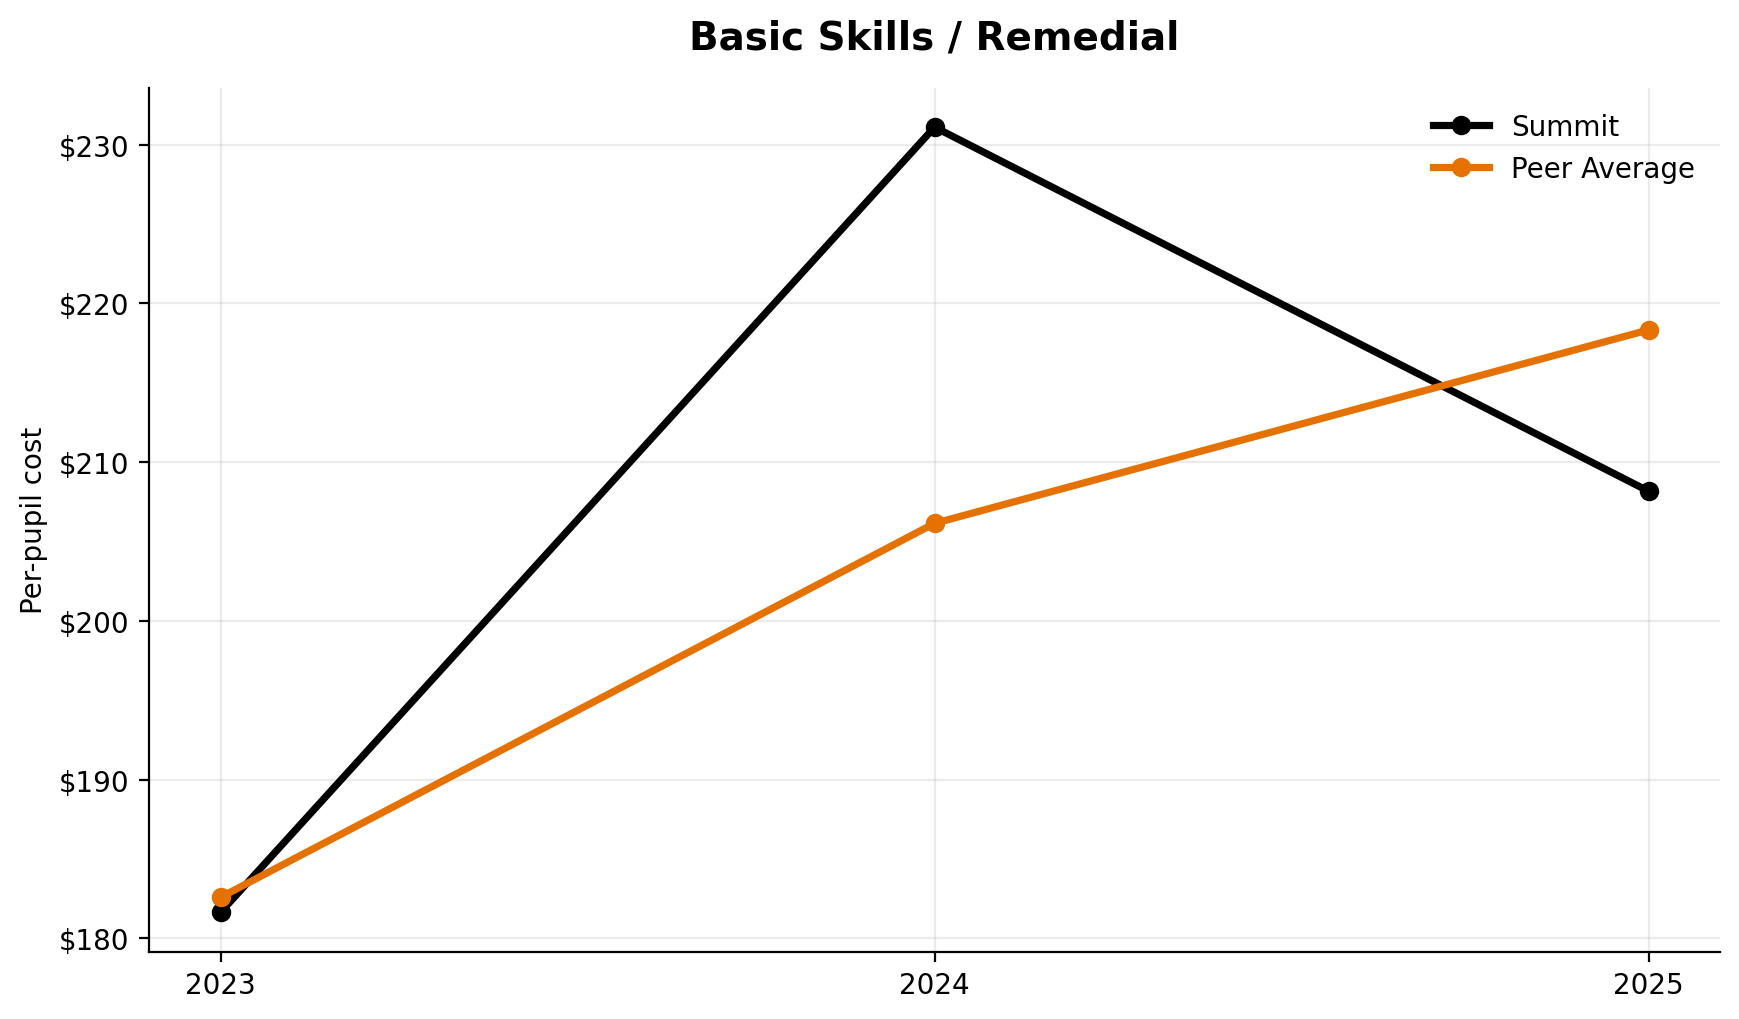
Basic Skills / Remedial
Basic skills/remedial ranks 4th of 7.
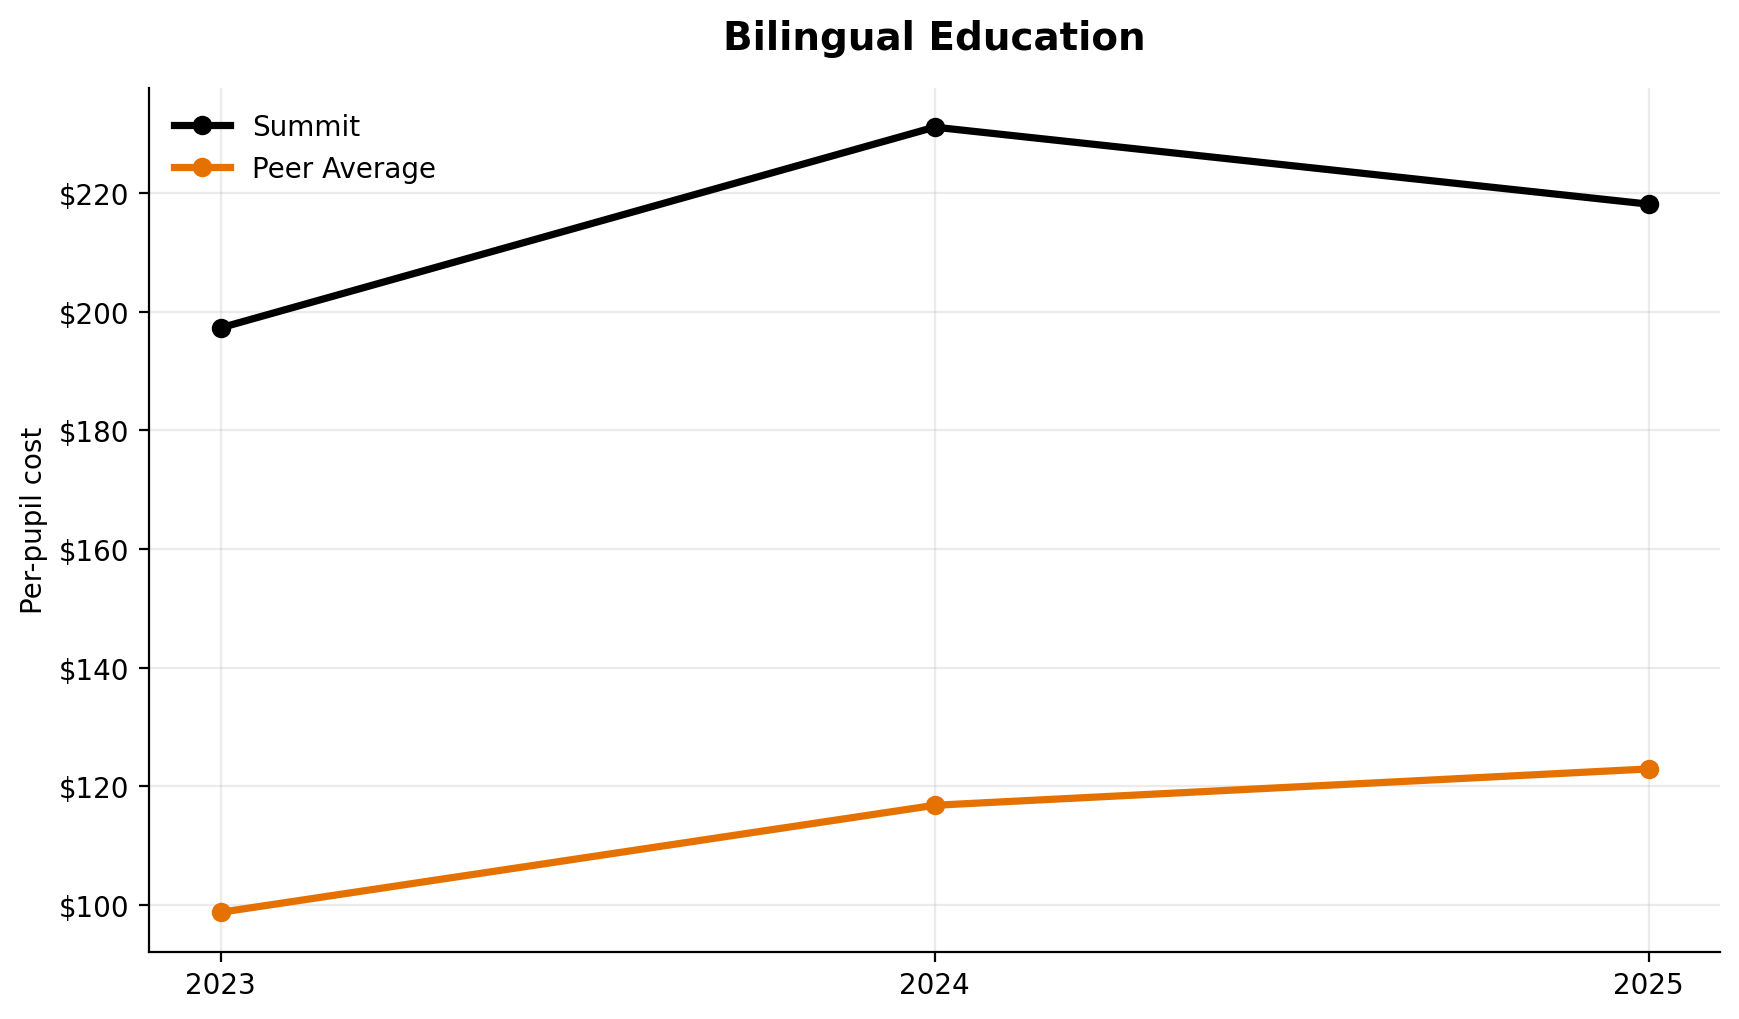
Bilingual Education
Bilingual education ranks 1st of 7 and should be evaluated in light of actual student need and program design.
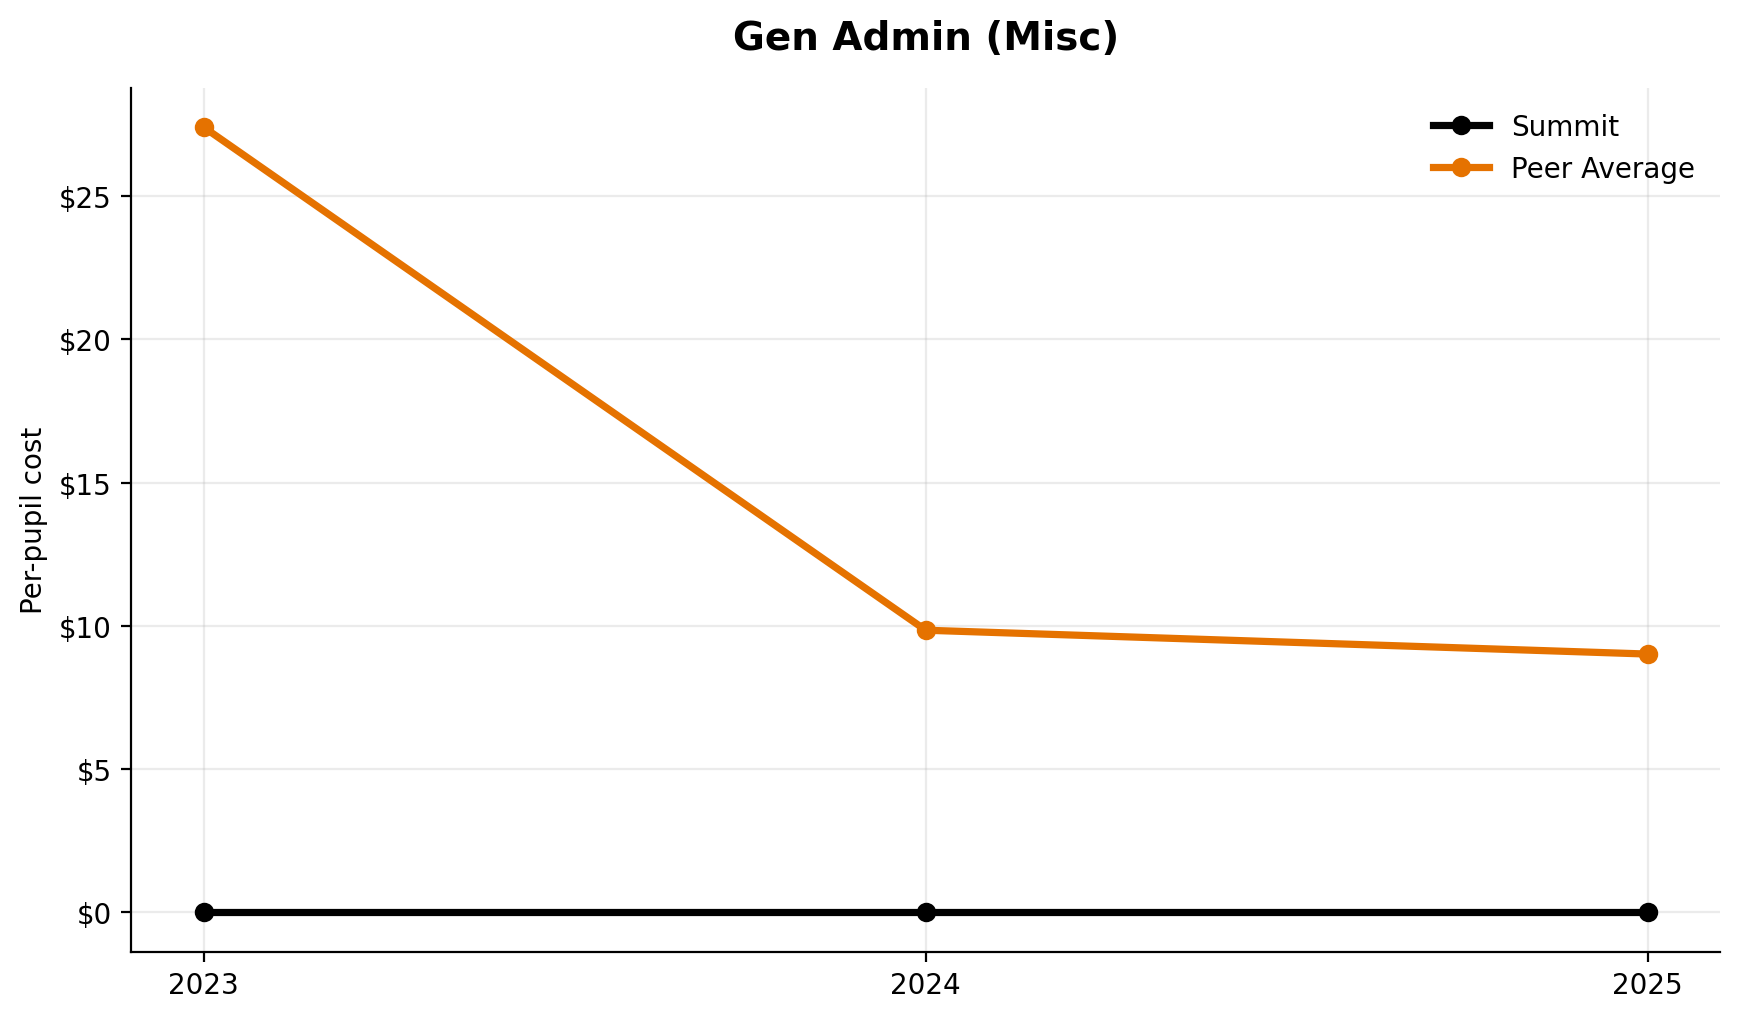
Gen Admin (Misc)
This line item ranks 6th of 7.
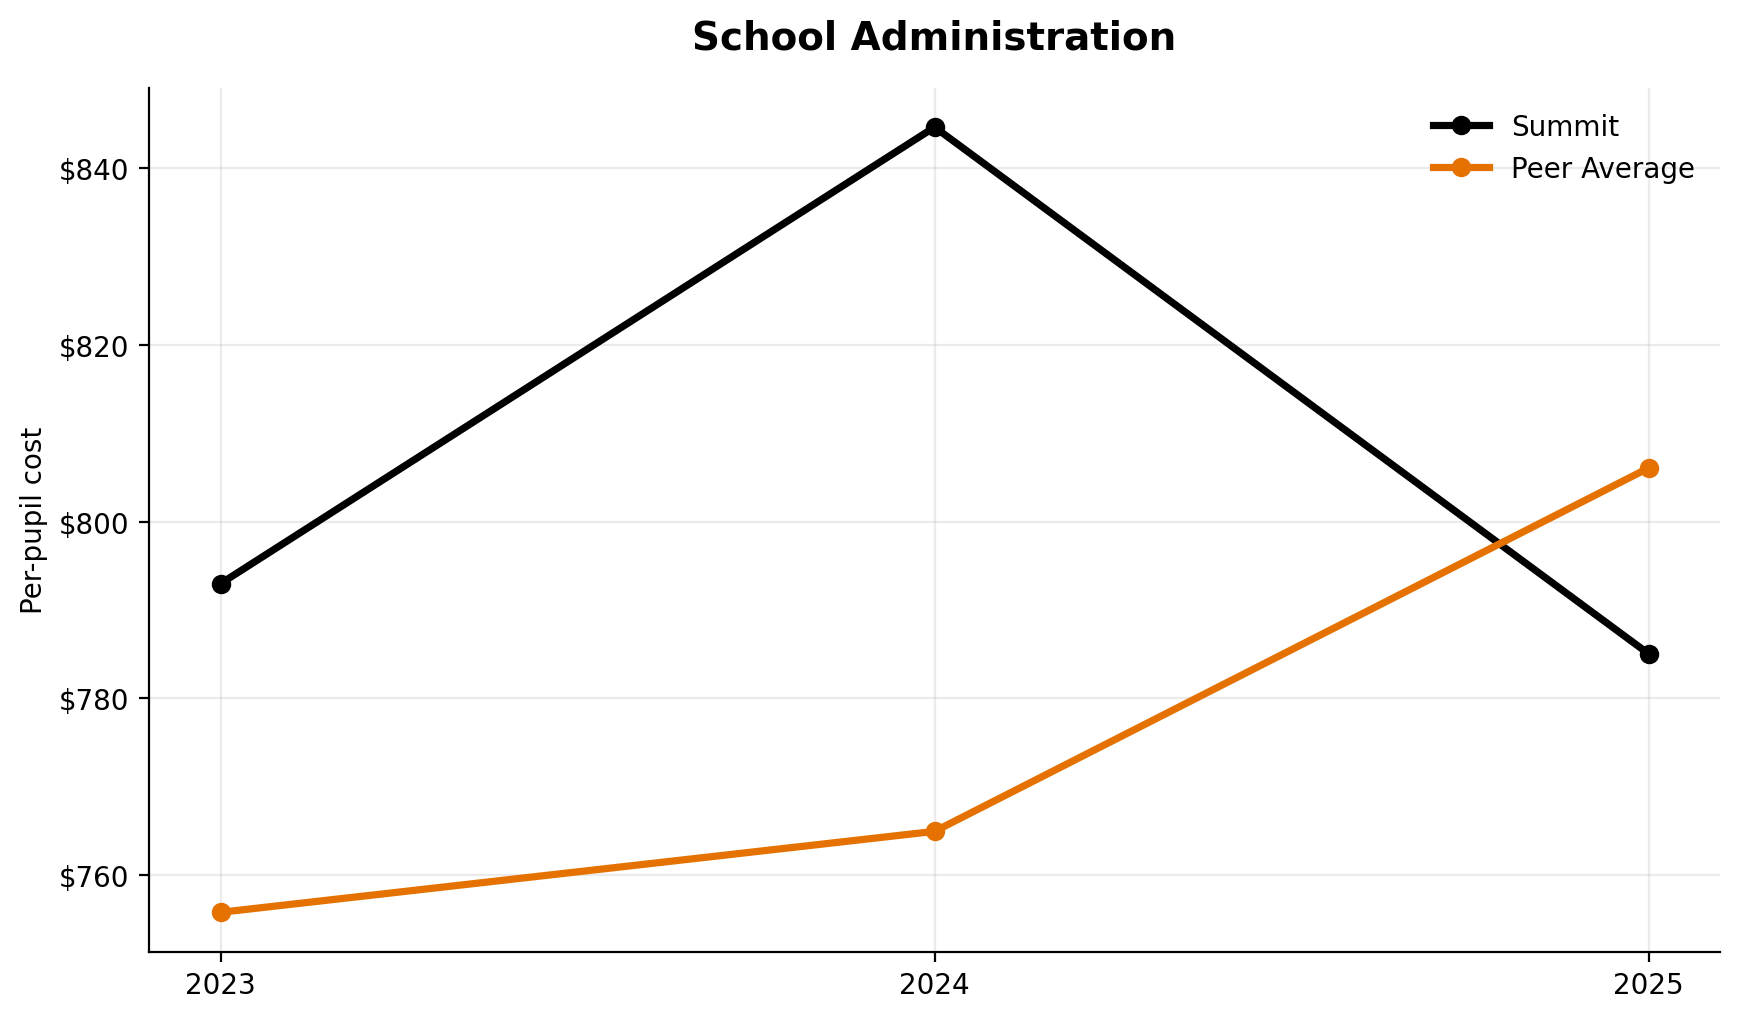
School Administration
School administration ranks 4th of 7.
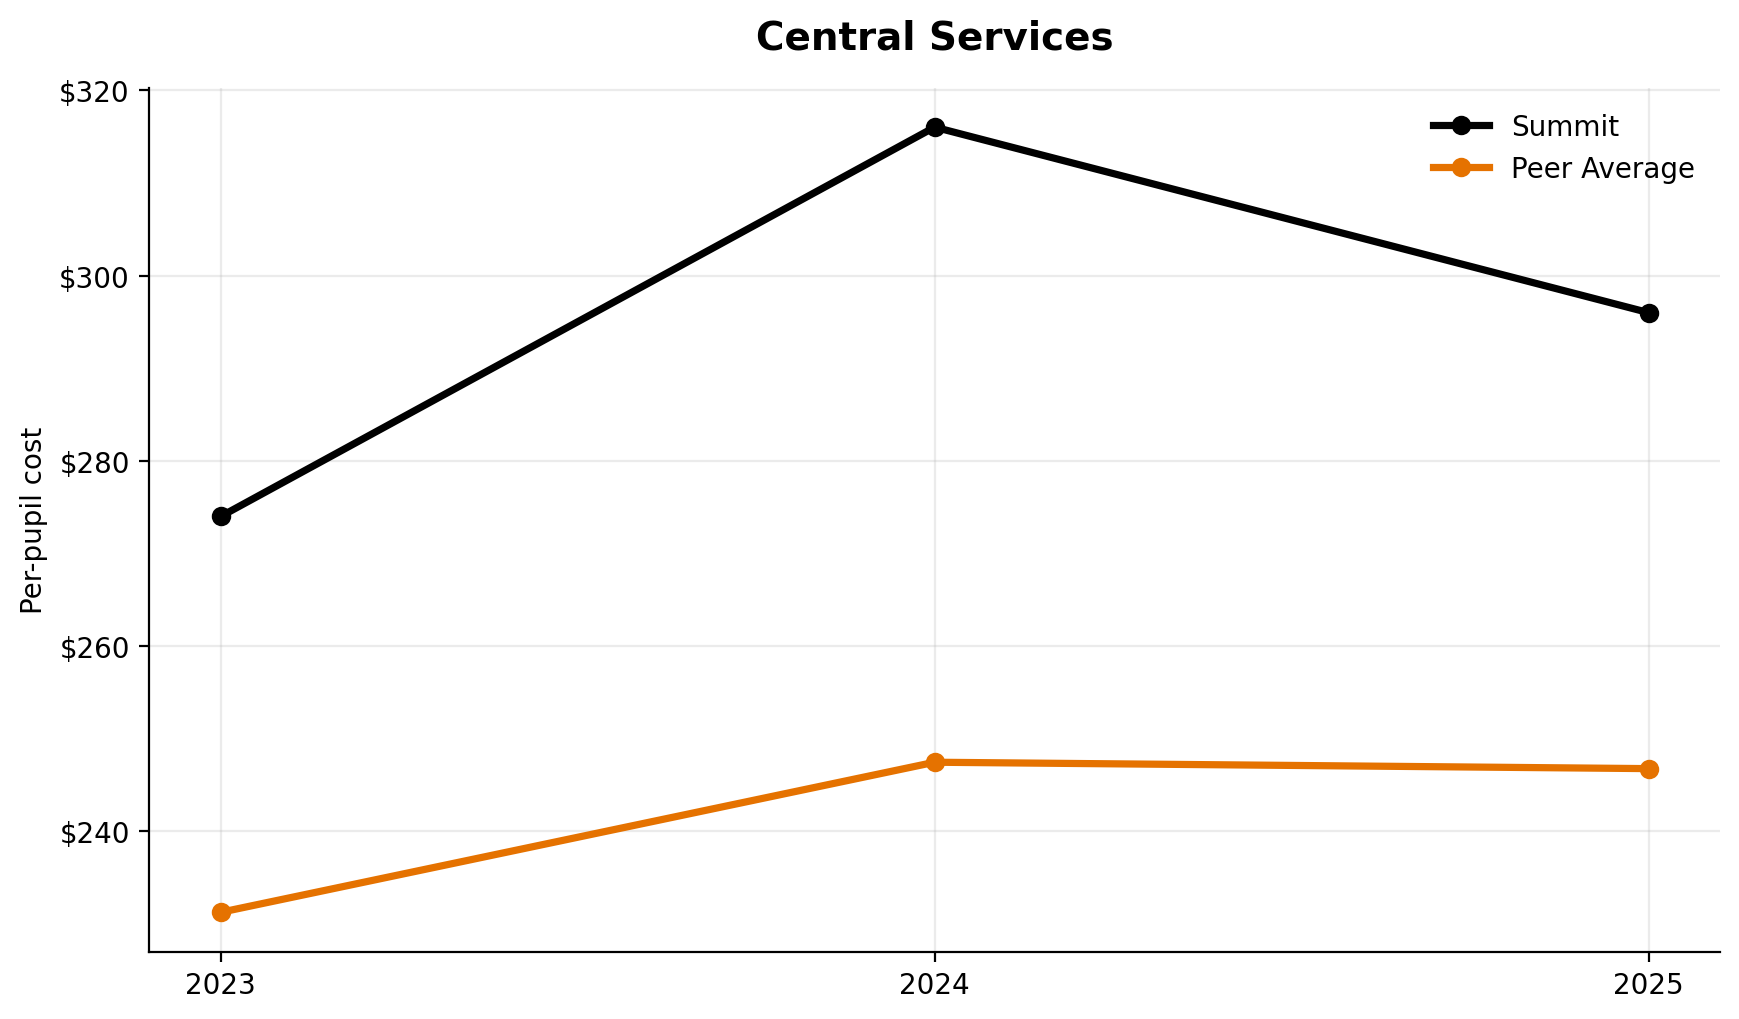
Central Services
Central services rank 1st of 7, which should prompt questions about what is being coded there and why.
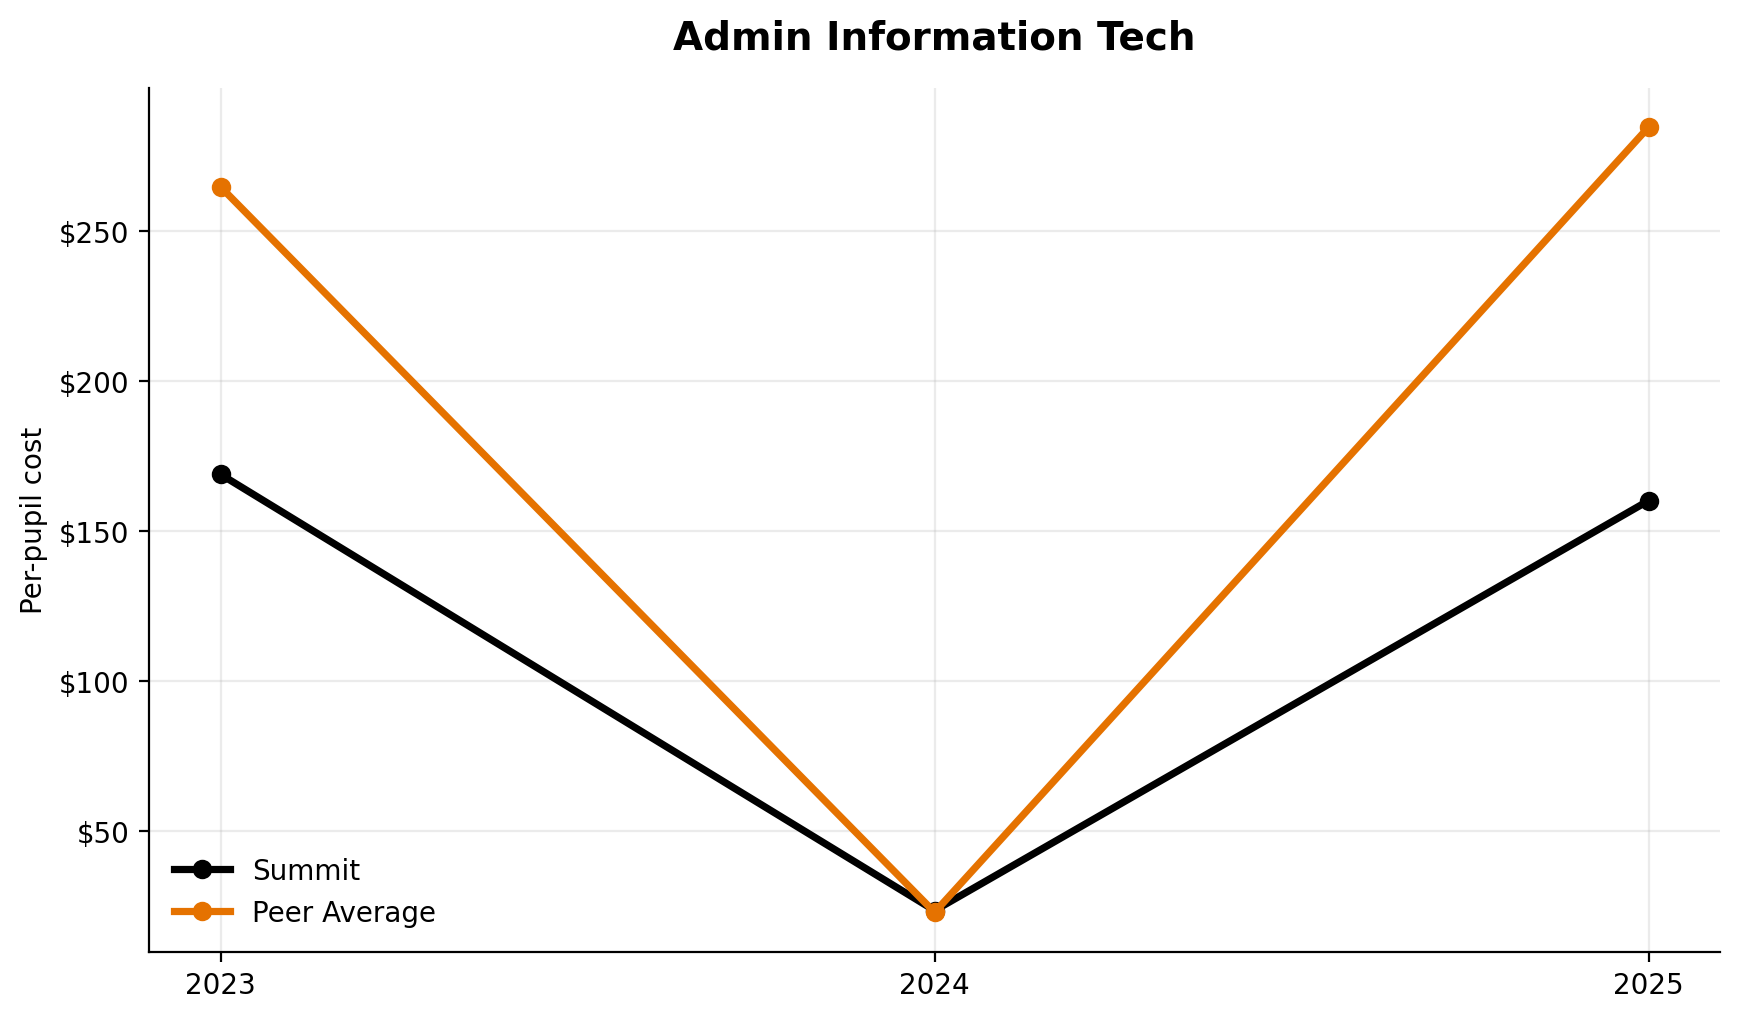
Admin Information Tech
Administrative information technology ranks 7th of 7.
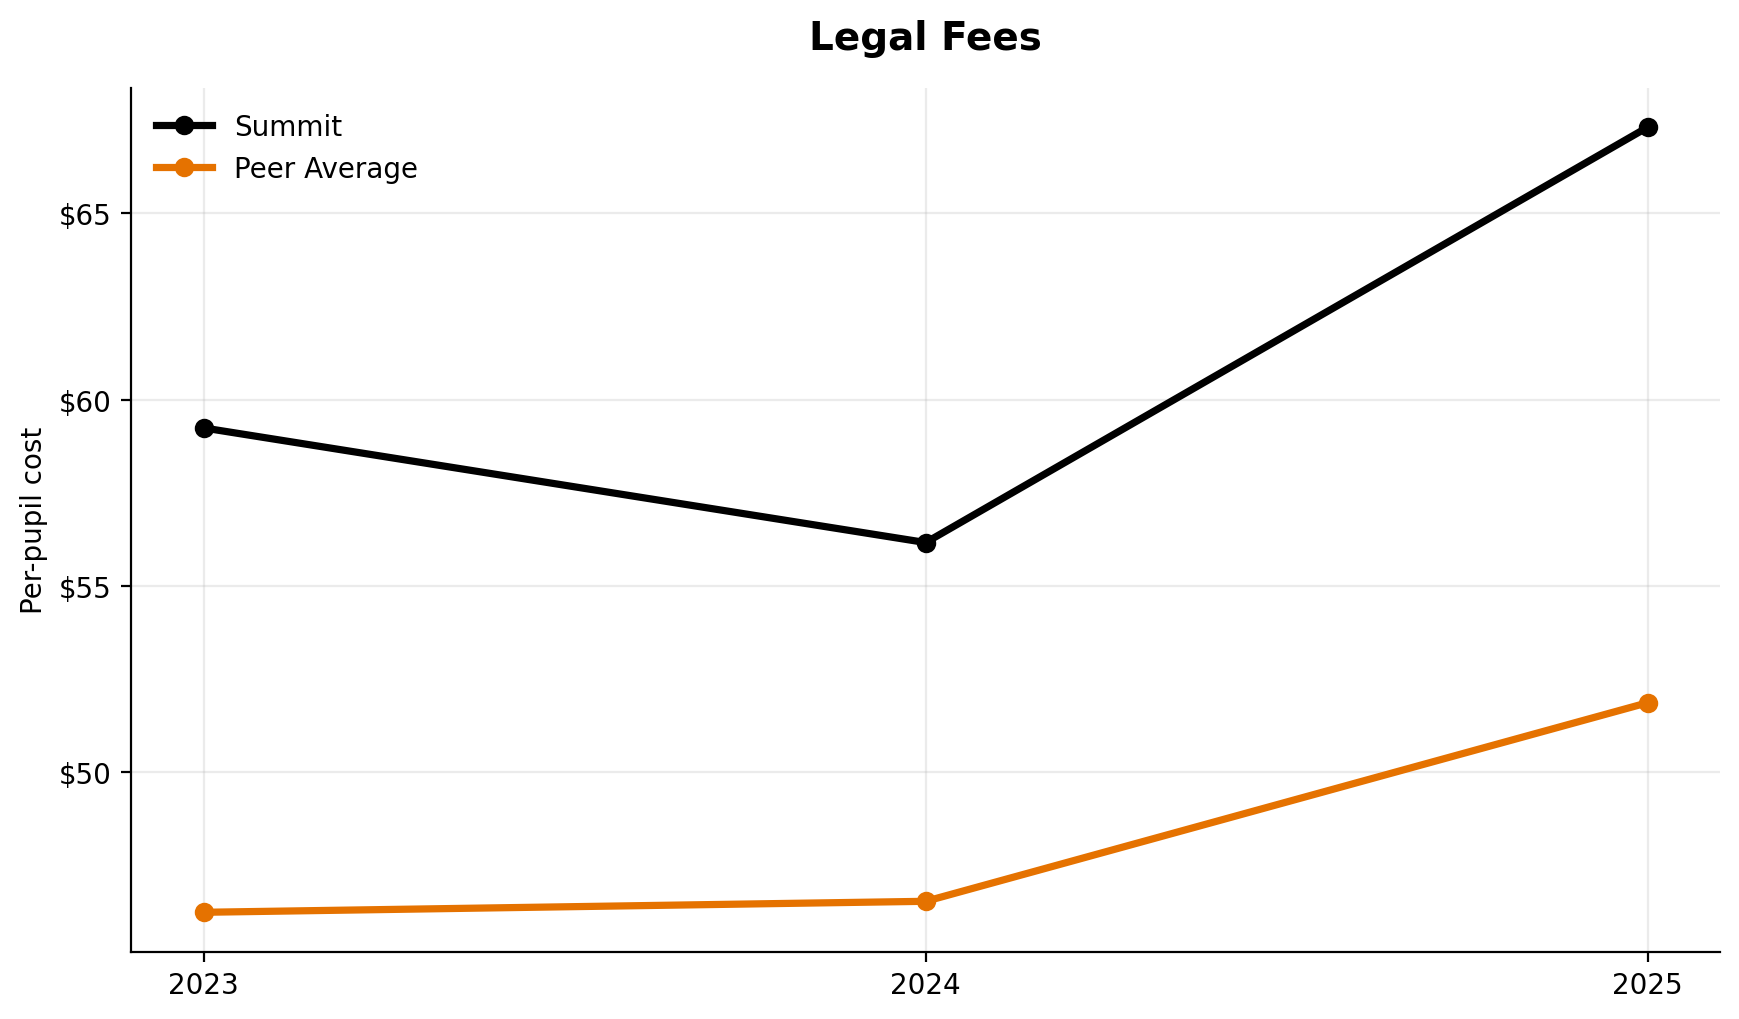
Legal Fees
Legal fees rank 3rd of 7.
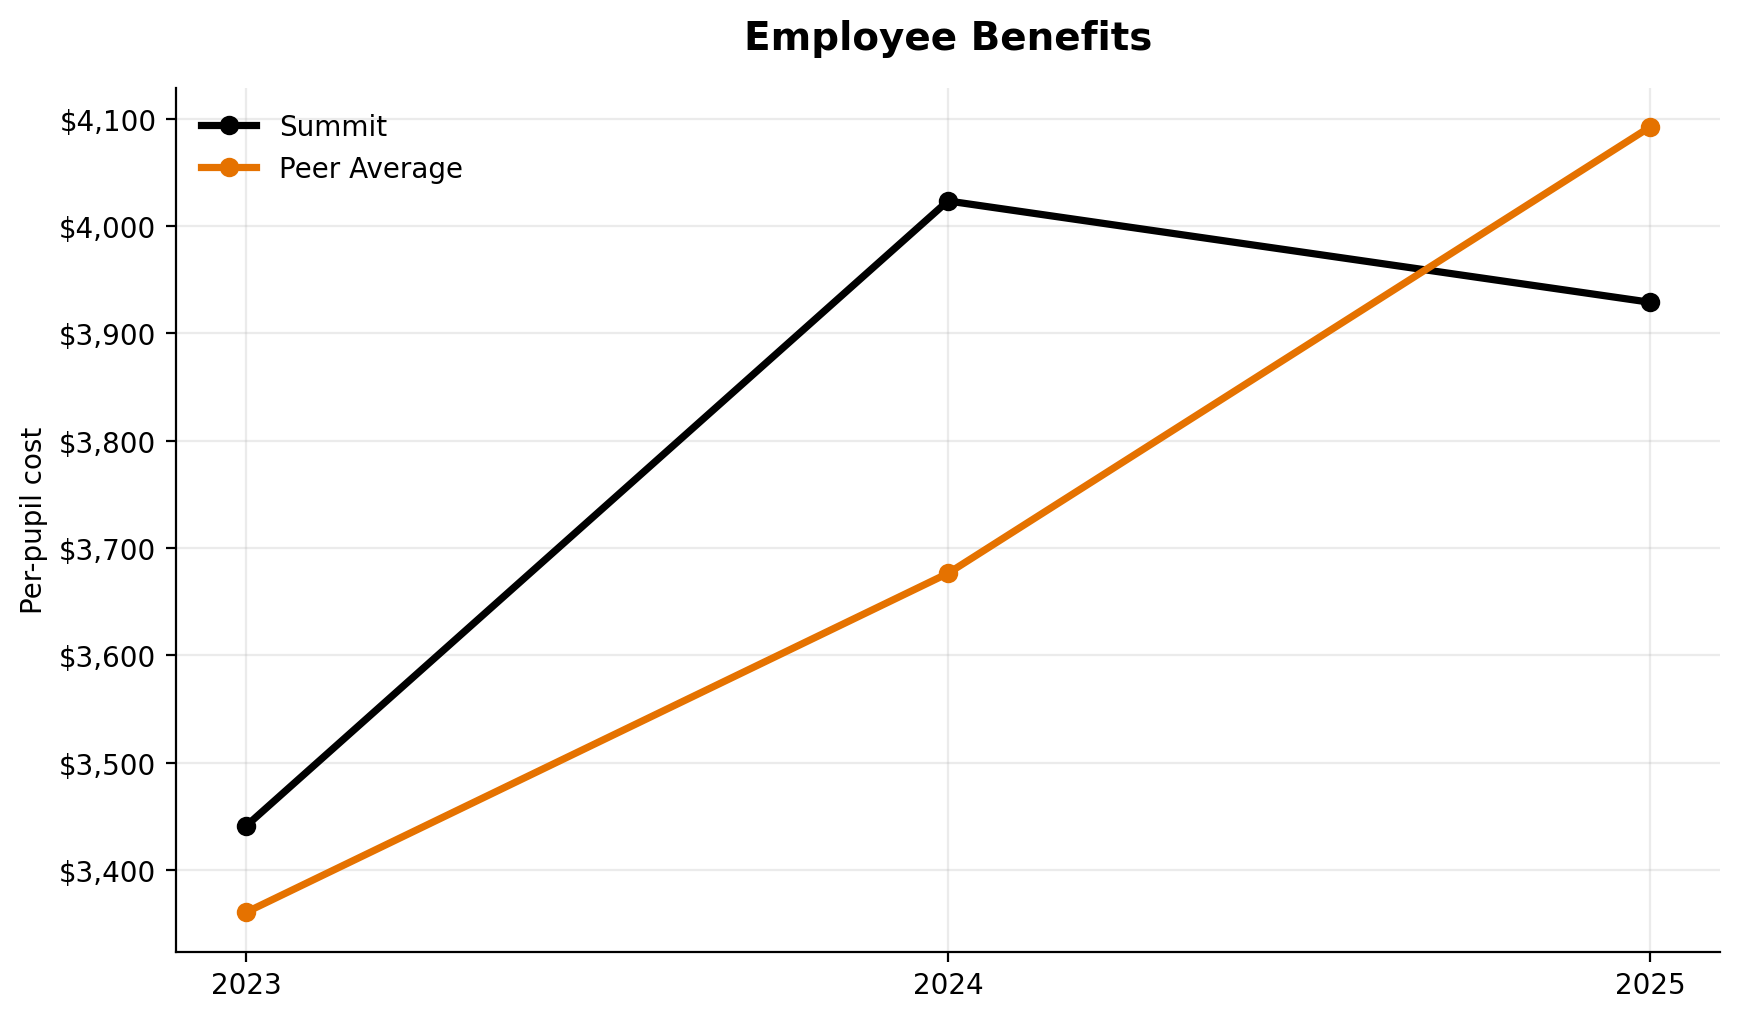
Employee Benefits
Employee benefits rank 4th of 7.
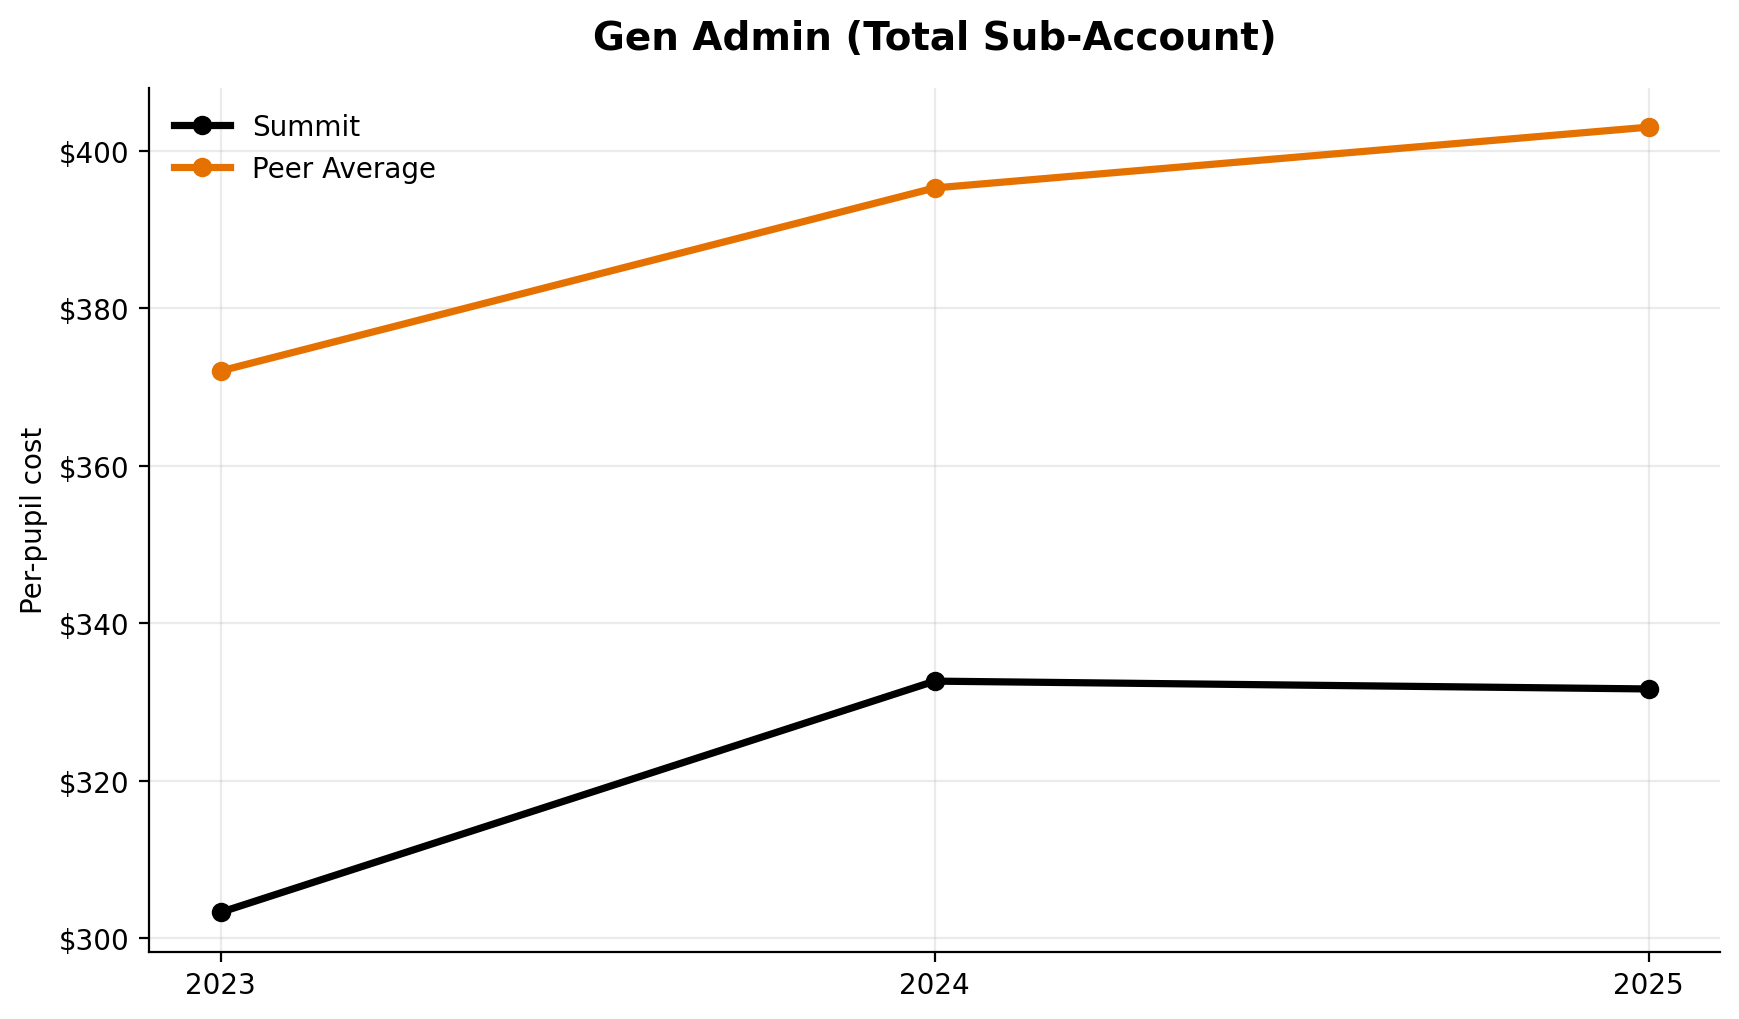
Gen Admin (Total Sub-Account)
This broader admin bucket ranks 6th of 7.
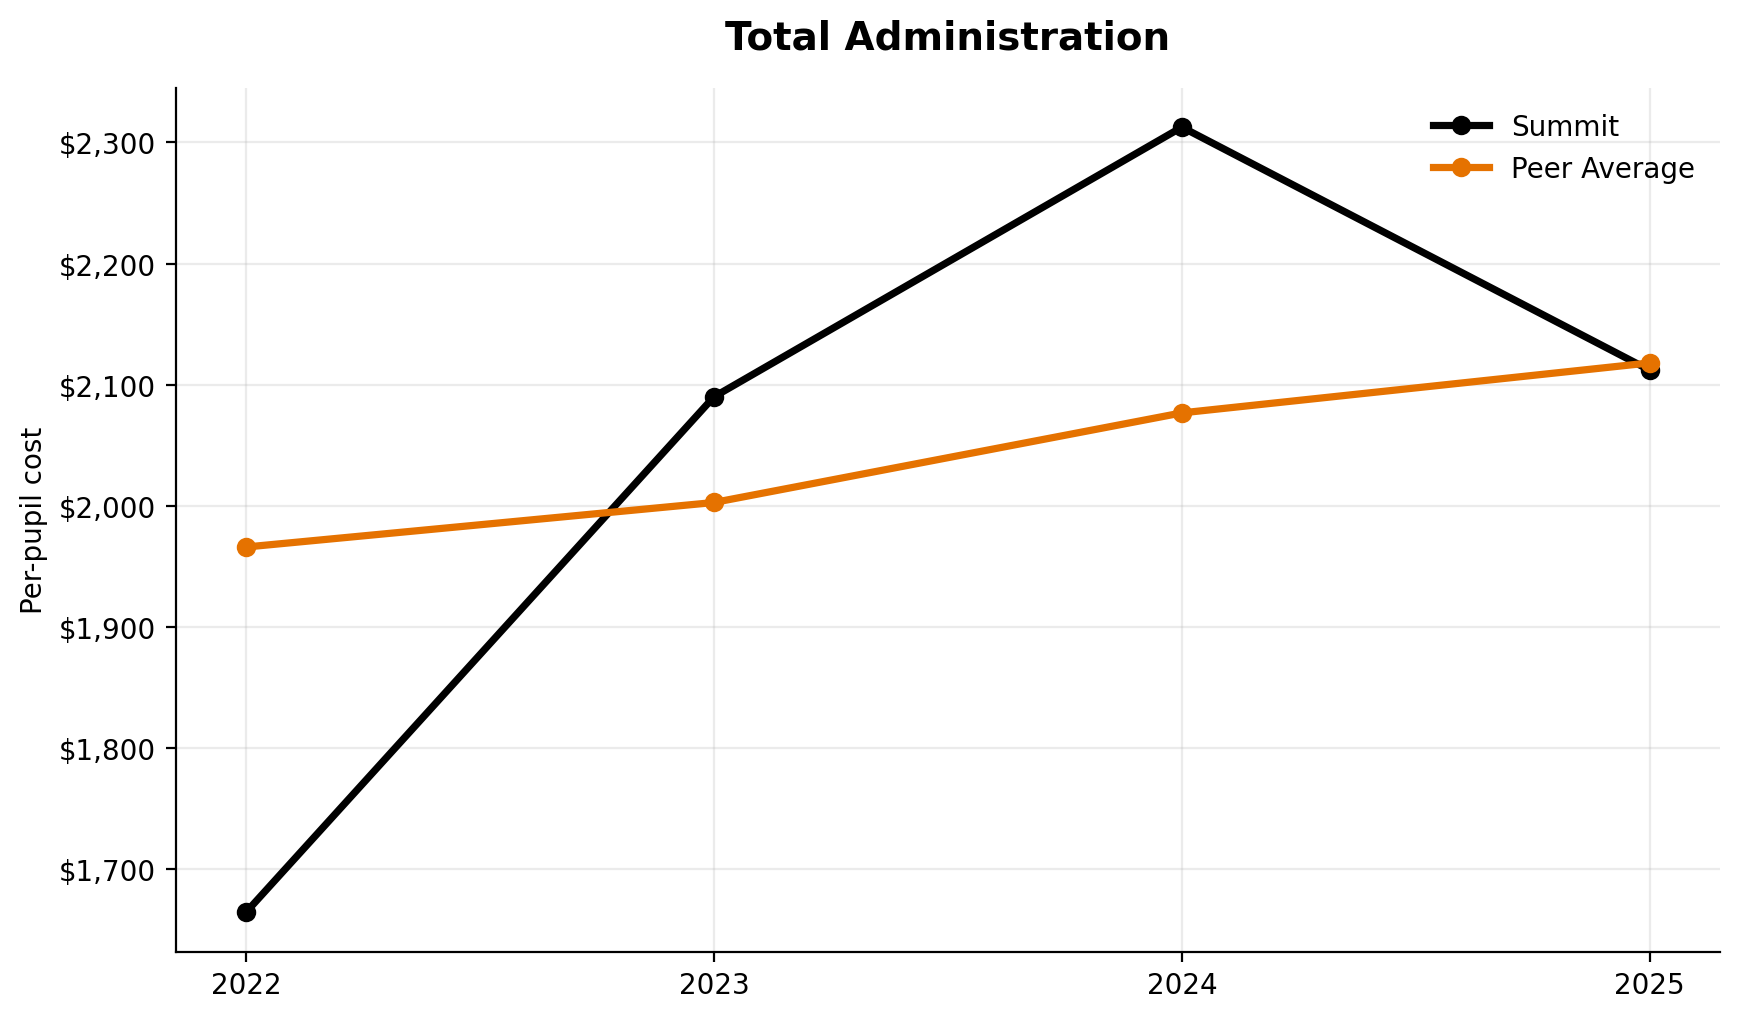
Total Administration
Total administration ranks 6th of 7 overall.
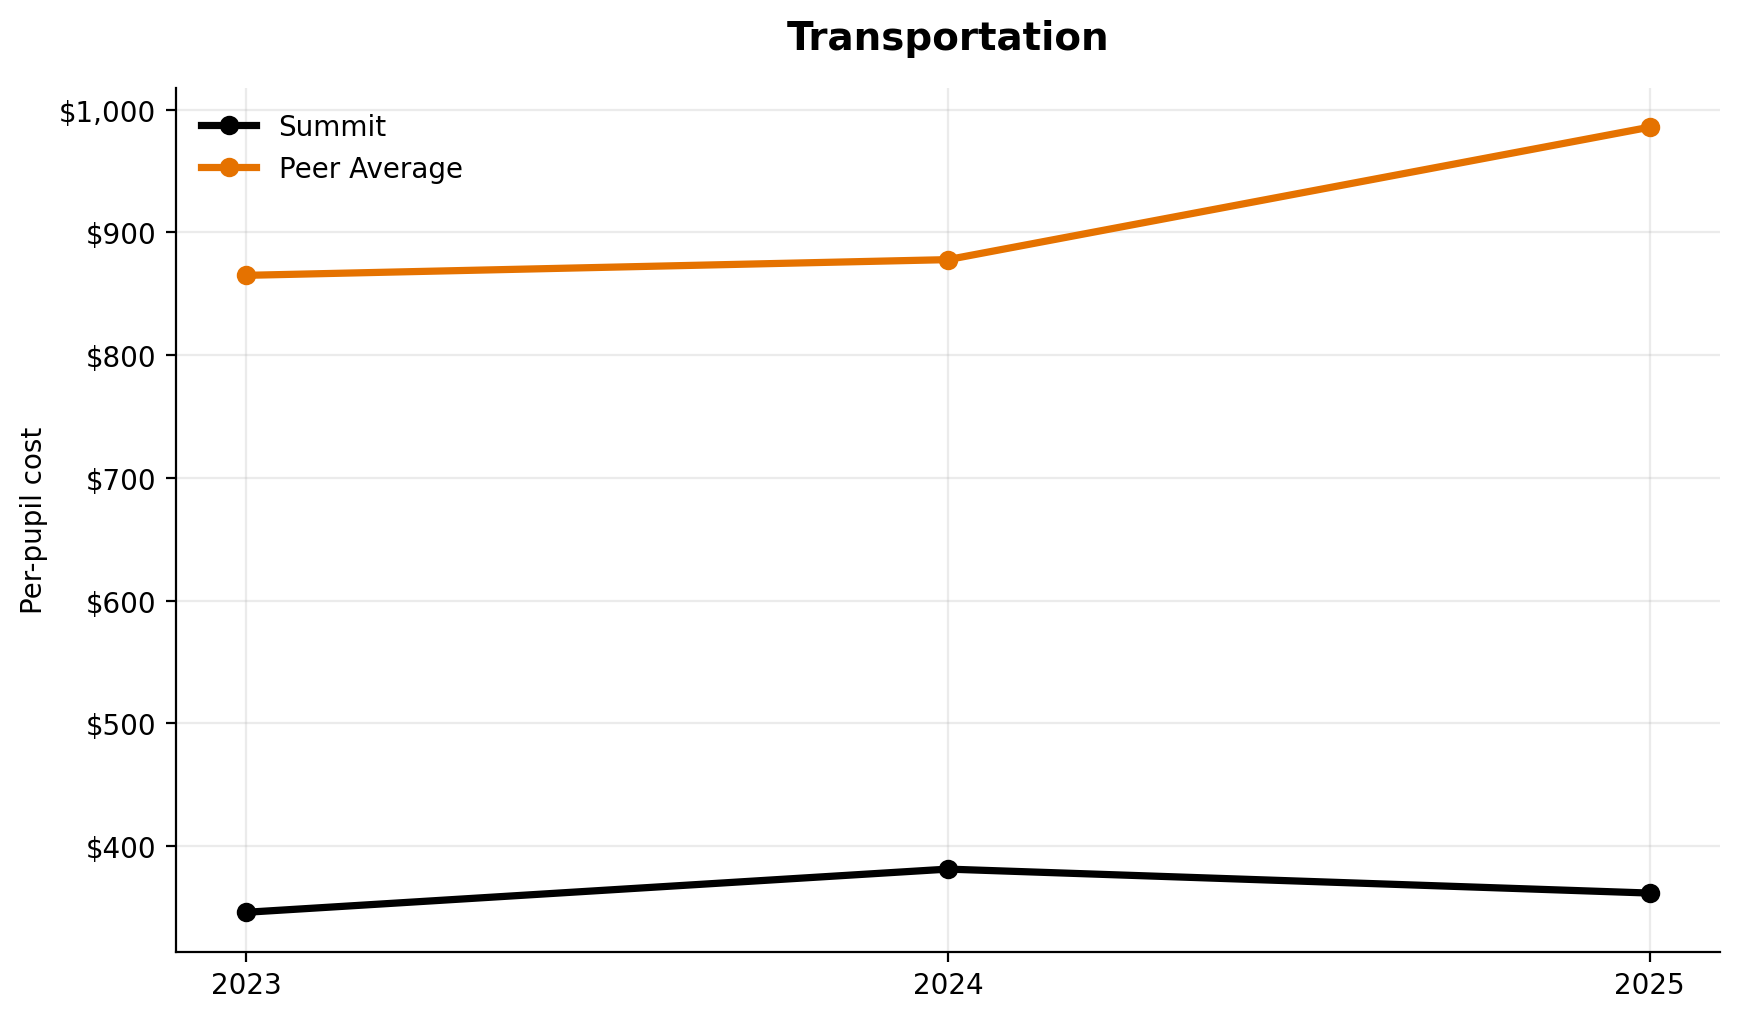
Transportation
Transportation ranks 7th of 7.
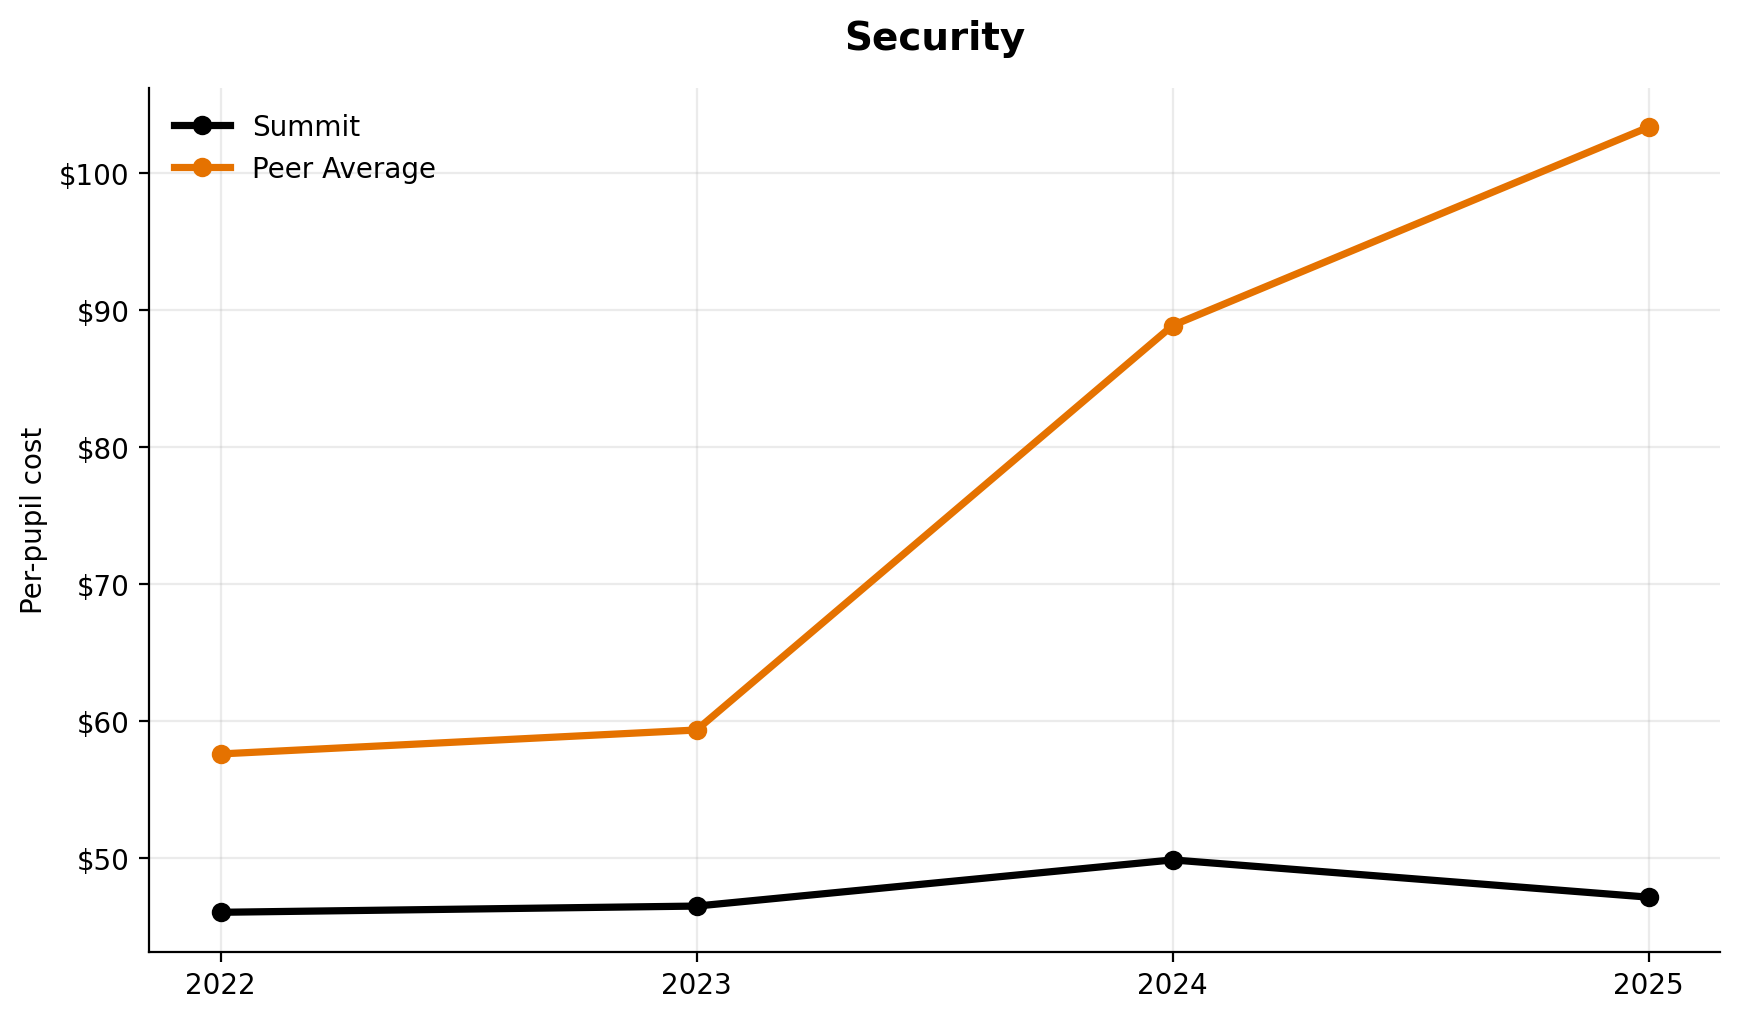
Security
Security ranks 7th of 7 and uses a 2022-2025 per-pupil trend.
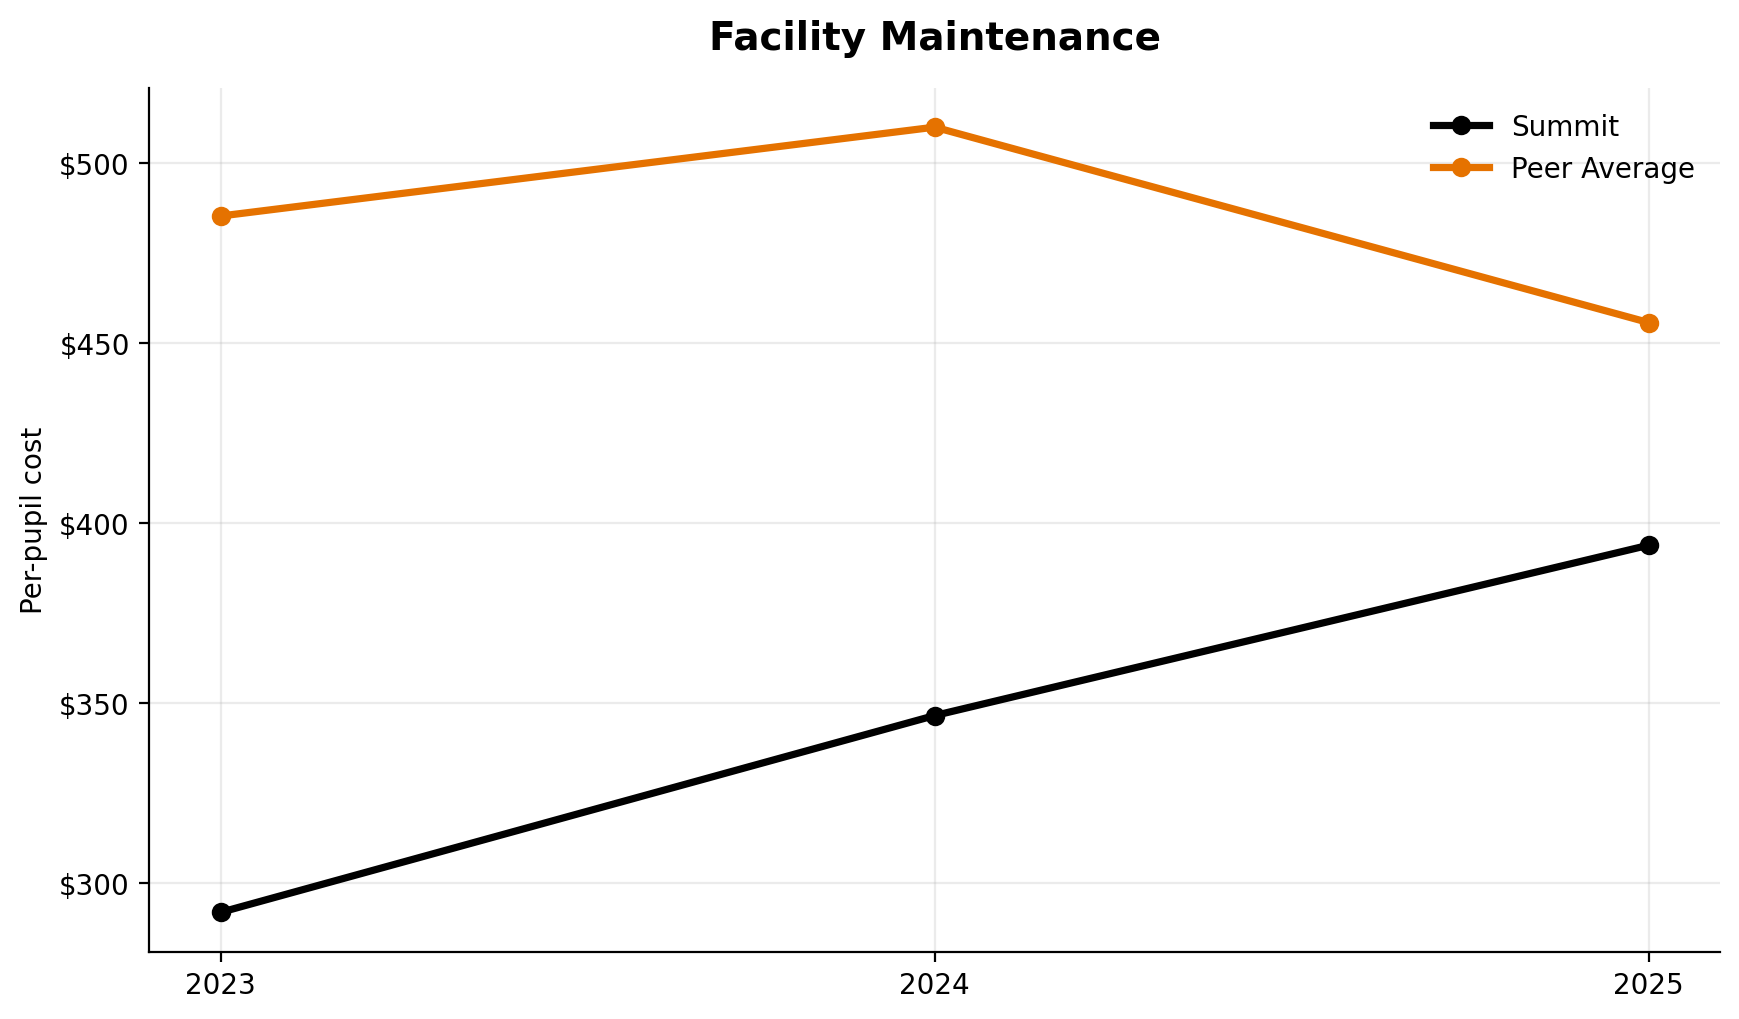
Facility Maintenance
Facility maintenance ranks 5th of 7.
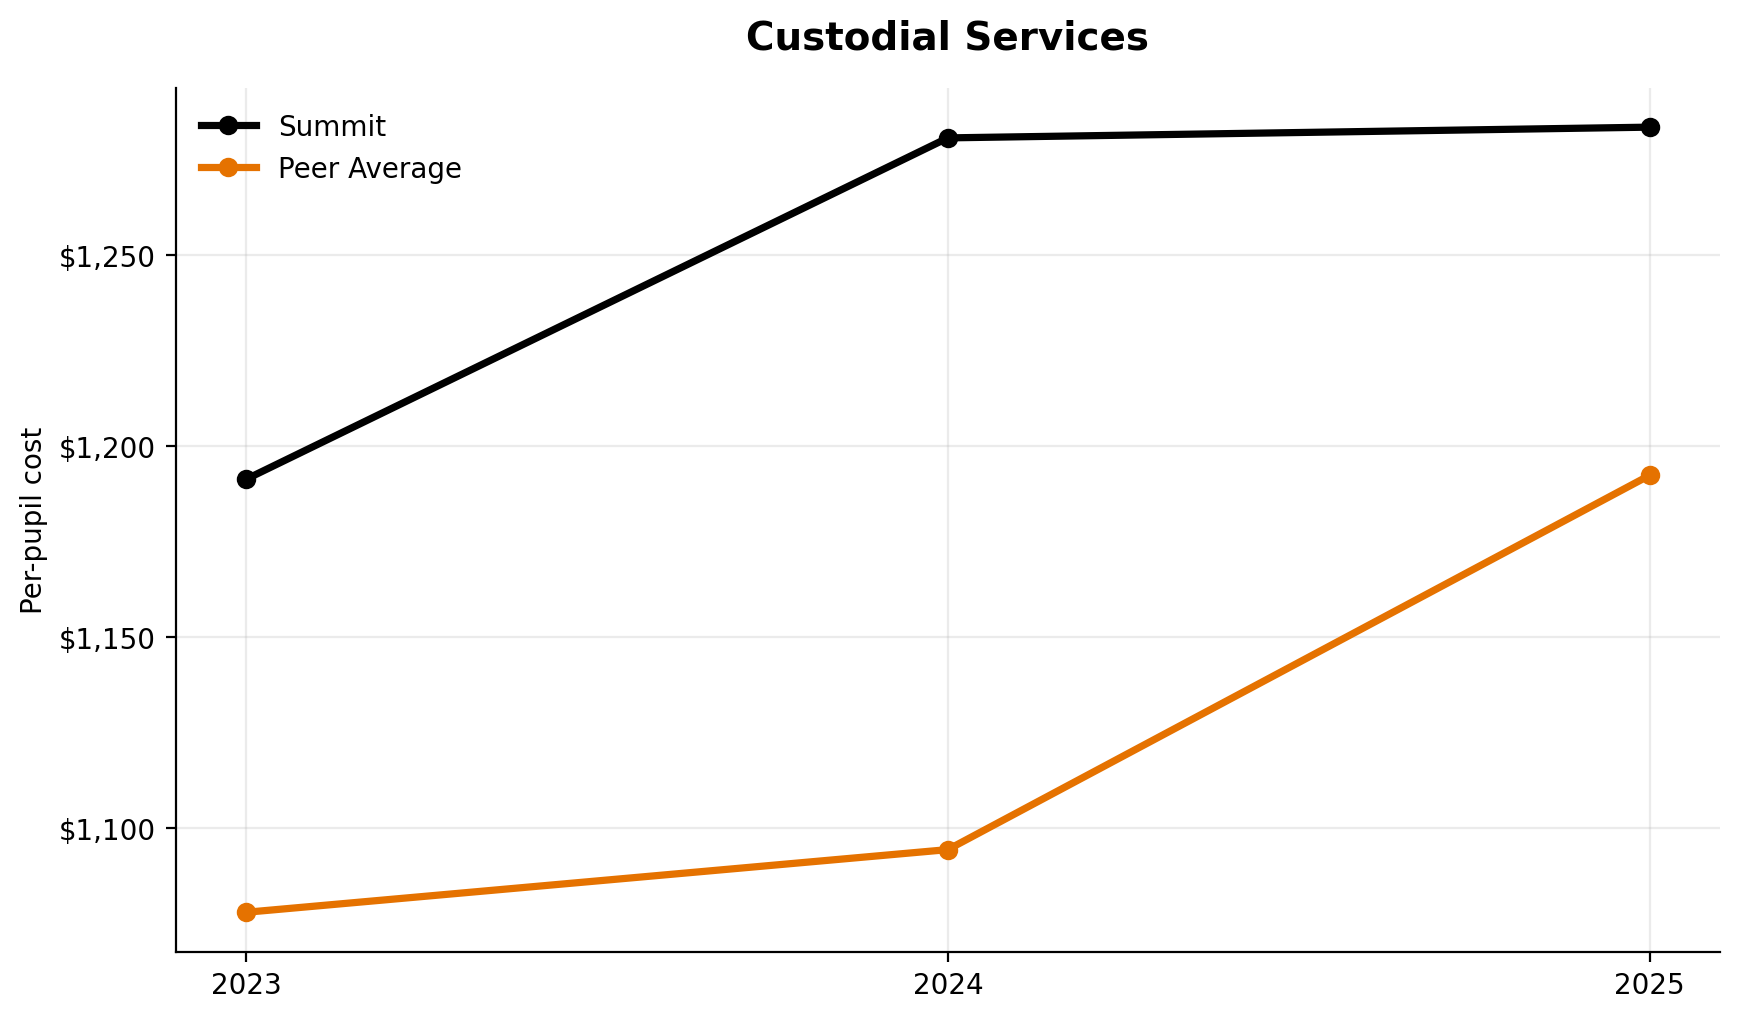
Custodial Services
Custodial services rank 3rd of 7.
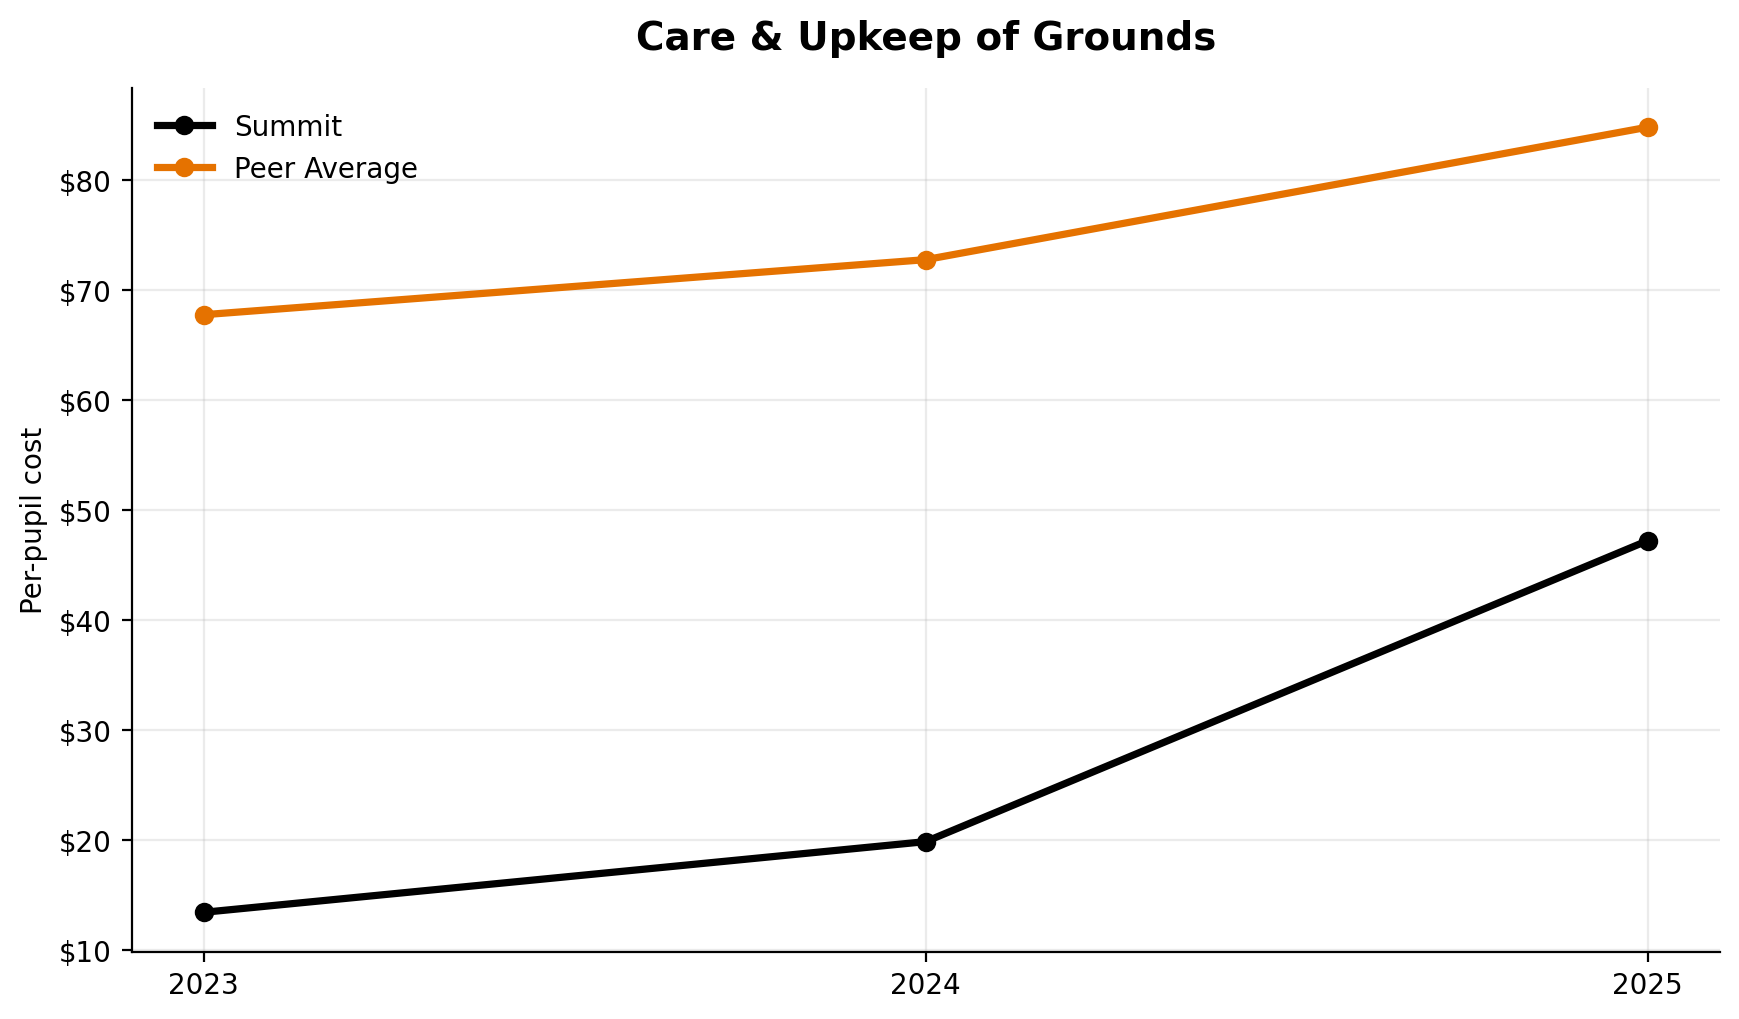
Care & Upkeep of Grounds
Grounds spending ranks 5th of 7.