Westfield School District ACFR Profile
This page is meant to give residents a cleaner apples-to-apples view of how Westfield compares with the six other districts on our ACFR dashboard. The rankings below are based on verified 2025 per-pupil figures unless otherwise noted. A rank of 1st means the highest per-student spending in that category among the seven-district peer group.
1. Total District Overview
Westfield sits in the lower middle of the peer group on overall per-pupil cost. It is not near the top in total instruction or total administration, but it does post several higher rankings in student-service and support categories. That makes this a category-composition story rather than a simple high-spend or low-spend profile.
Top-Line Position
- Total Cost Per Pupil: 5th of 7 ($27,266)
- Instruction (All Categories): 6th of 7 ($9,096)
- Total Administration: 7th of 7
Questions Residents Can Ask
- If Westfield is 5th overall but 6th in total instruction and 7th in total administration, which categories are pulling its total cost upward?
- Which top-ranked lines reflect durable program priorities, and which may reflect coding or category structure?
- Where has Westfield diverged most from the peer average over time?
2. Core Instruction & Classroom Spending
This section shows how Westfield compares on classroom instruction and related instructional support categories.
Where Westfield Ranks
- Regular Programs: 6th of 7
- Staff Training: 5th of 7
- Textbooks: 5th of 7
- Improvement of Instruction: 6th of 7
What Stands Out
Westfield’s instructional profile is generally lower-ranked across the board. It ranks 6th of 7 in total instruction, regular programs, and improvement of instruction, while staff training and textbooks both rank 5th of 7. That does not prove underinvestment by itself, but it does make the district’s higher-ranked non-core categories more noticeable.
3. Special Education Services
Westfield’s special education picture is mixed, with some lower-ranked categories and a few sharp pockets that stand out.
Where Westfield Ranks
- Special Education (Total): 5th of 7
- Resource Room: 5th of 7
- Autism: 4th of 7
- Child Study Teams: 5th of 7
- Speech, OT, PT & Related Services: 1st of 7
- Learning & Language Disabilities: 5th of 7
- Other Support (Extra Services): 3rd of 7
- Other School Placement: 2nd of 7
What Stands Out
Westfield ranks 1st of 7 in speech, OT, PT & related services and 2nd of 7 in other school placement, even though total special education and several other subcategories sit in the lower middle of the group. Those higher rankings should be treated as categories to explain, not quiet positives.
4. Student Activities & Support Services
These categories reflect counseling, student activities, health services, library/media, bilingual support, and remedial services.
Where Westfield Ranks
- Athletics: 6th of 7
- Guidance: 3rd of 7
- Health Services: 2nd of 7
- Educational Media Services (Library): 6th of 7
- Bilingual Education: 6th of 7
- Cocurricular Activities: 7th of 7
- Basic Skills / Remedial: 1st of 7
What Stands Out
Westfield ranks 1st of 7 in basic skills/remedial and 2nd of 7 in health services, but 7th of 7 in cocurricular activities and 6th of 7 in both athletics and bilingual education. This is a mixed student-support profile rather than a consistently high or low one.
5. Administration & Technology
Westfield’s administrative profile is uneven, with a very low total administration rank but a few higher individual categories.
Where Westfield Ranks
- Gen Admin (Total Sub-Account): 4th of 7
- Employee Benefits: 2nd of 7
- Admin Information Tech: 3rd of 7
- Legal Fees: 4th of 7
- School Administration: 7th of 7
- Central Services: 5th of 7
- Gen Admin (Misc): 6th of 7
What Stands Out
Westfield ranks 2nd of 7 in employee benefits and 3rd of 7 in admin information tech, but 7th of 7 in school administration and total administration overall. That makes this a category-composition story, not a simple one-line overhead conclusion.
6. Operations, Safety & Maintenance
These are the costs of running the district day to day: transportation, security, facility maintenance, custodial services, and grounds.
Where Westfield Ranks
- Care & Upkeep of Grounds: 4th of 7
- Transportation: 5th of 7
- Facility Maintenance: 7th of 7
- Security: 4th of 7
- Custodial Services: 6th of 7
What Stands Out
Operations is mostly a lower-ranked section for Westfield. Facility maintenance ranks 7th of 7, custodial services ranks 6th of 7, and transportation ranks 5th of 7, while security and grounds land in the middle. Lower spending here is not automatically a virtue either. It still needs explanation and context.
Trend Charts
These charts show not just where Westfield ranks in 2025, but how spending has moved over time relative to the seven-district average.
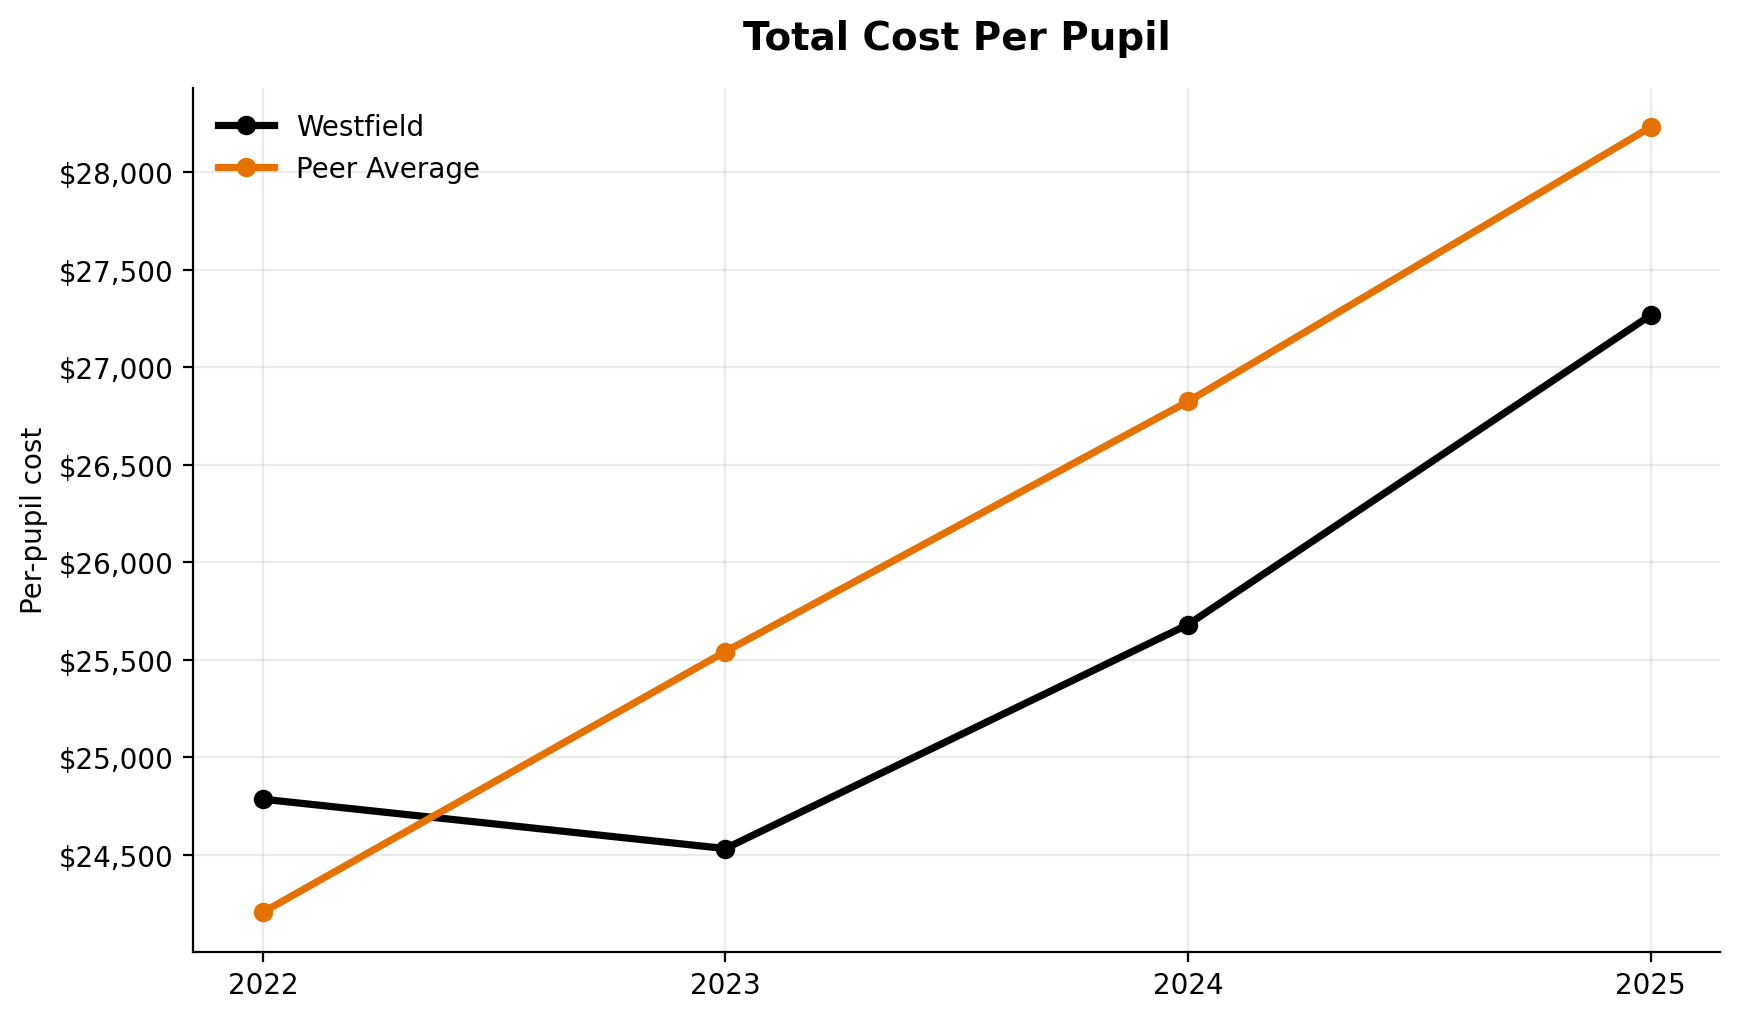
Total Cost Per Pupil
Westfield ranks 5th of 7 overall on total per-pupil cost.
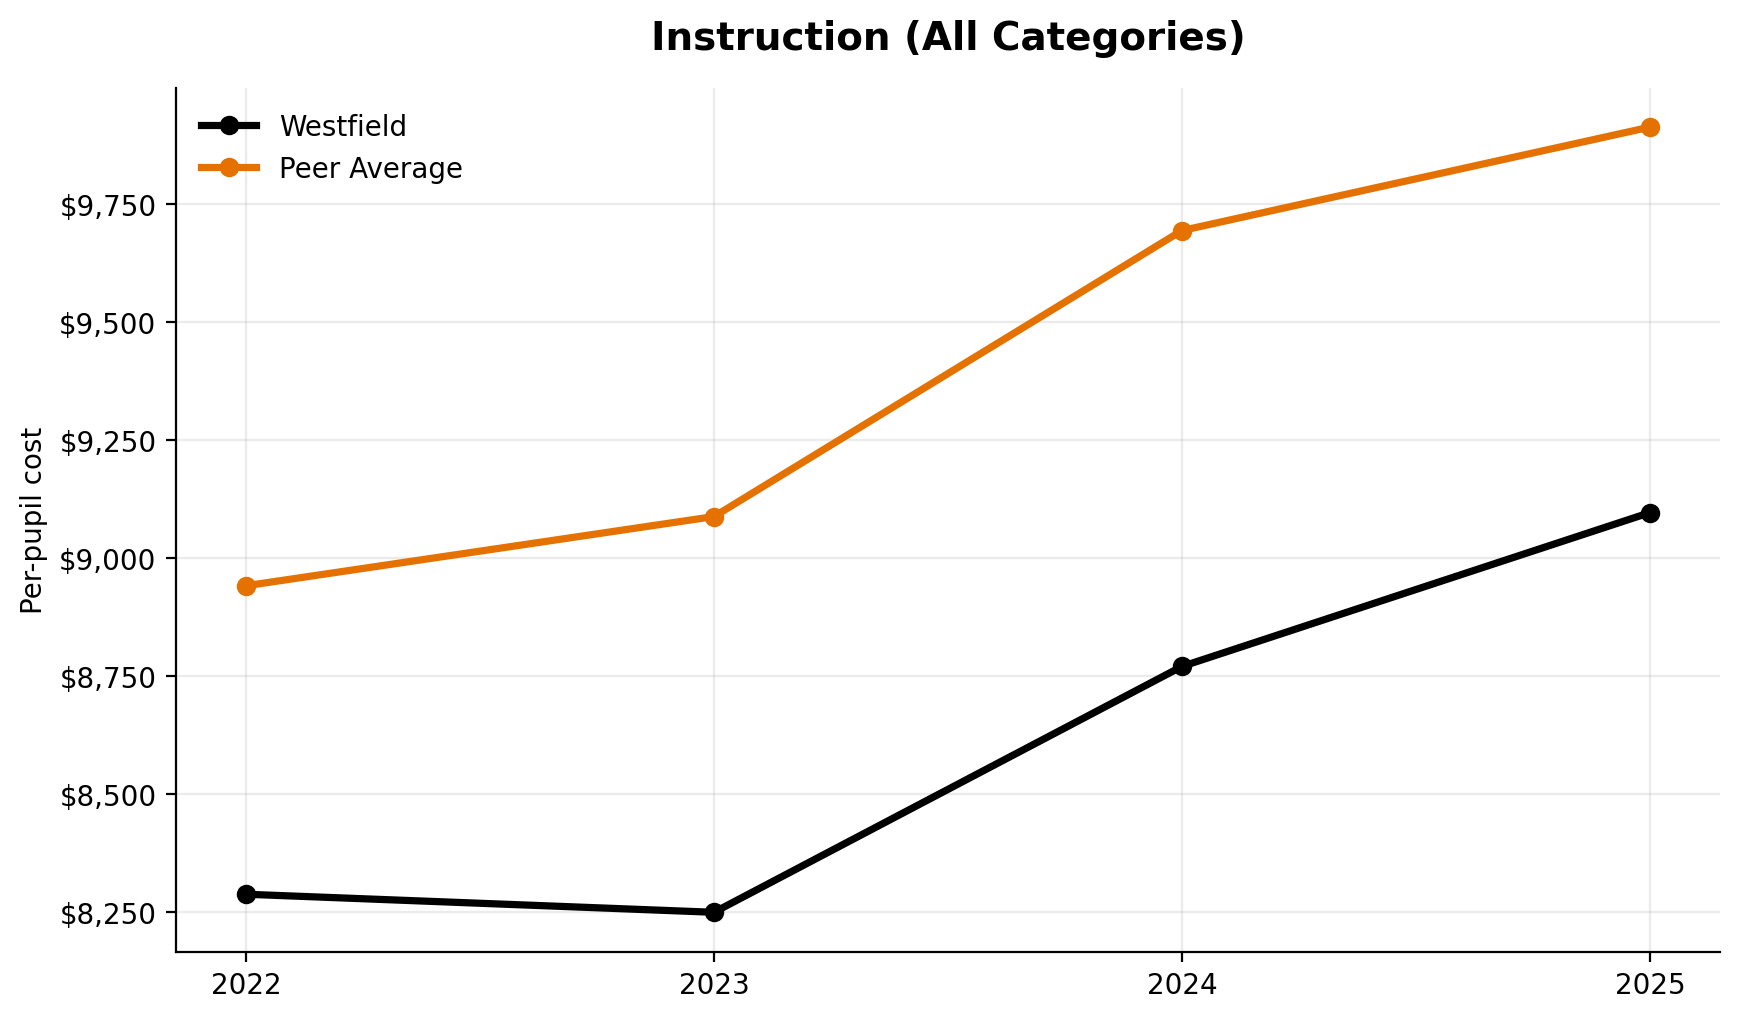
Instruction (All Categories)
Total instruction ranks 6th of 7 in 2025.
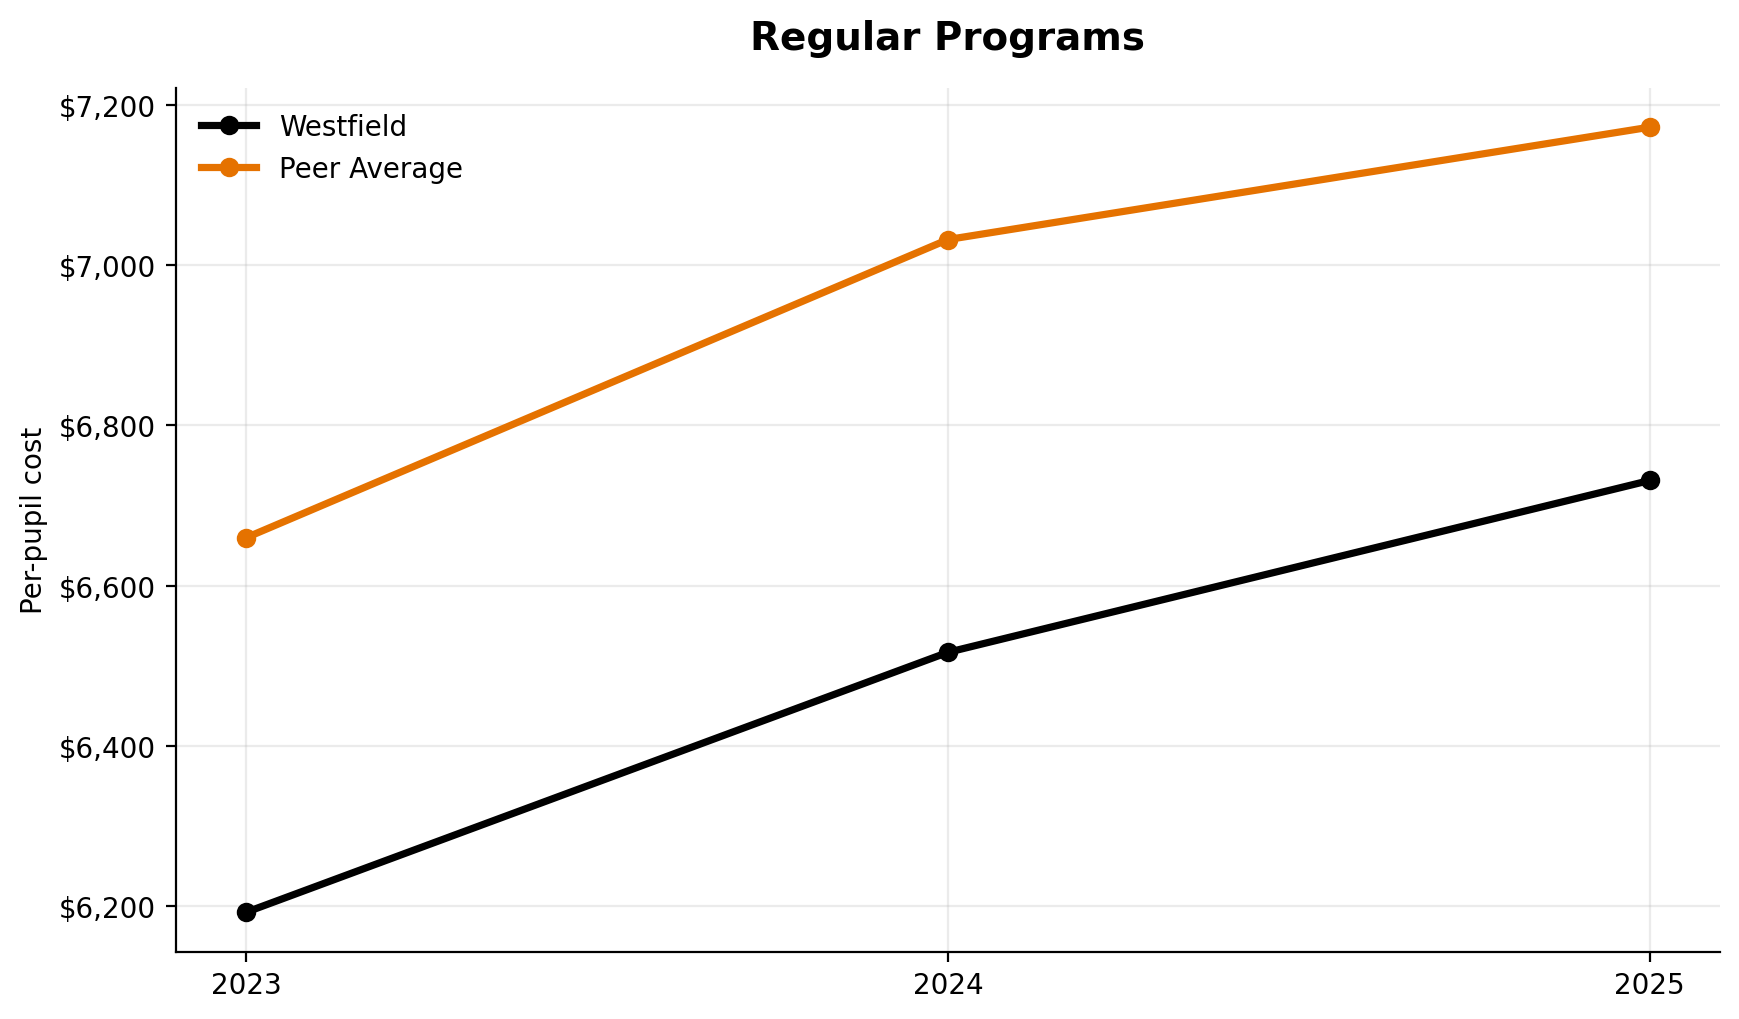
Regular Programs
Regular classroom instruction ranks 6th of 7.
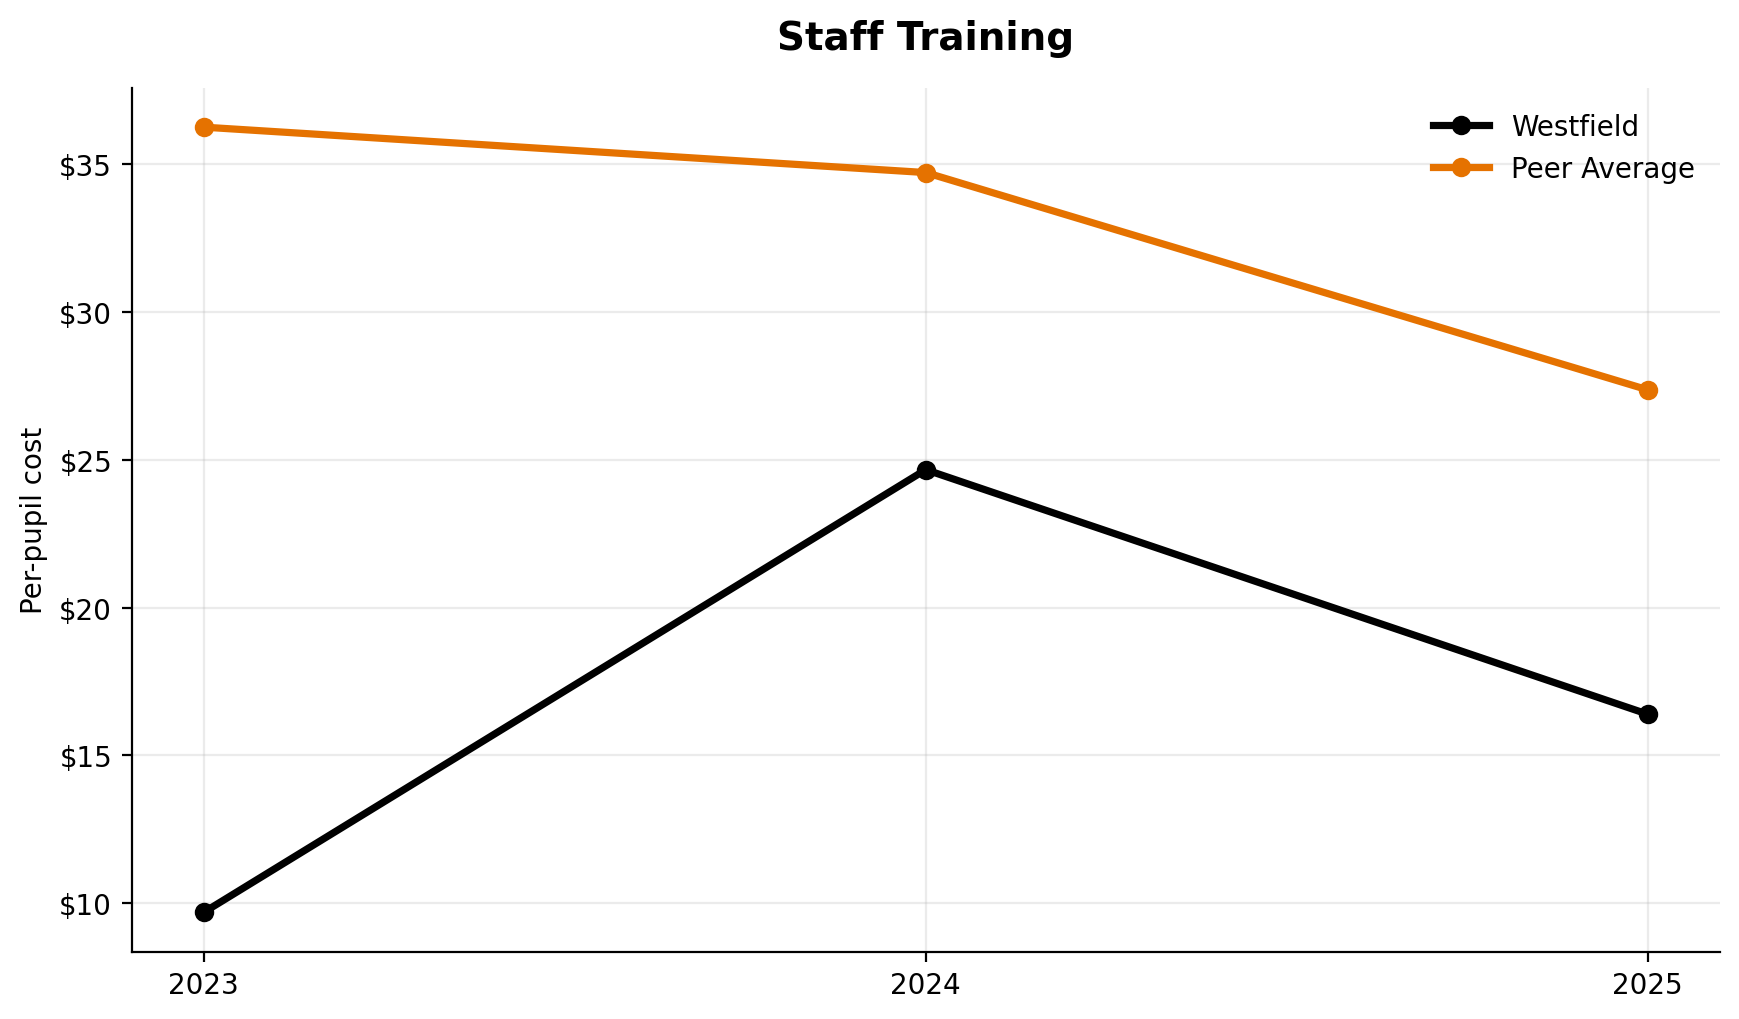
Staff Training
Staff training lands 5th of 7.
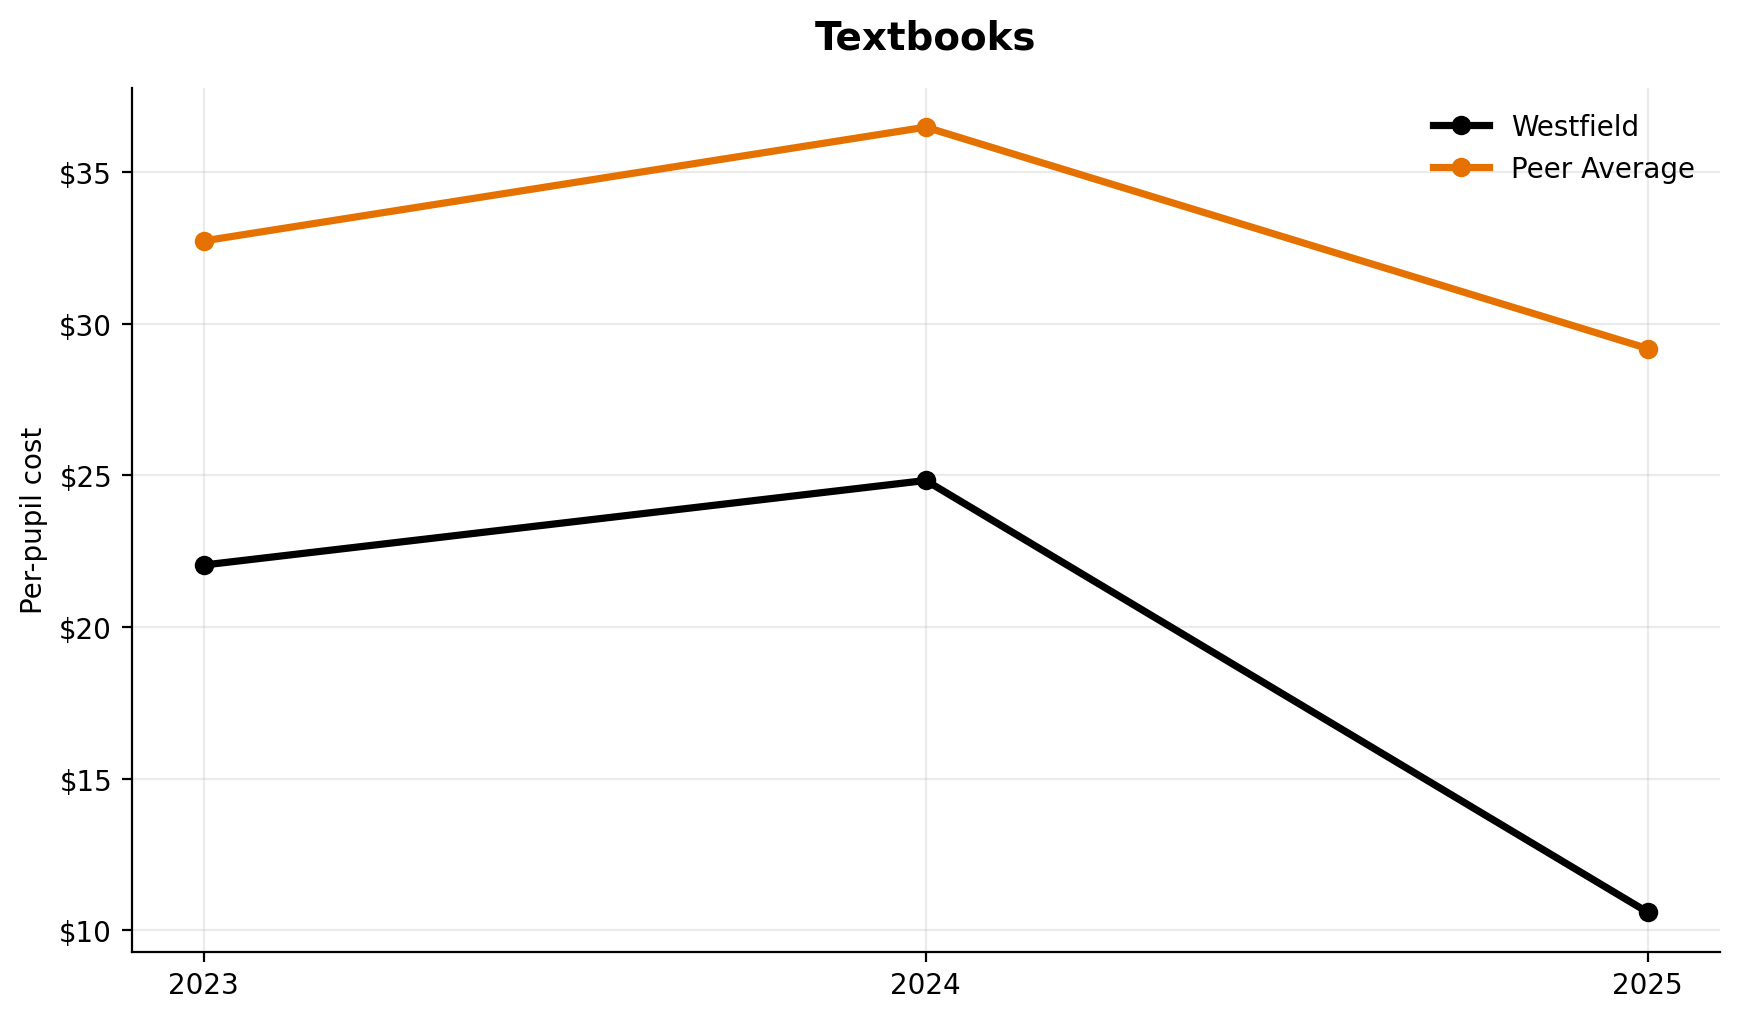
Textbooks
Textbook spending ranks 5th of 7.
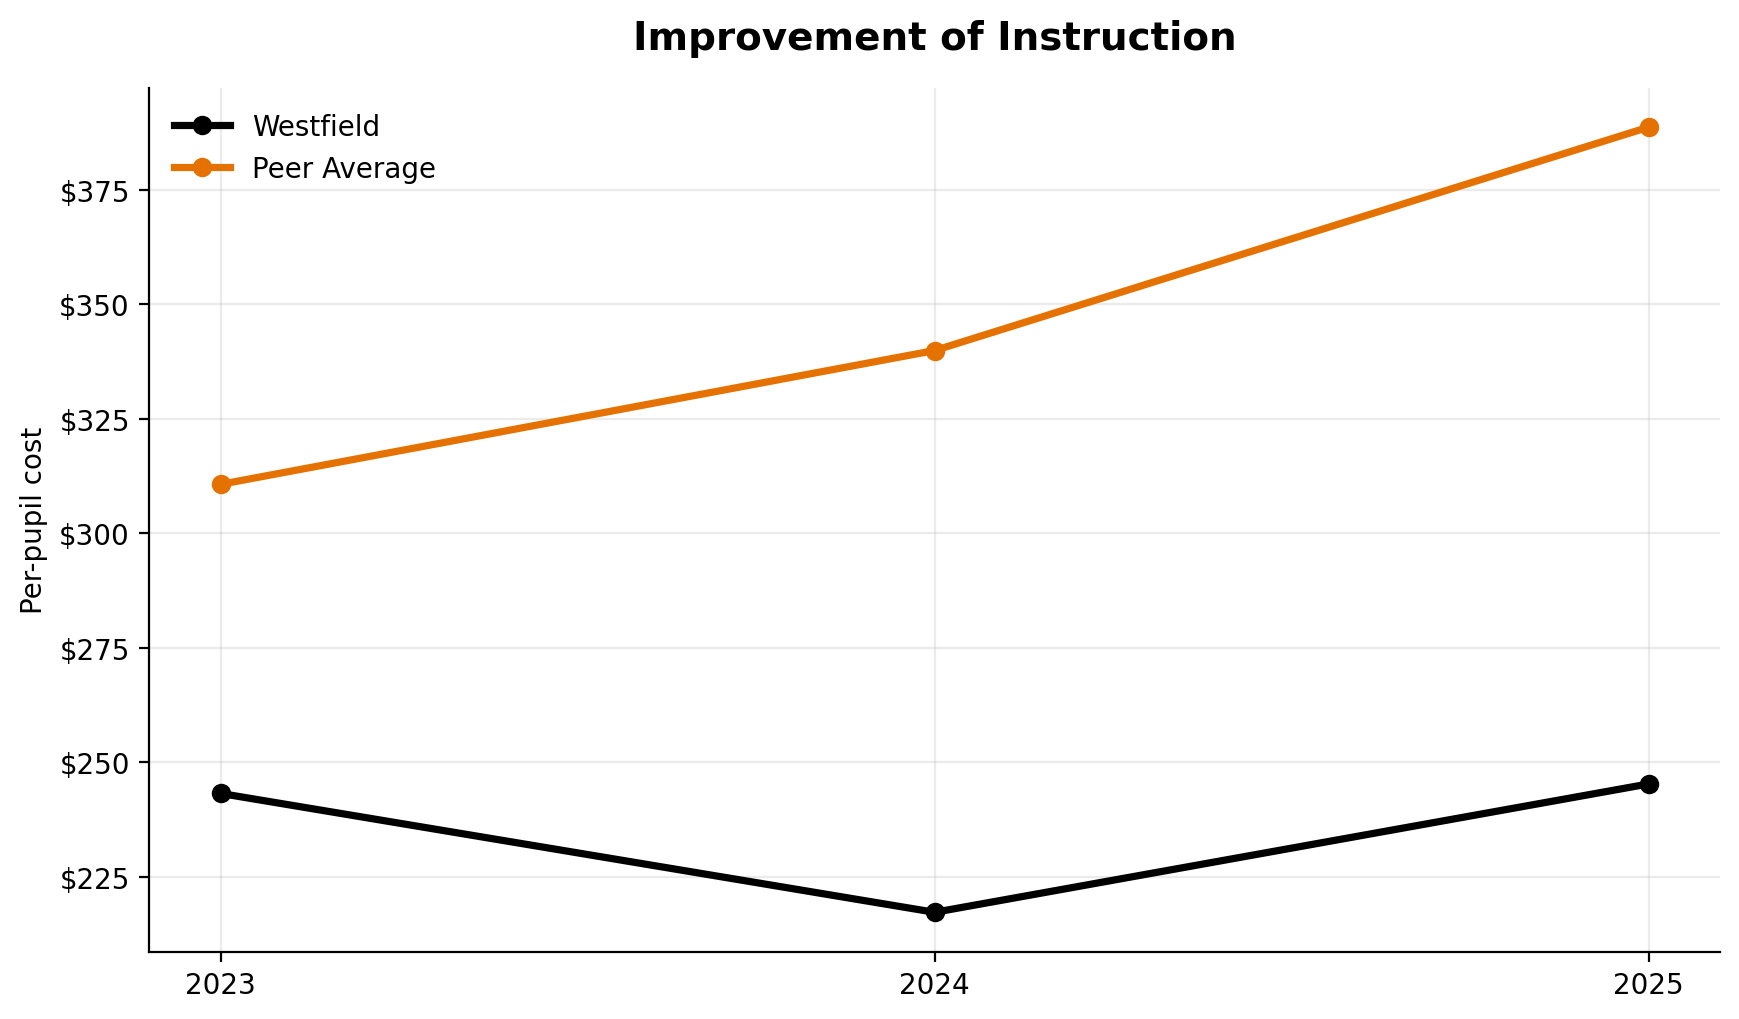
Improvement of Instruction
This category ranks 6th of 7.
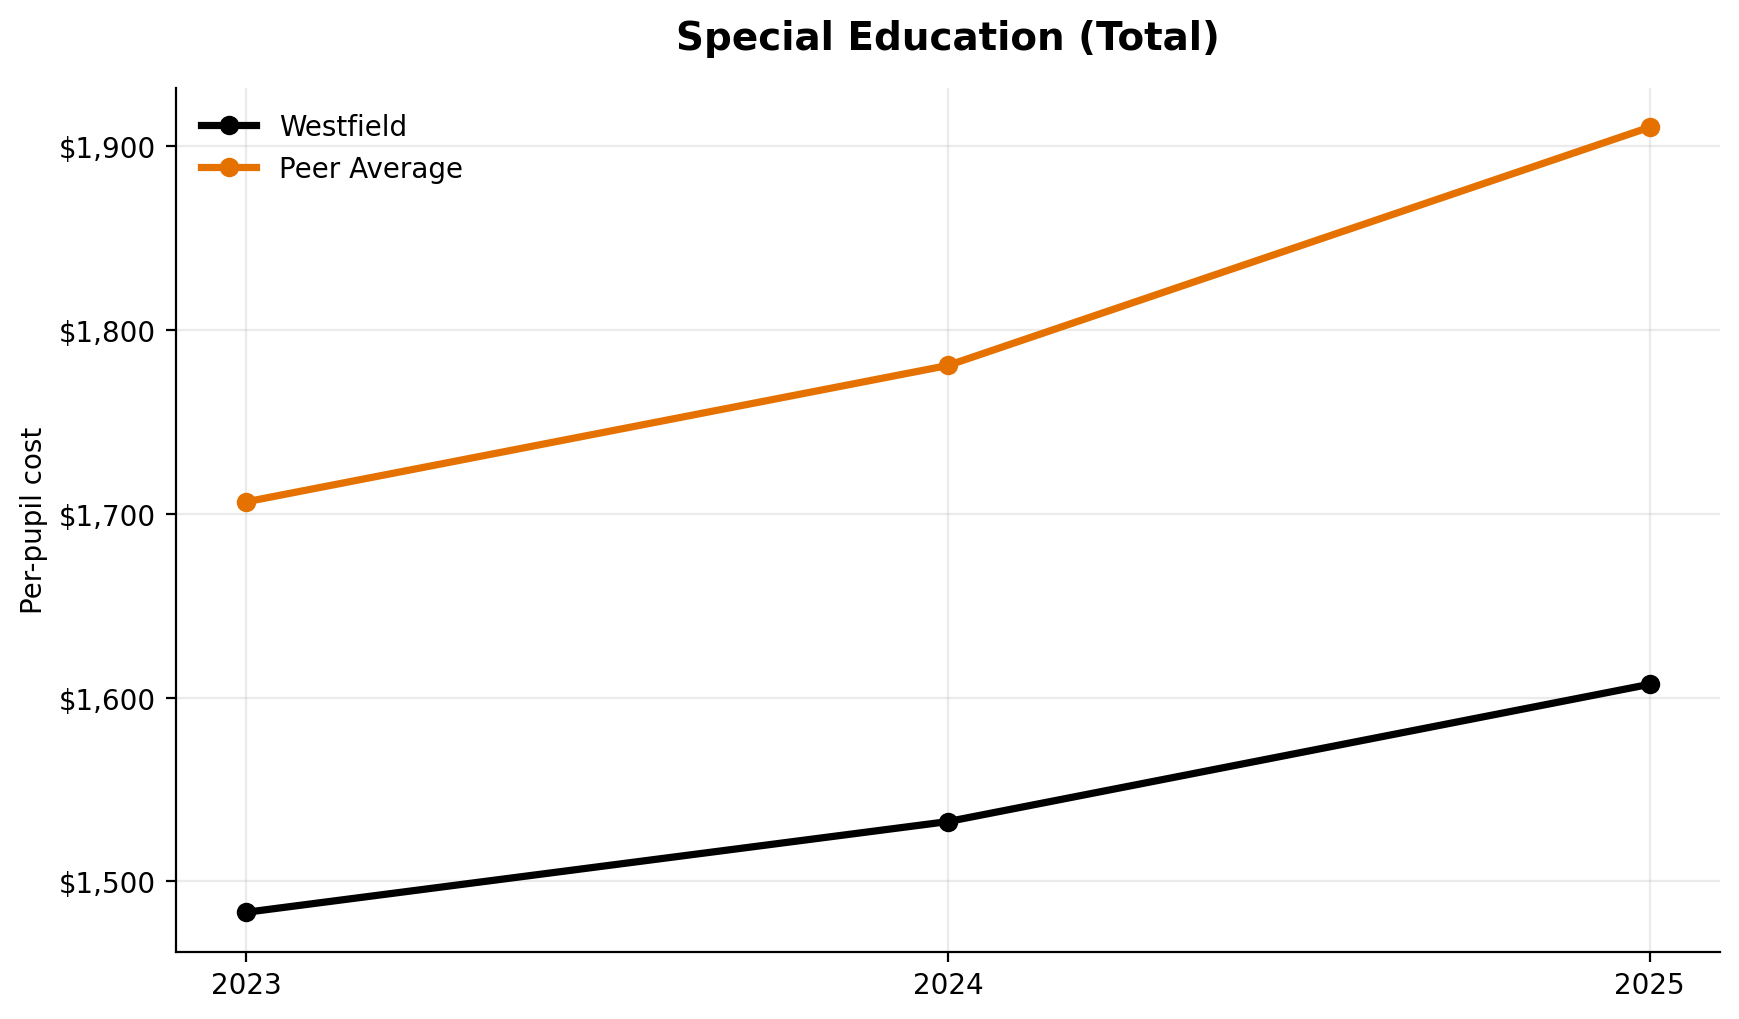
Special Education (Total)
Total special education ranks 5th of 7.
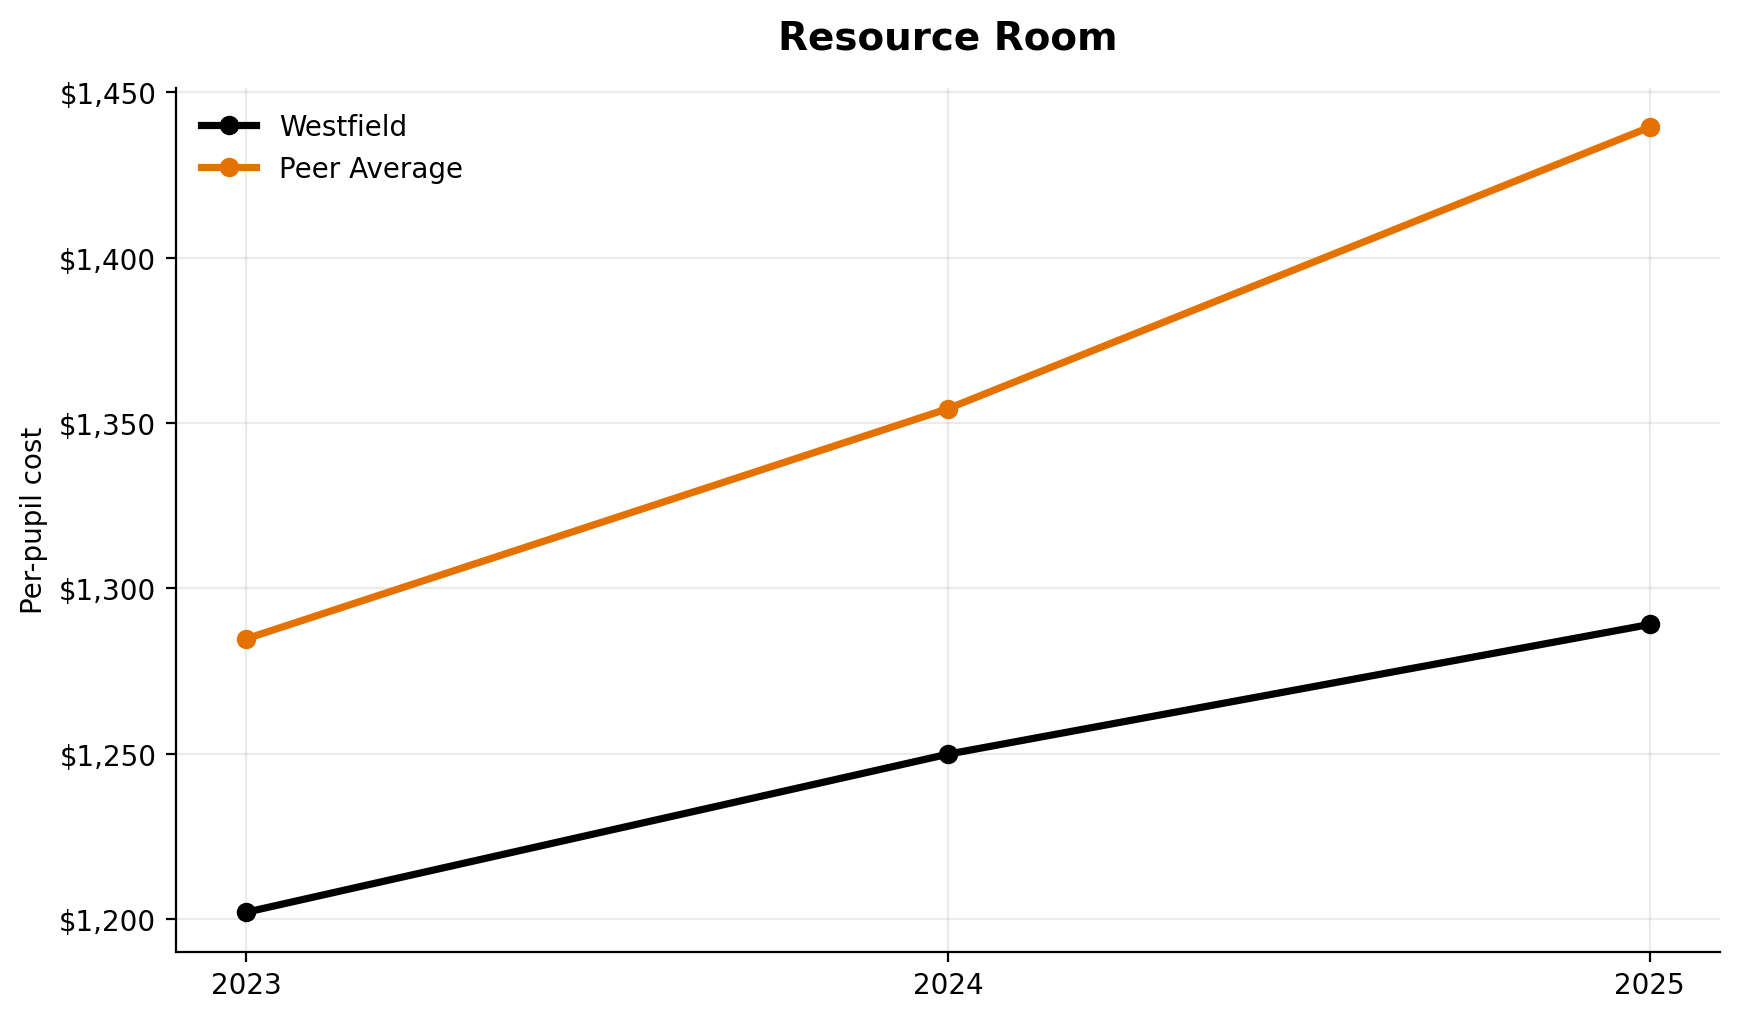
Resource Room
Resource room spending ranks 5th of 7.
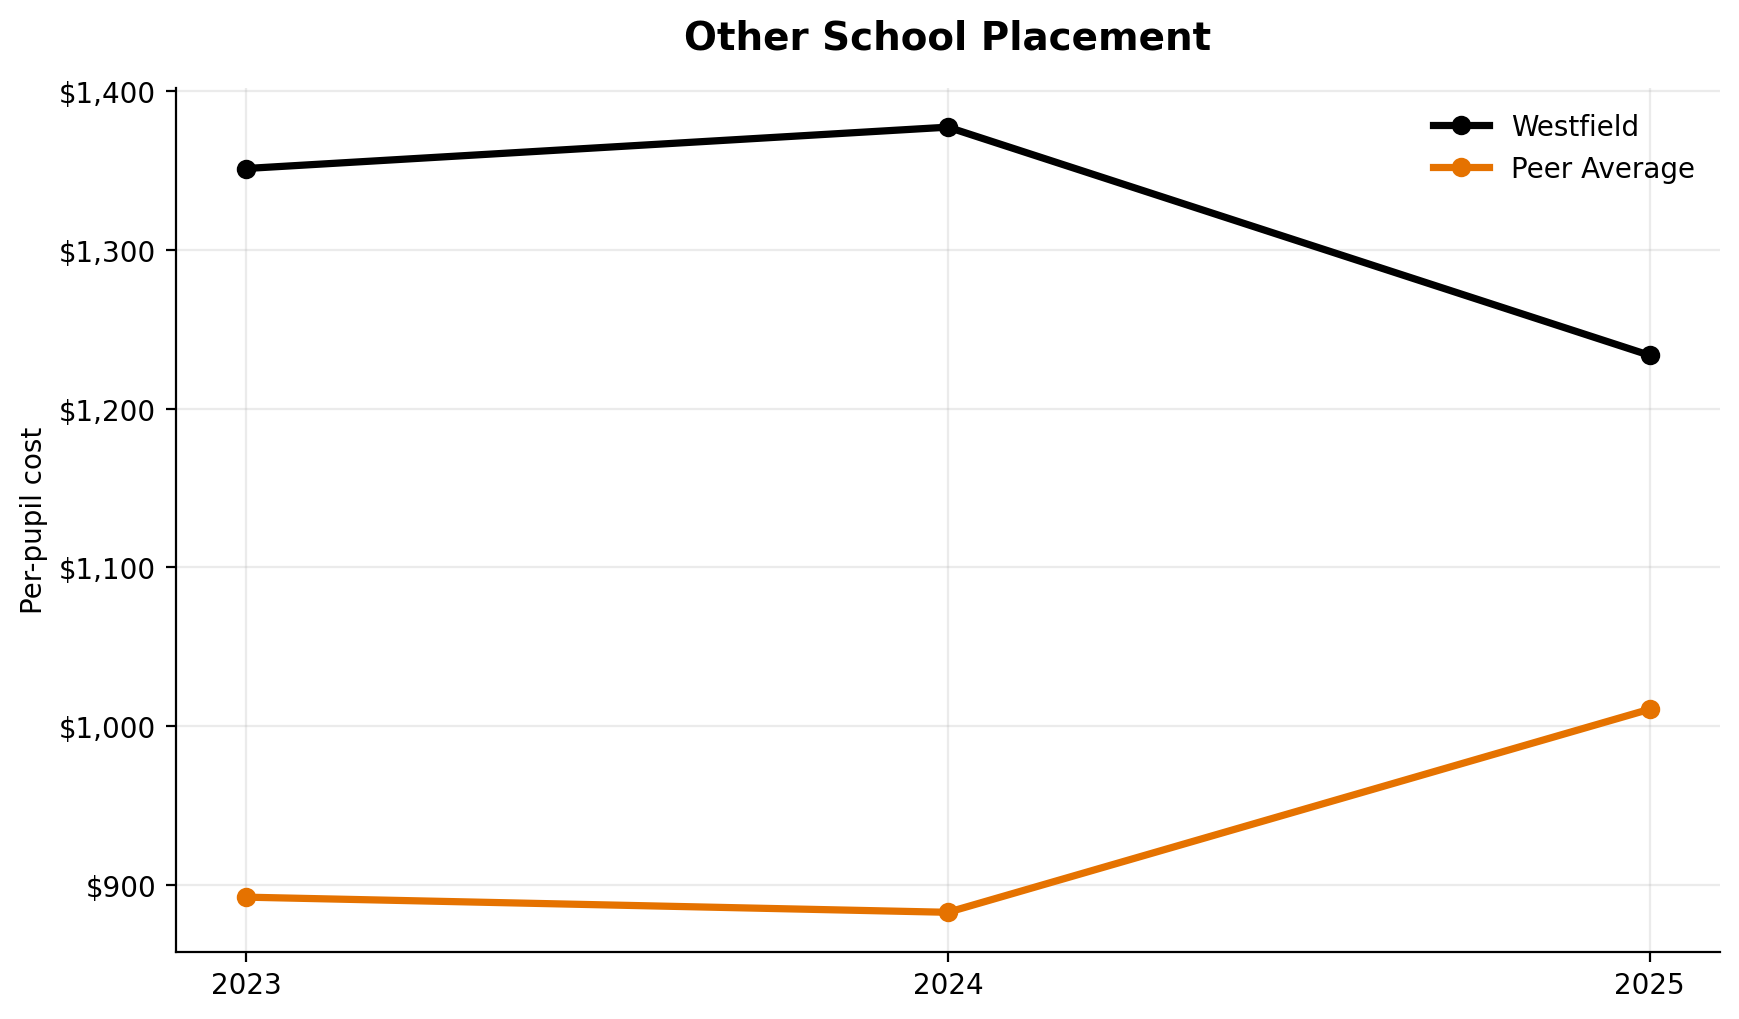
Other School Placement
Out-of-district placement ranks 2nd of 7.
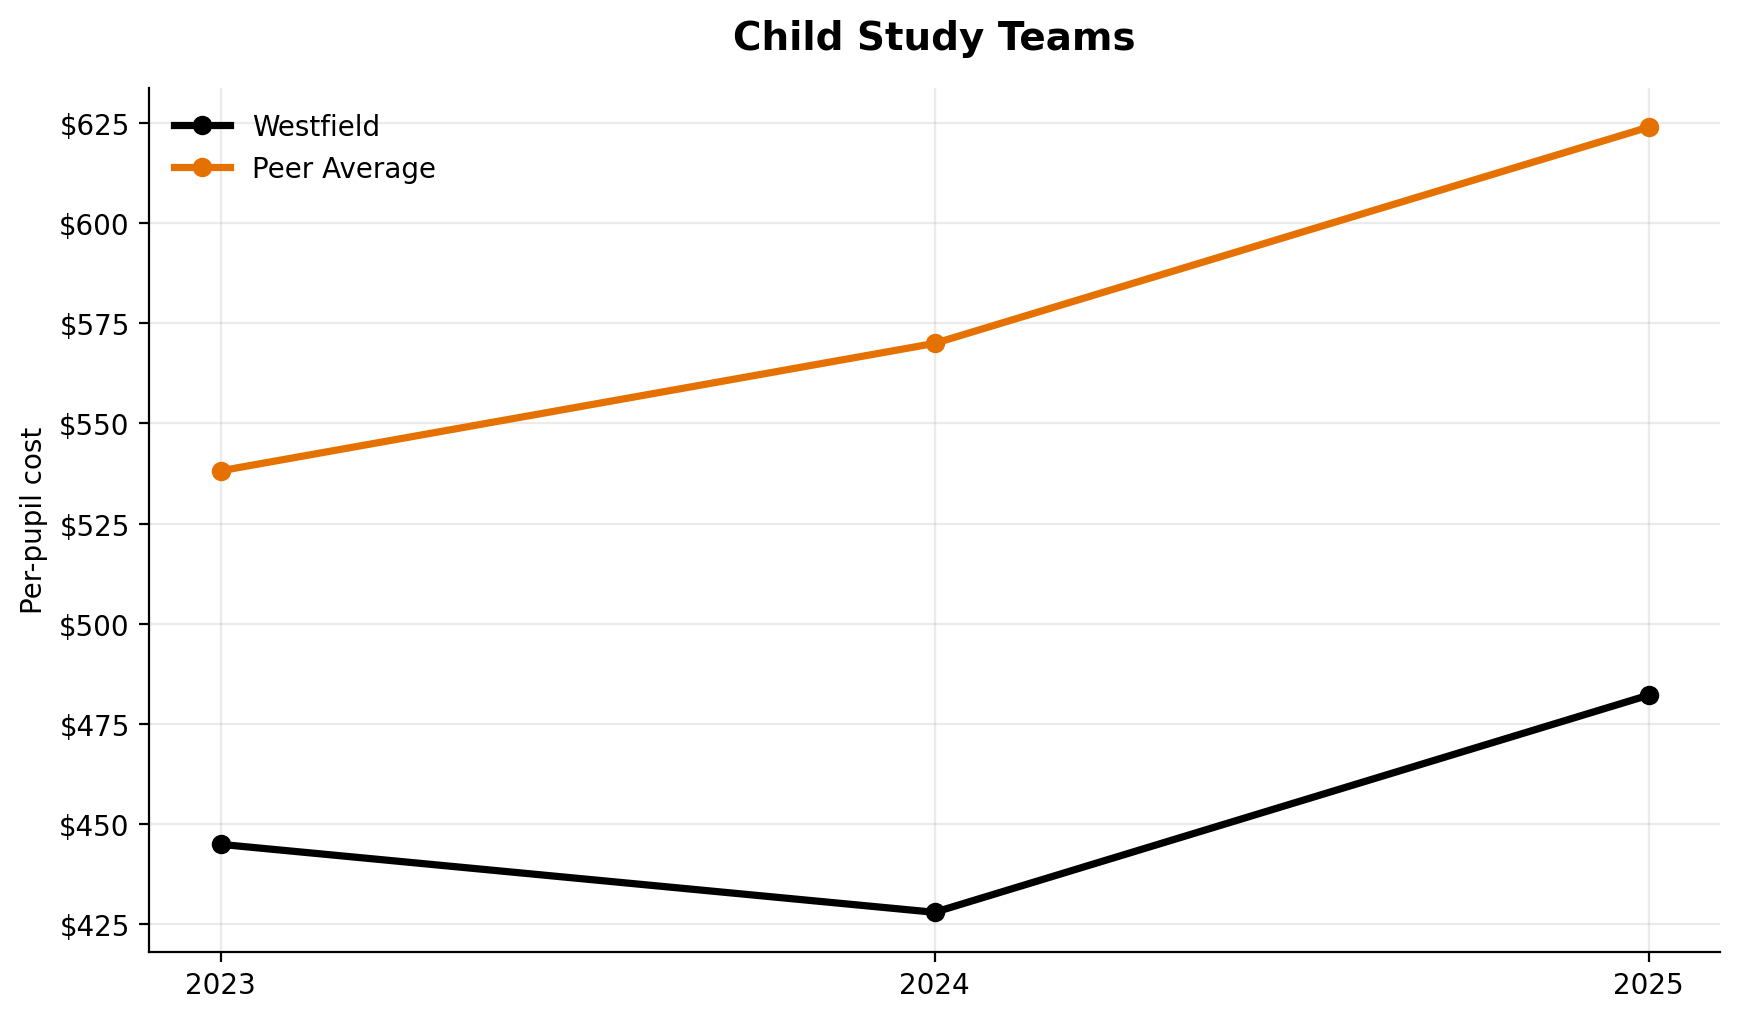
Child Study Teams
Child study teams rank 5th of 7.
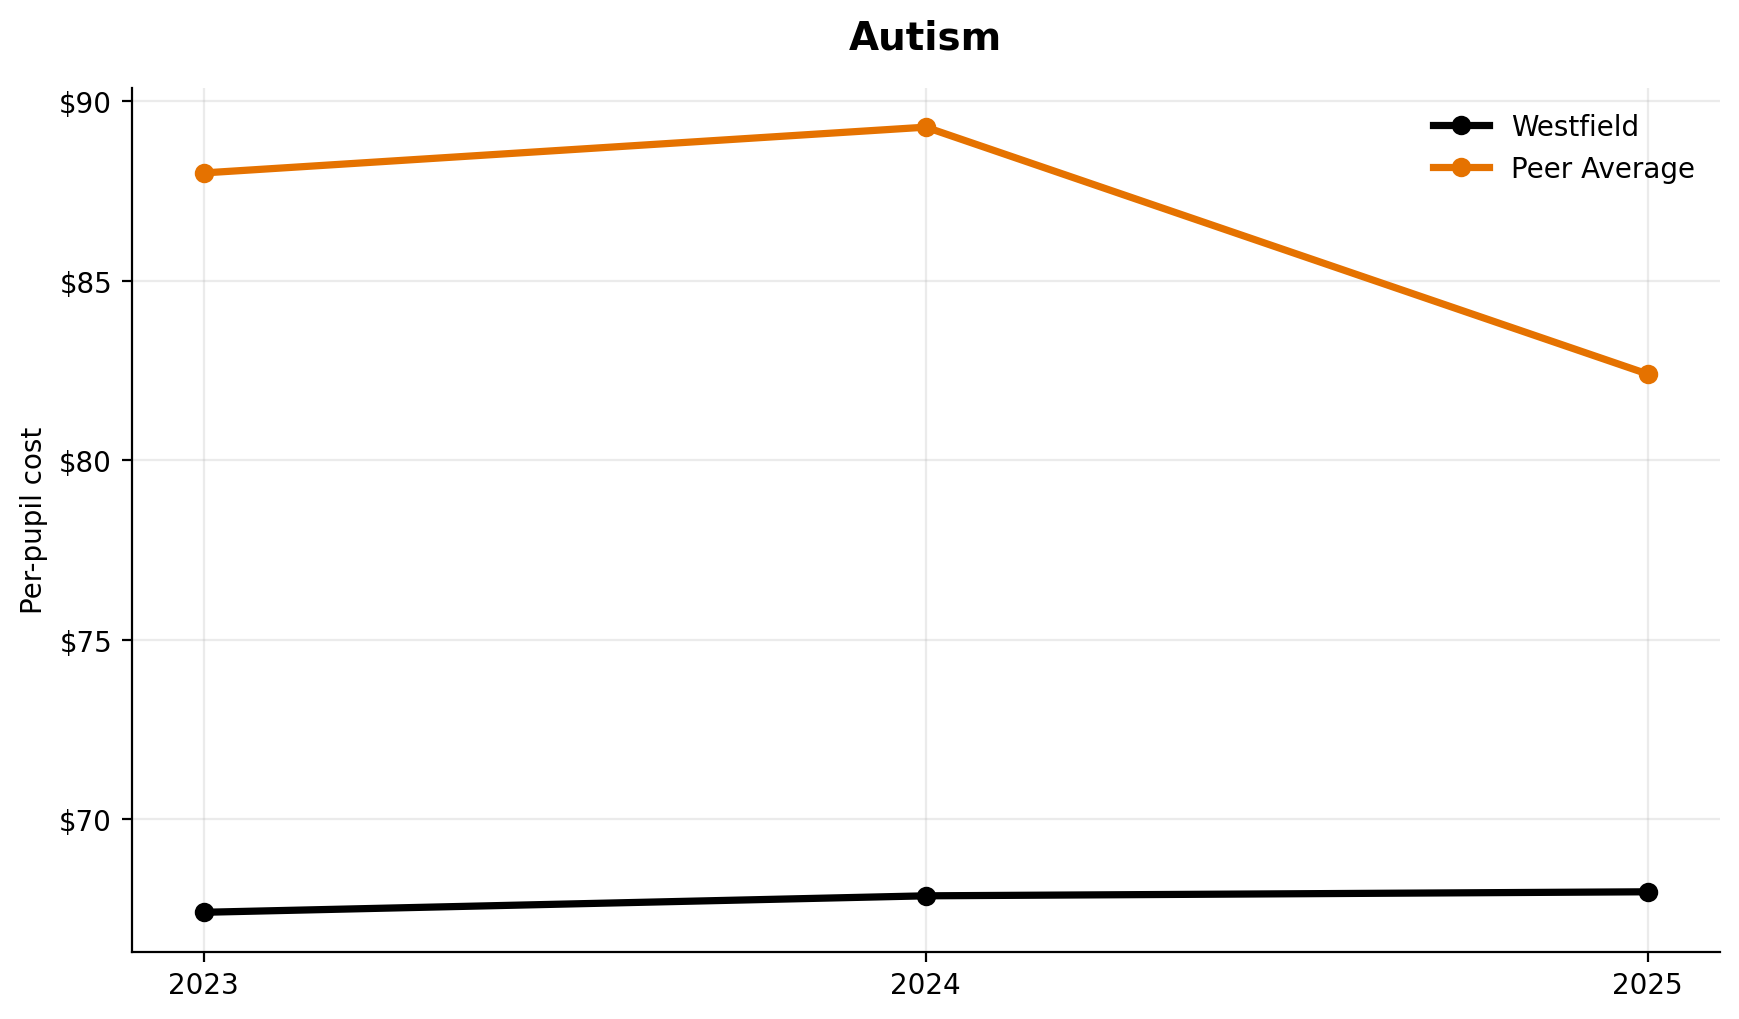
Autism
Autism services rank 4th of 7.
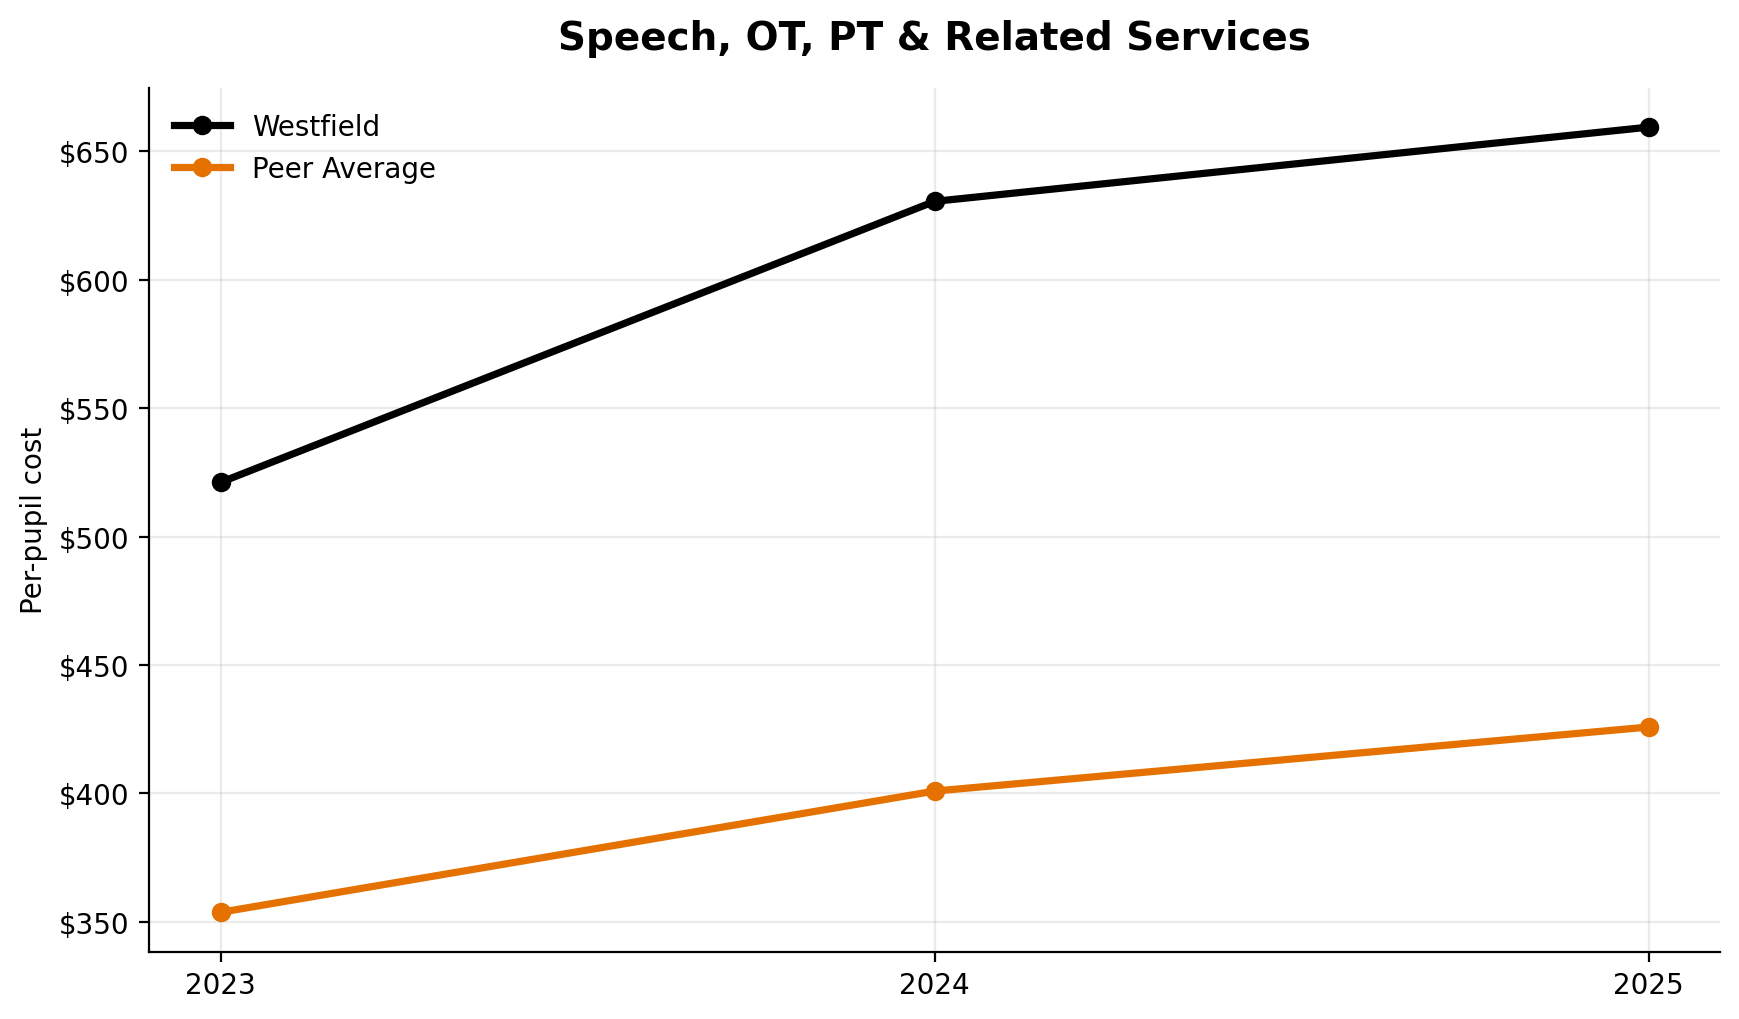
Speech, OT, PT & Related Services
Speech-related services rank 1st of 7 and should be read as a cost concentration that merits explanation.
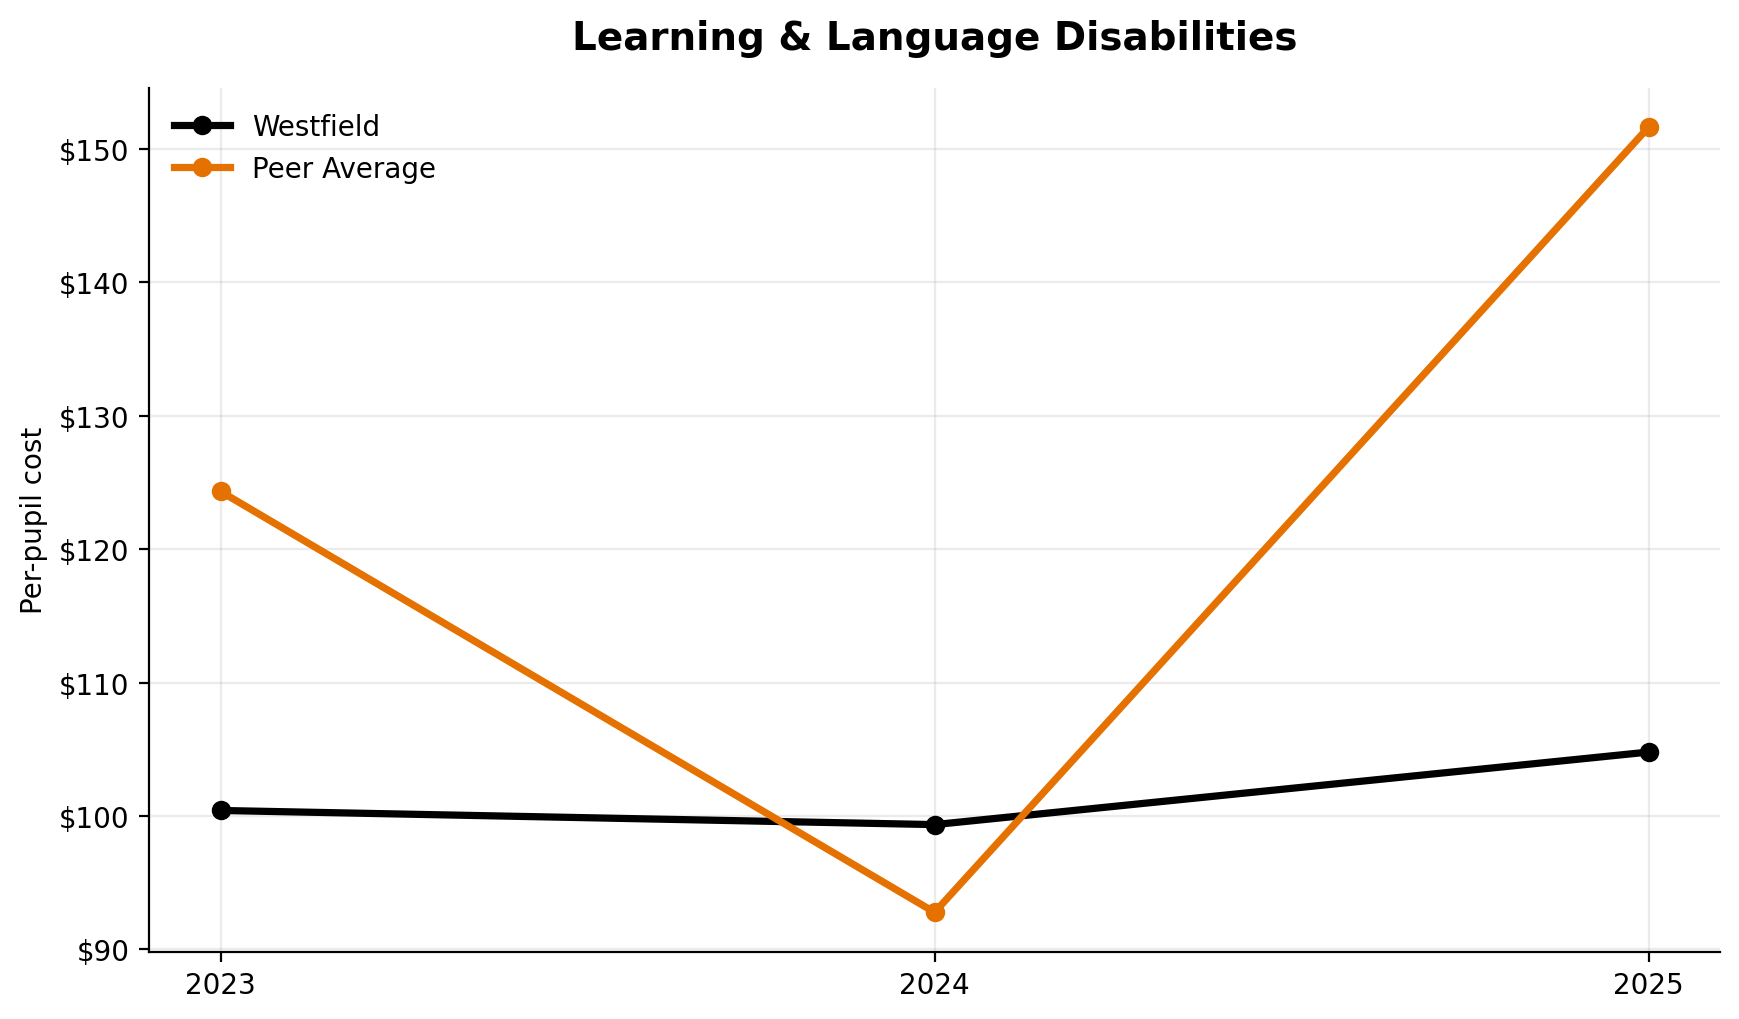
Learning & Language Disabilities
This category ranks 5th of 7.
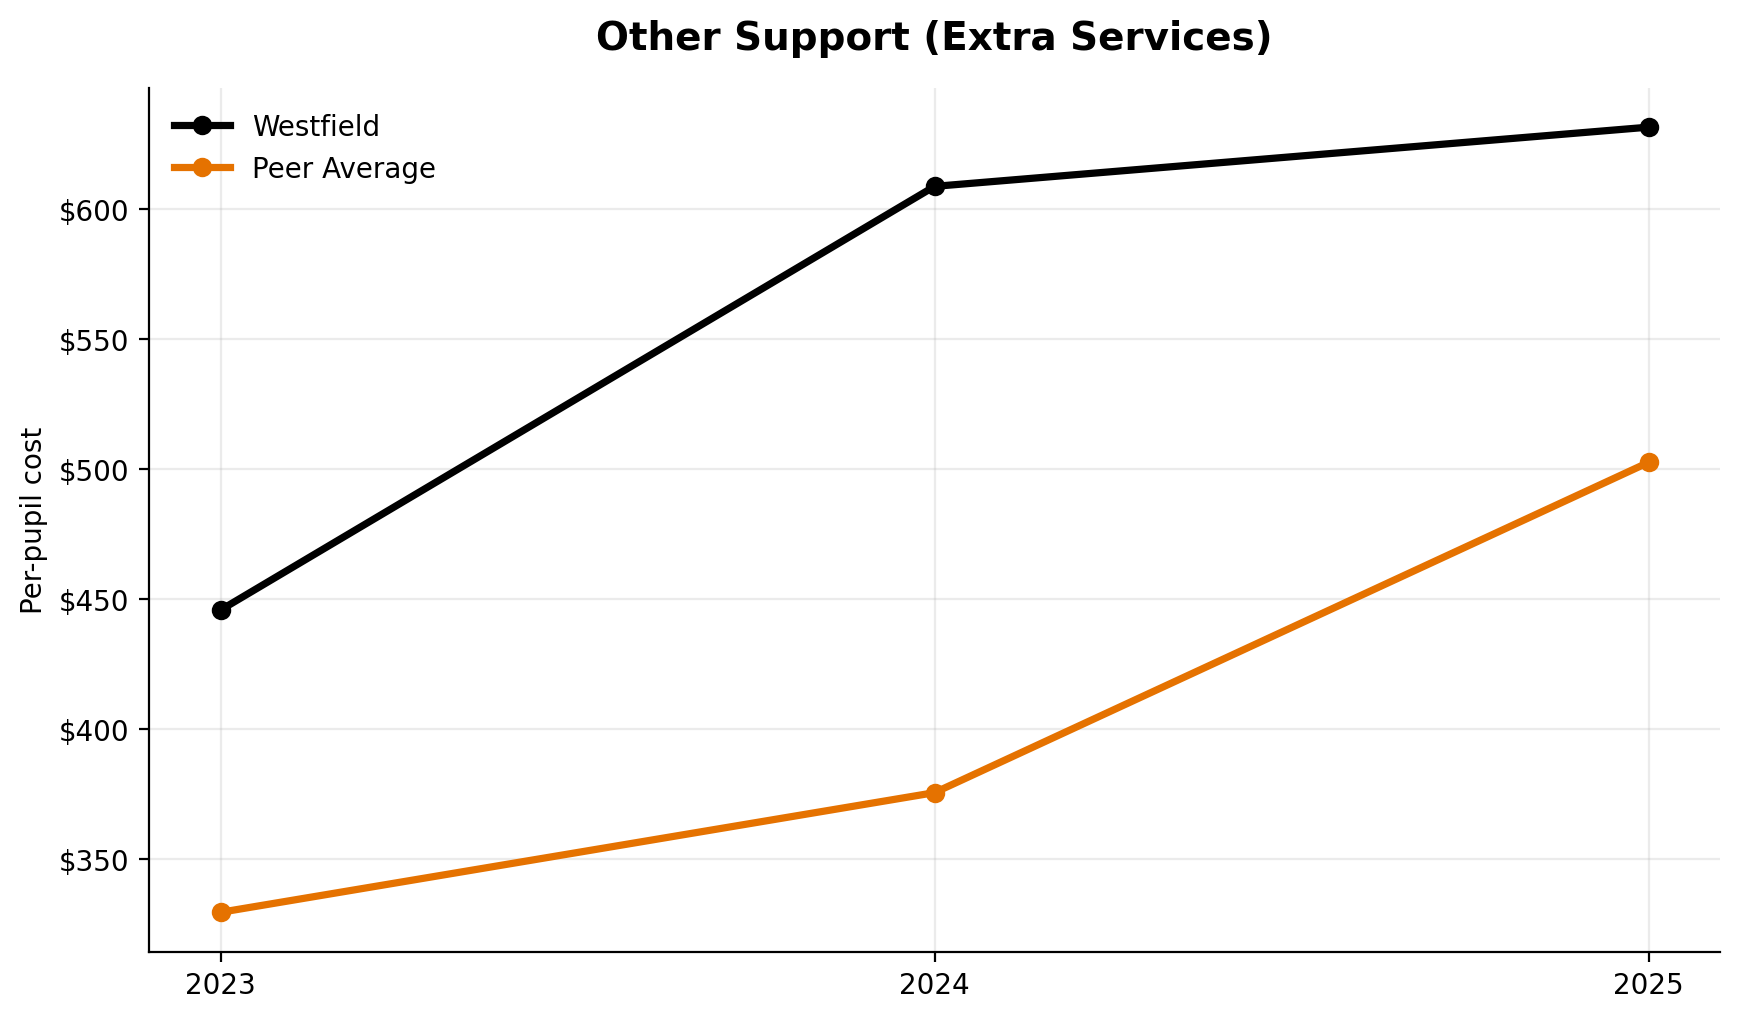
Other Support (Extra Services)
This category ranks 3rd of 7.
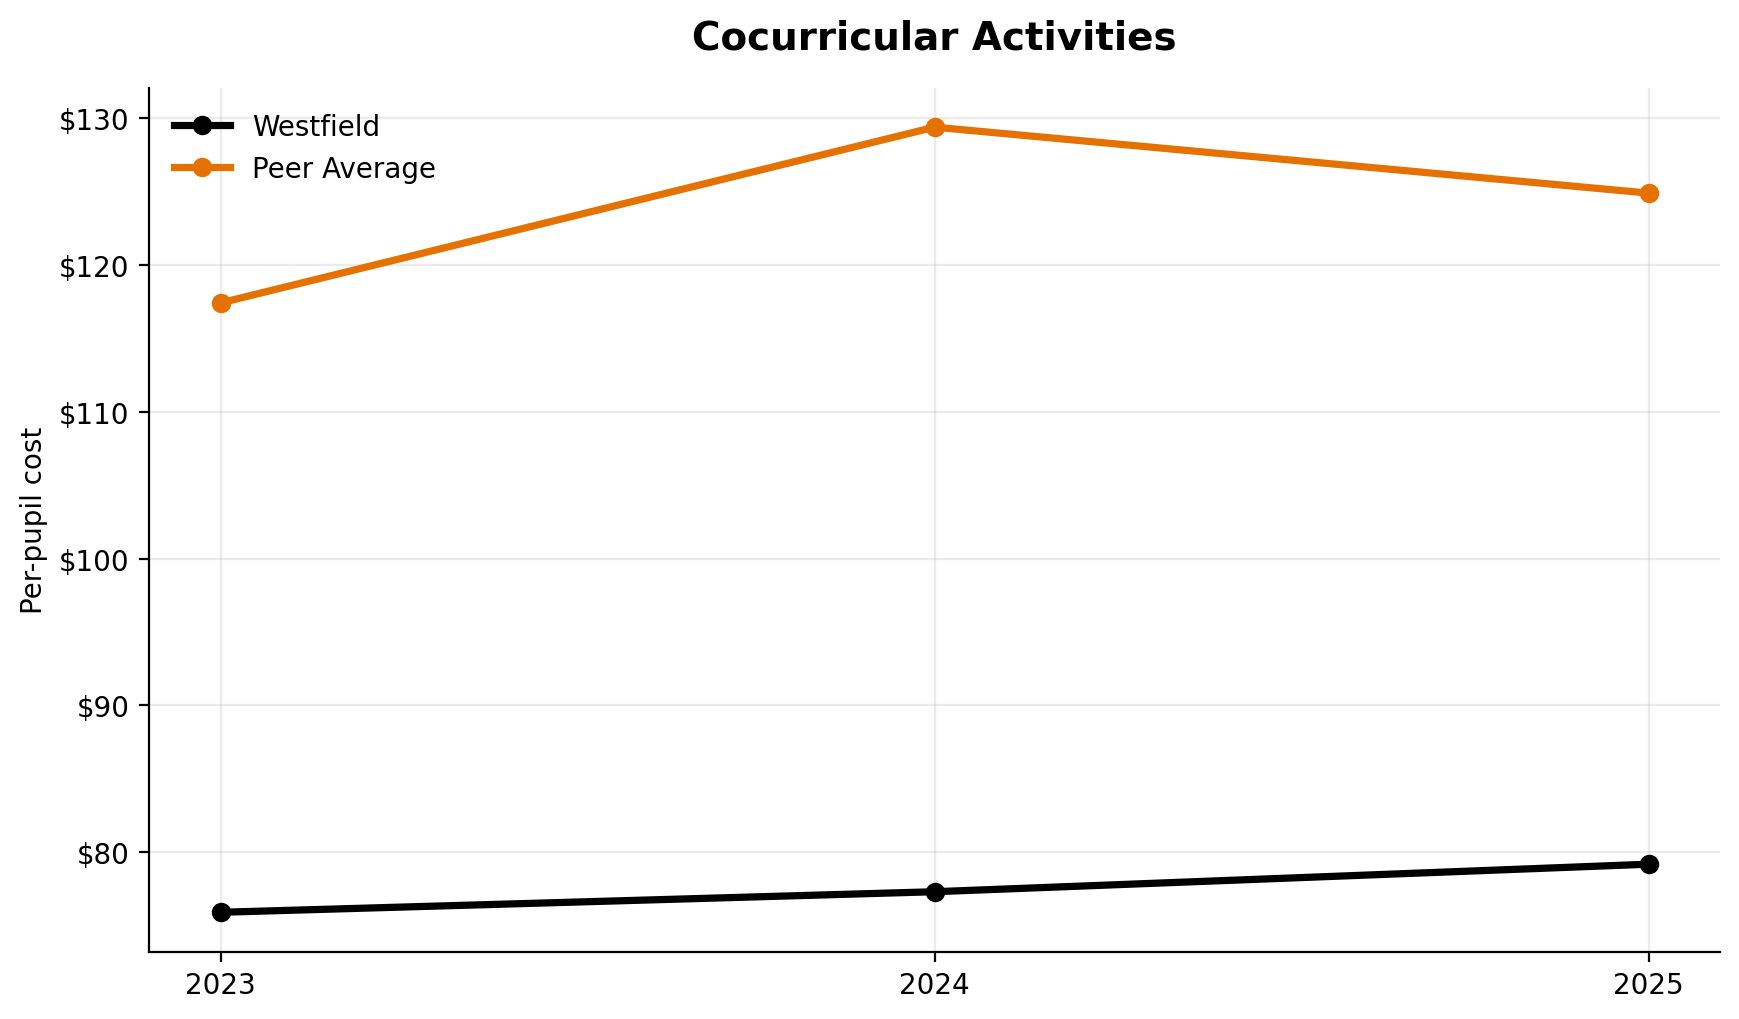
Cocurricular Activities
Cocurricular activities rank 7th of 7.
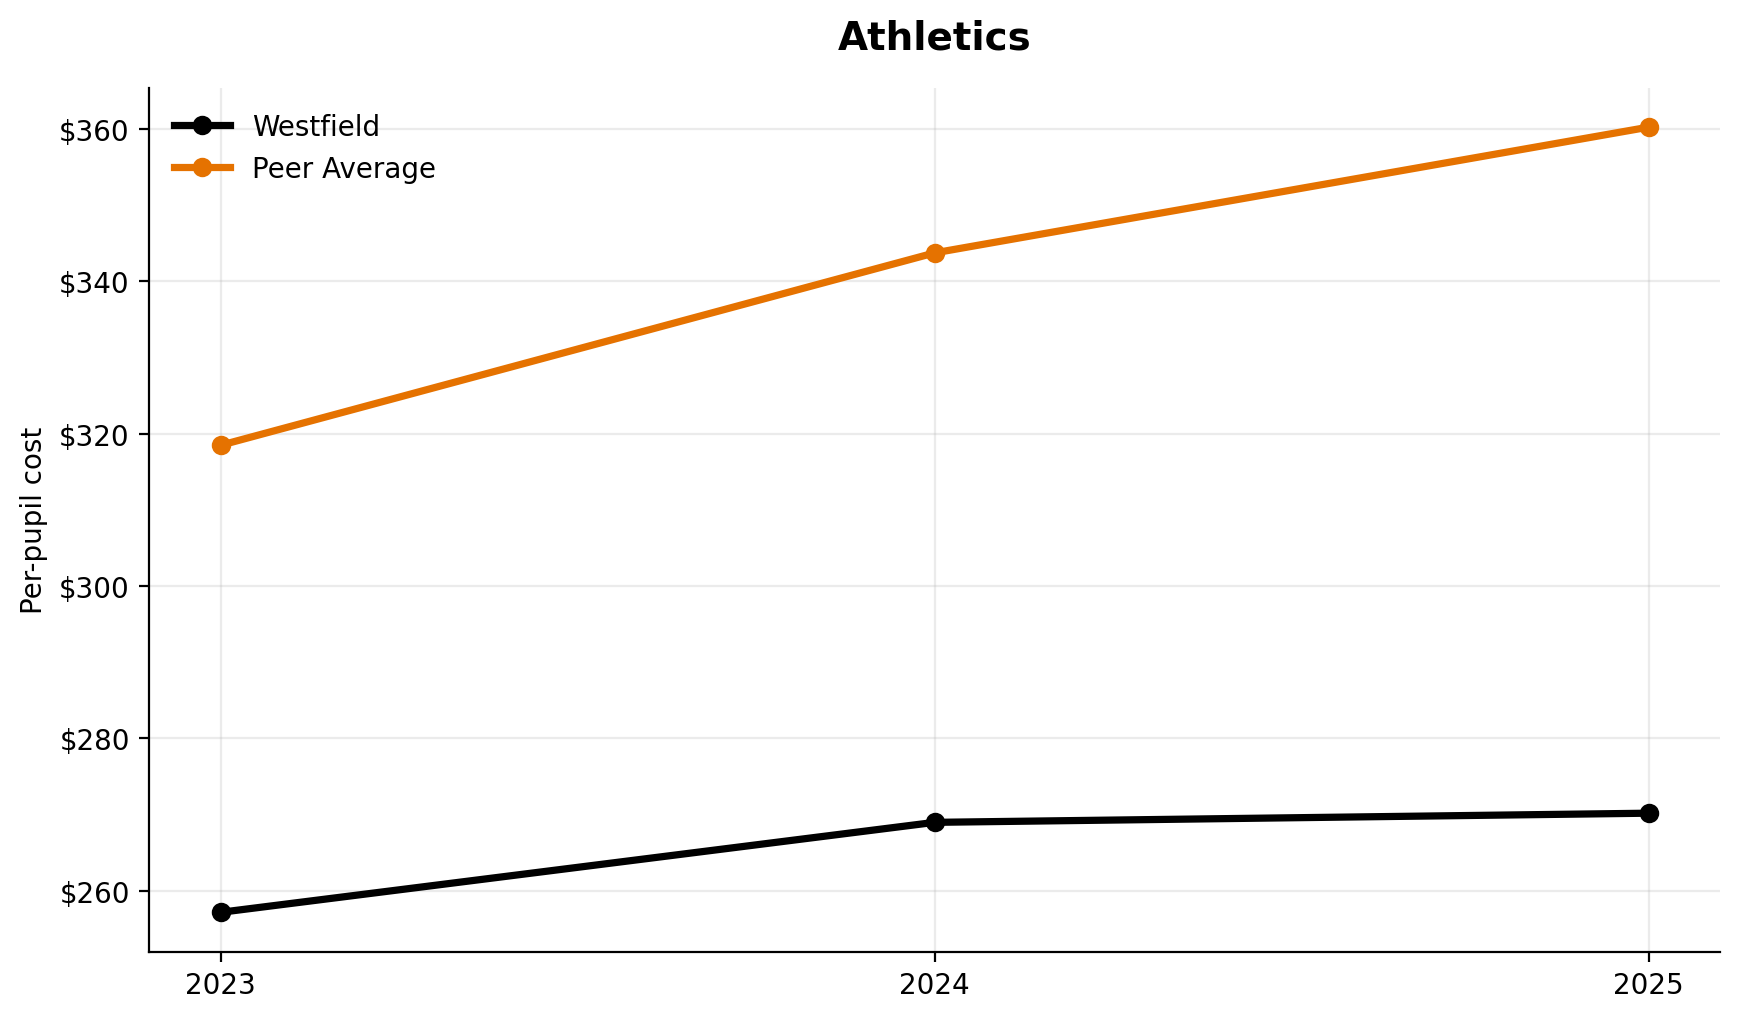
Athletics
Athletics ranks 6th of 7 among peers.
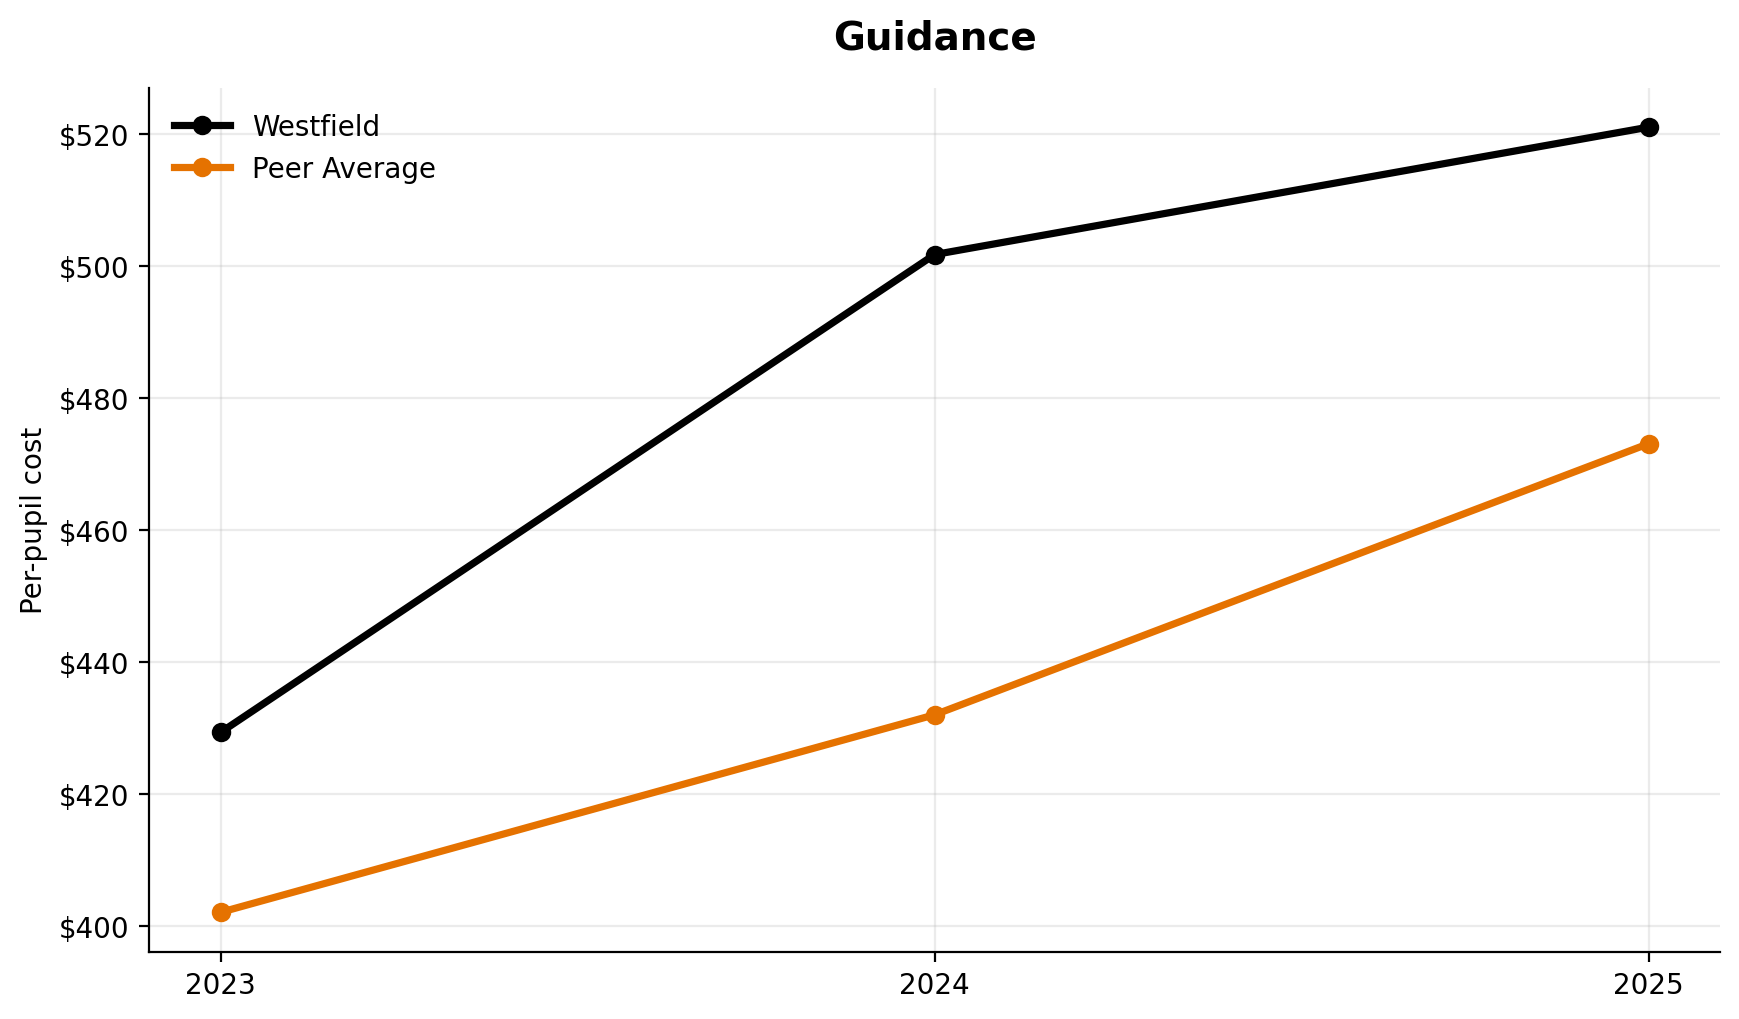
Guidance
Guidance spending ranks 3rd of 7.
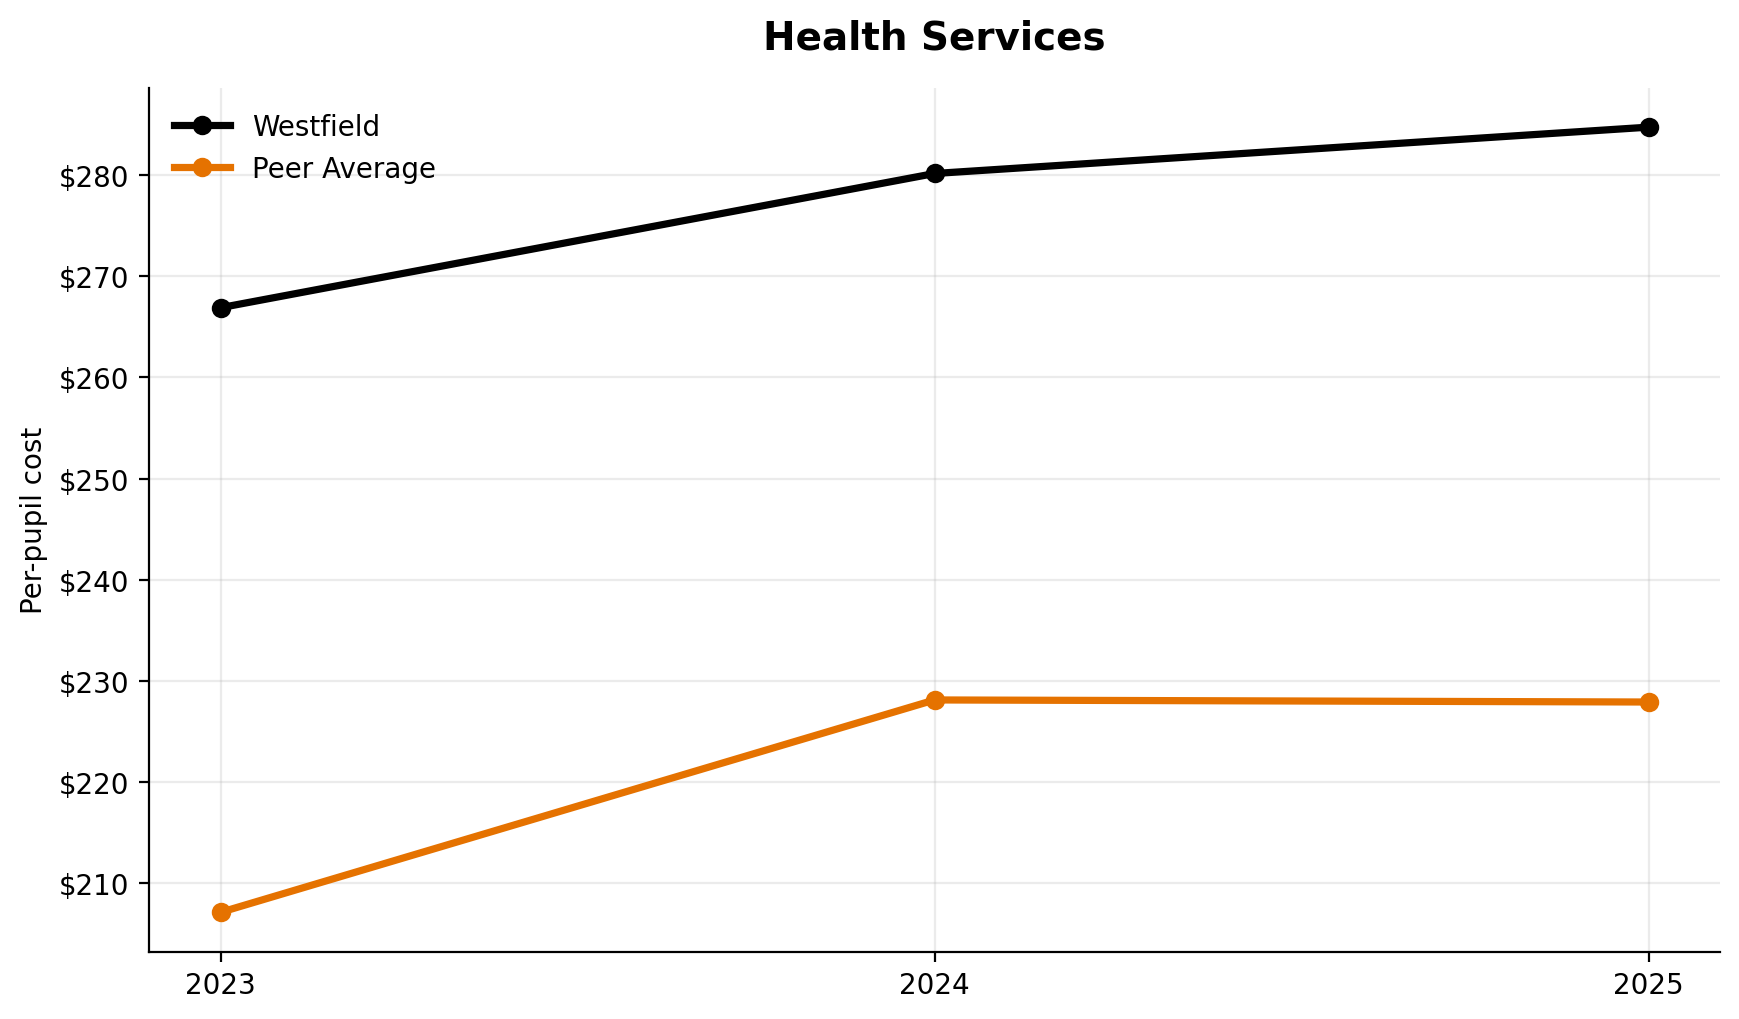
Health Services
Health services rank 2nd of 7.
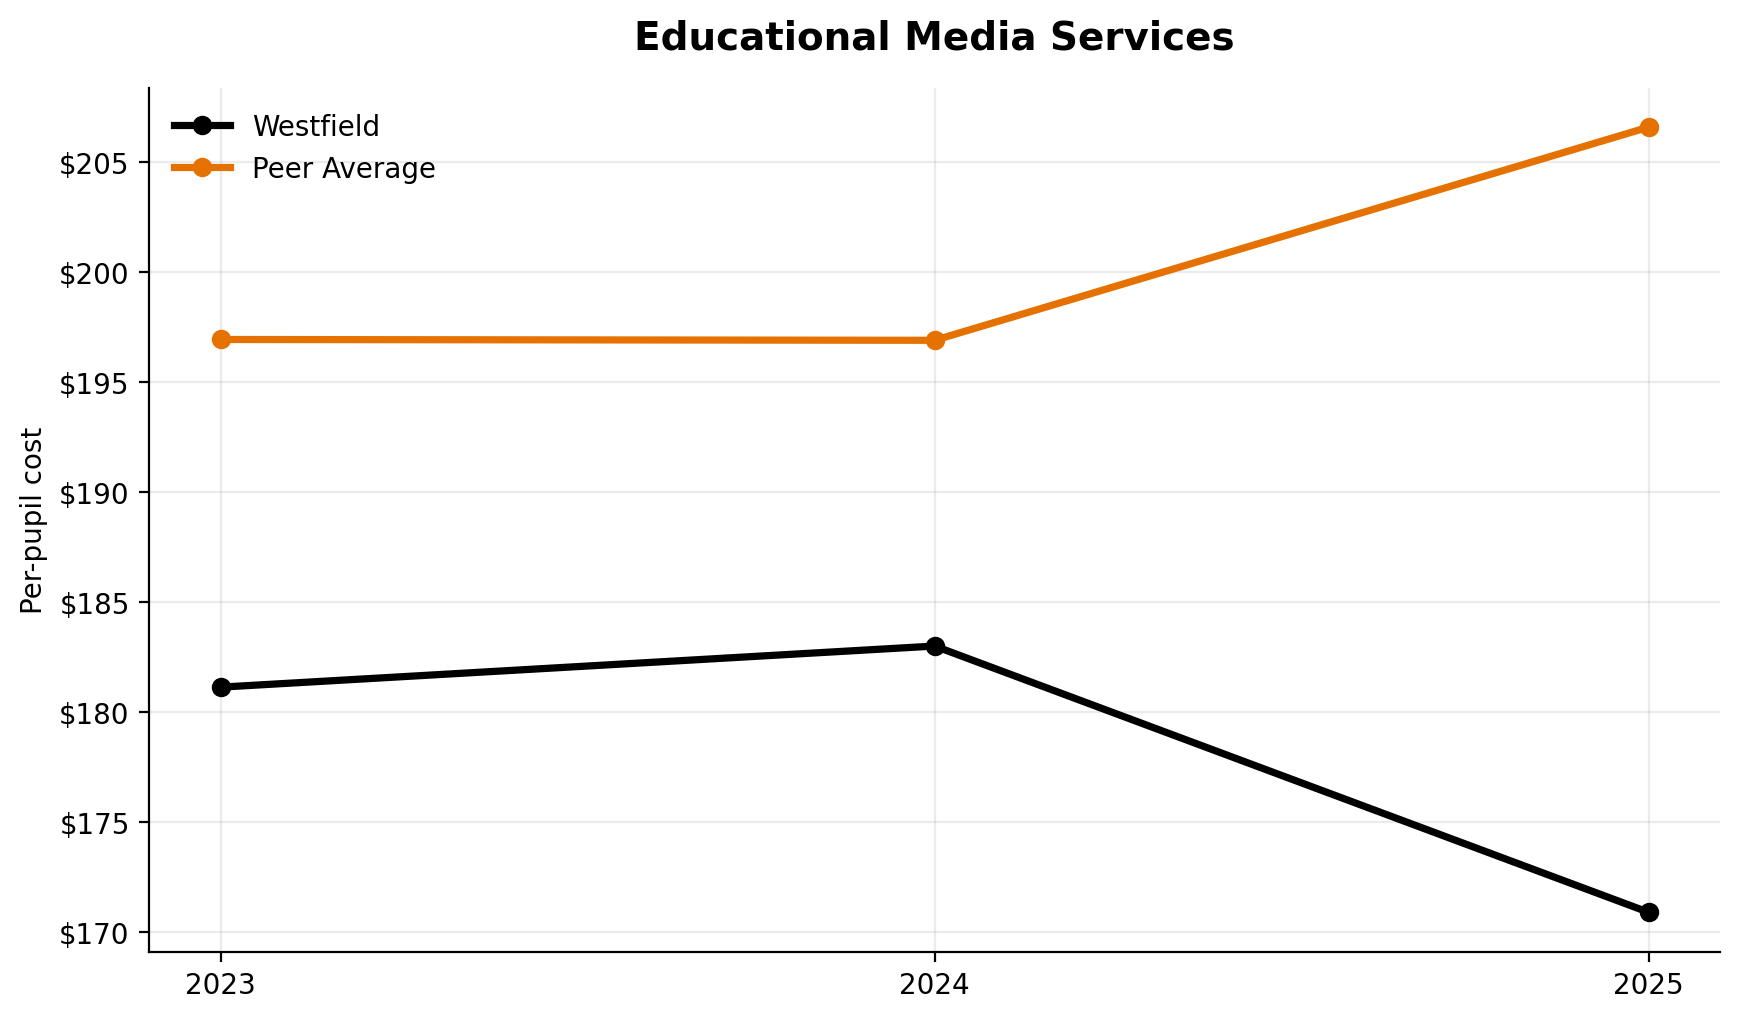
Educational Media Services
Library/media spending ranks 6th of 7.
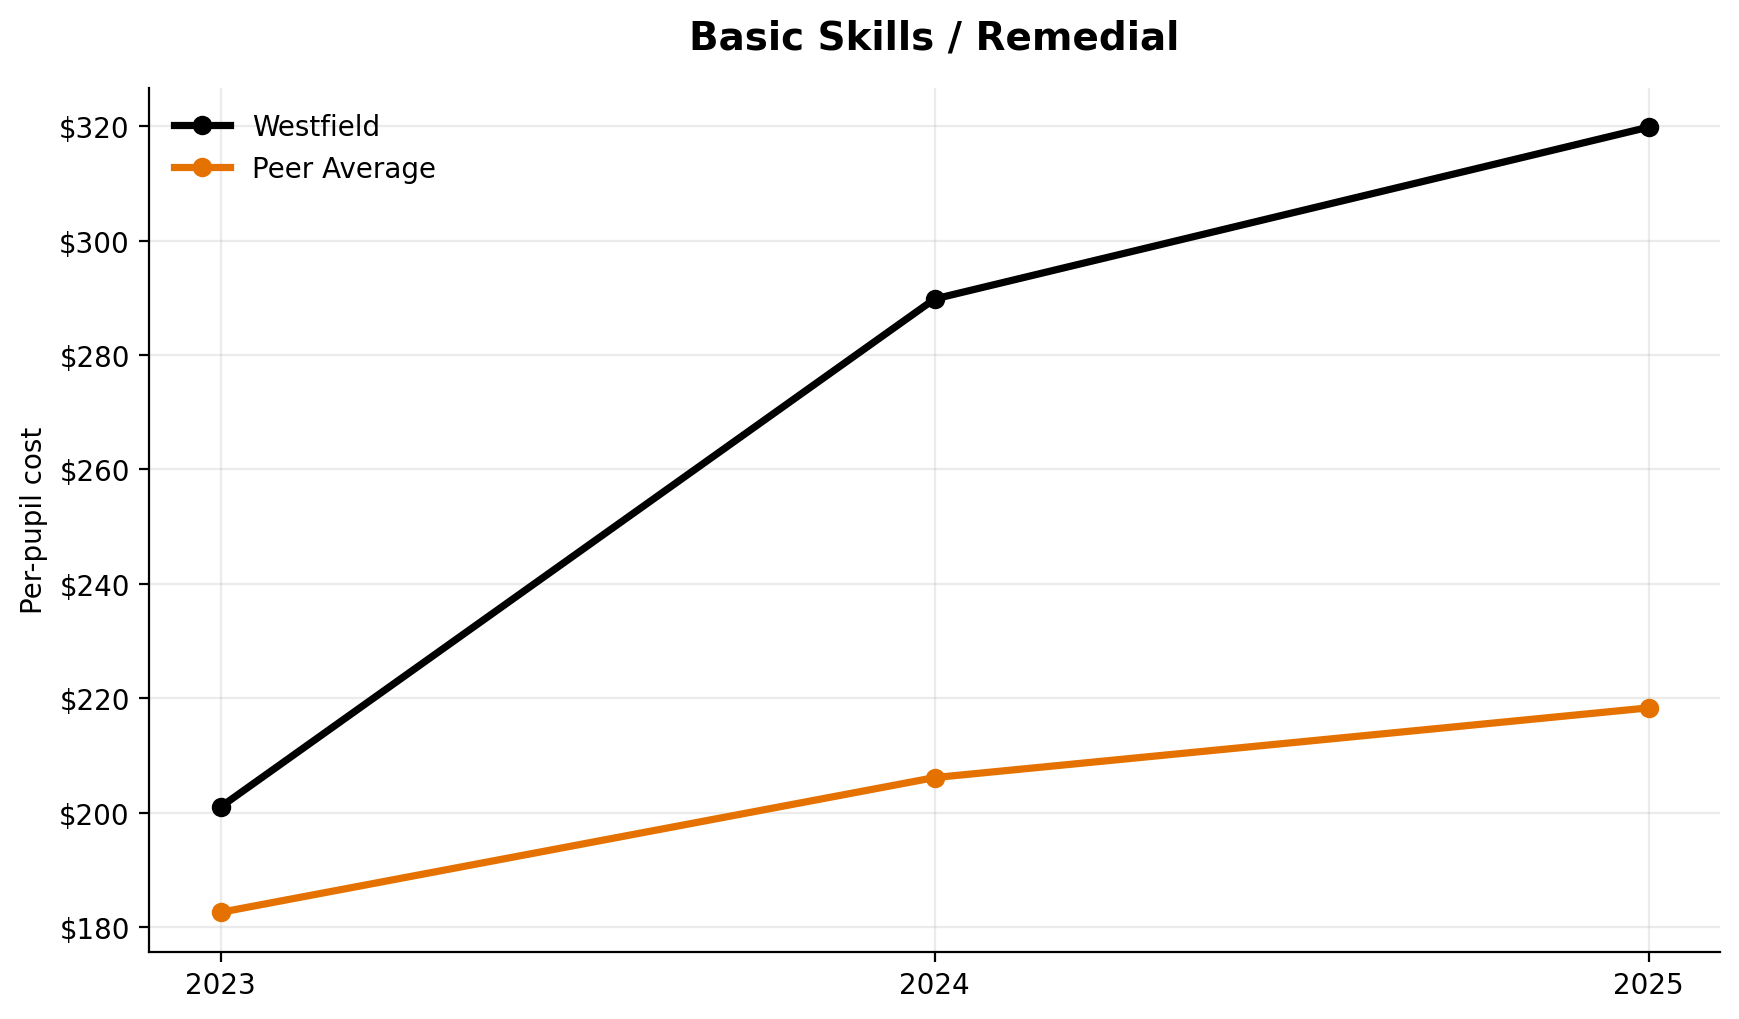
Basic Skills / Remedial
Basic skills/remedial ranks 1st of 7 and should be judged by actual student need and results, not rank alone.
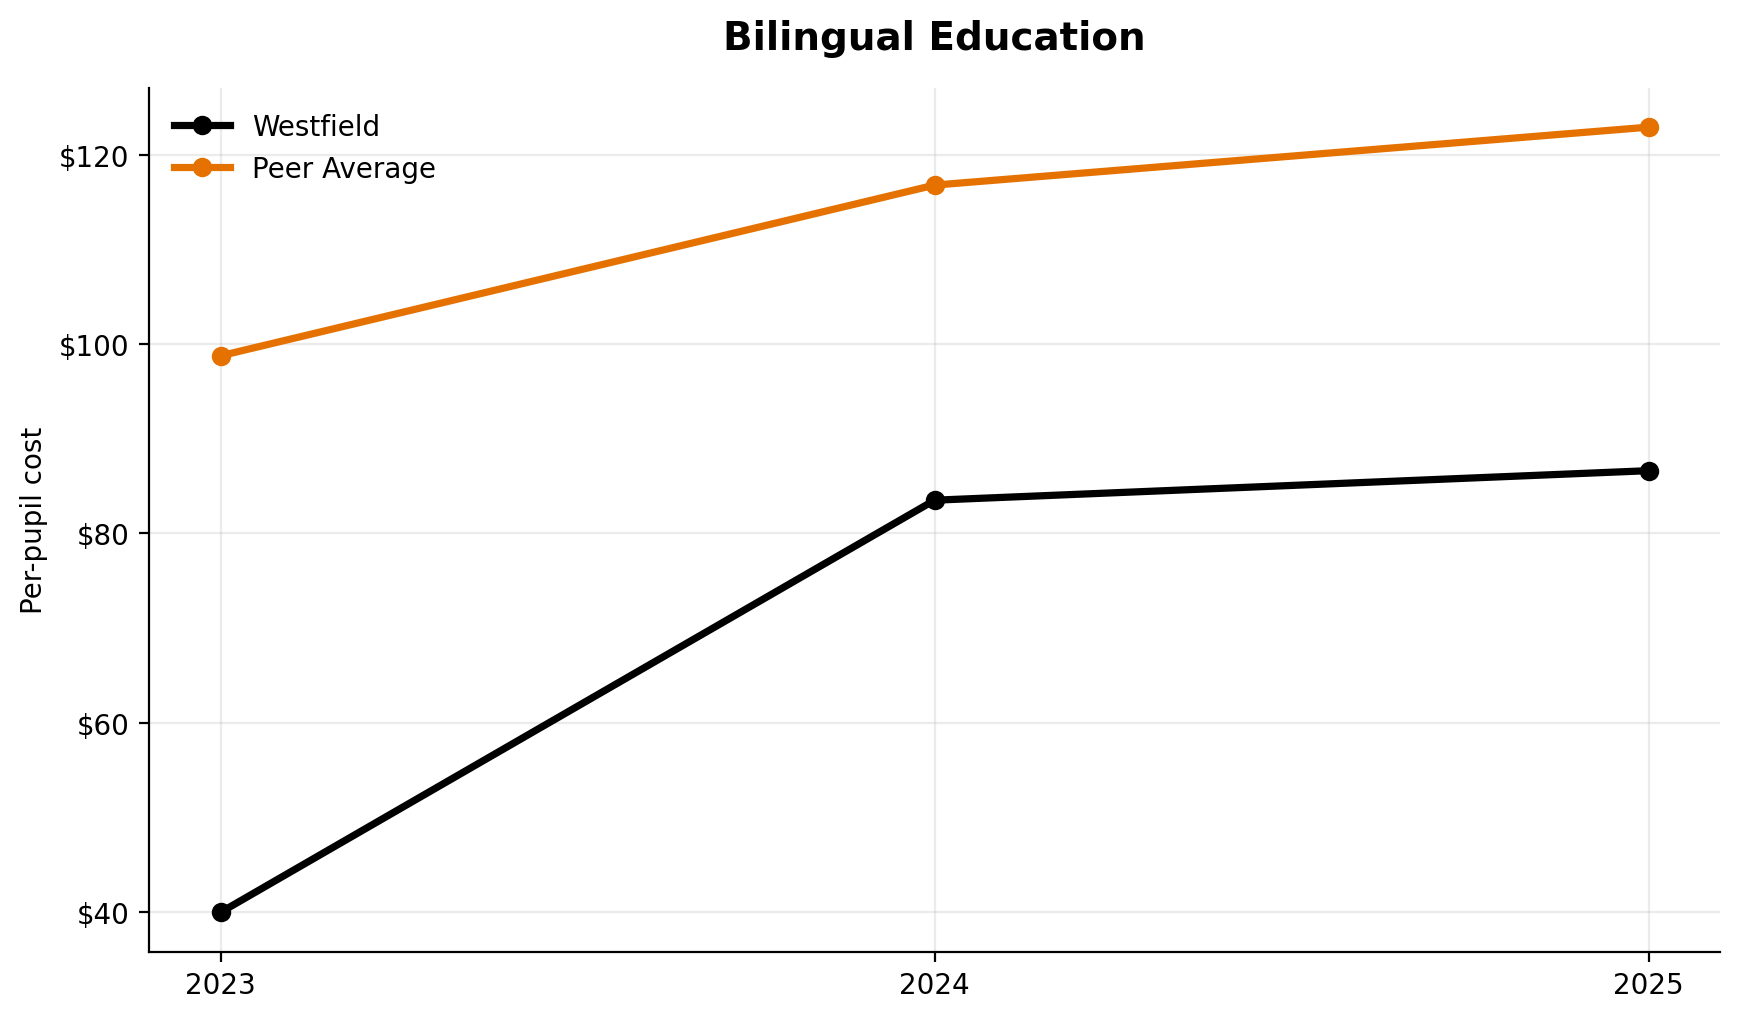
Bilingual Education
Bilingual education ranks 6th of 7.
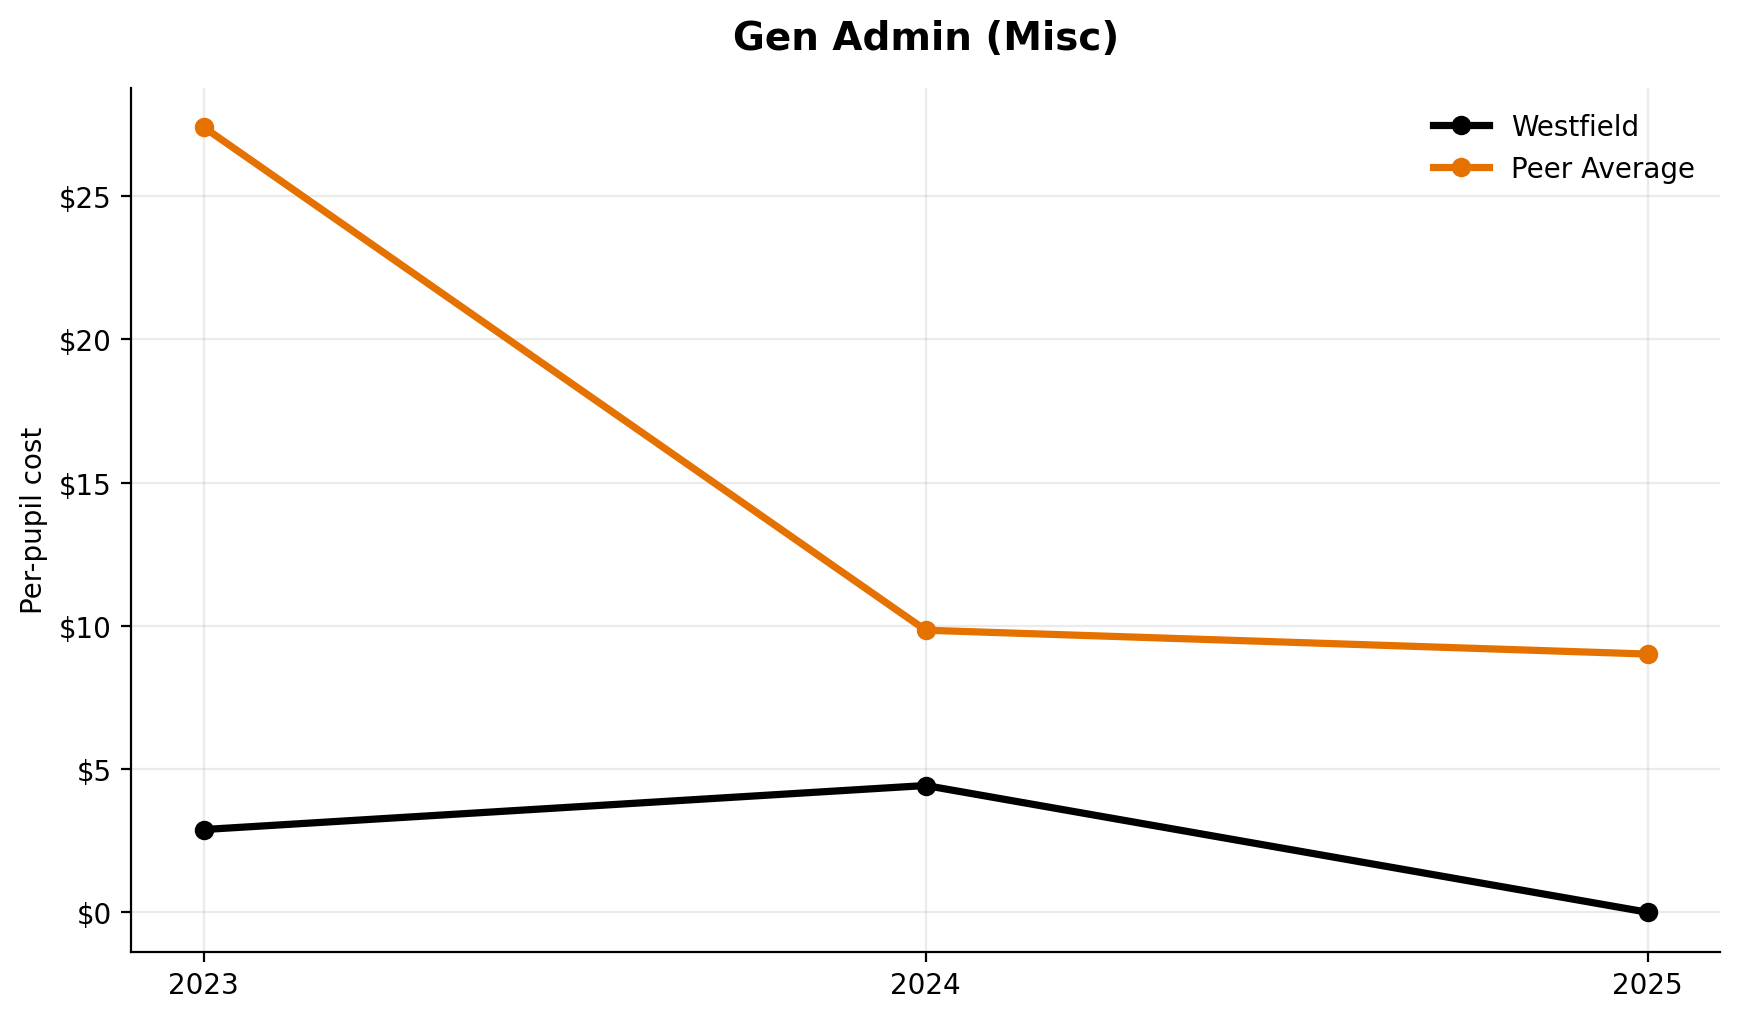
Gen Admin (Misc)
This line item ranks 6th of 7.
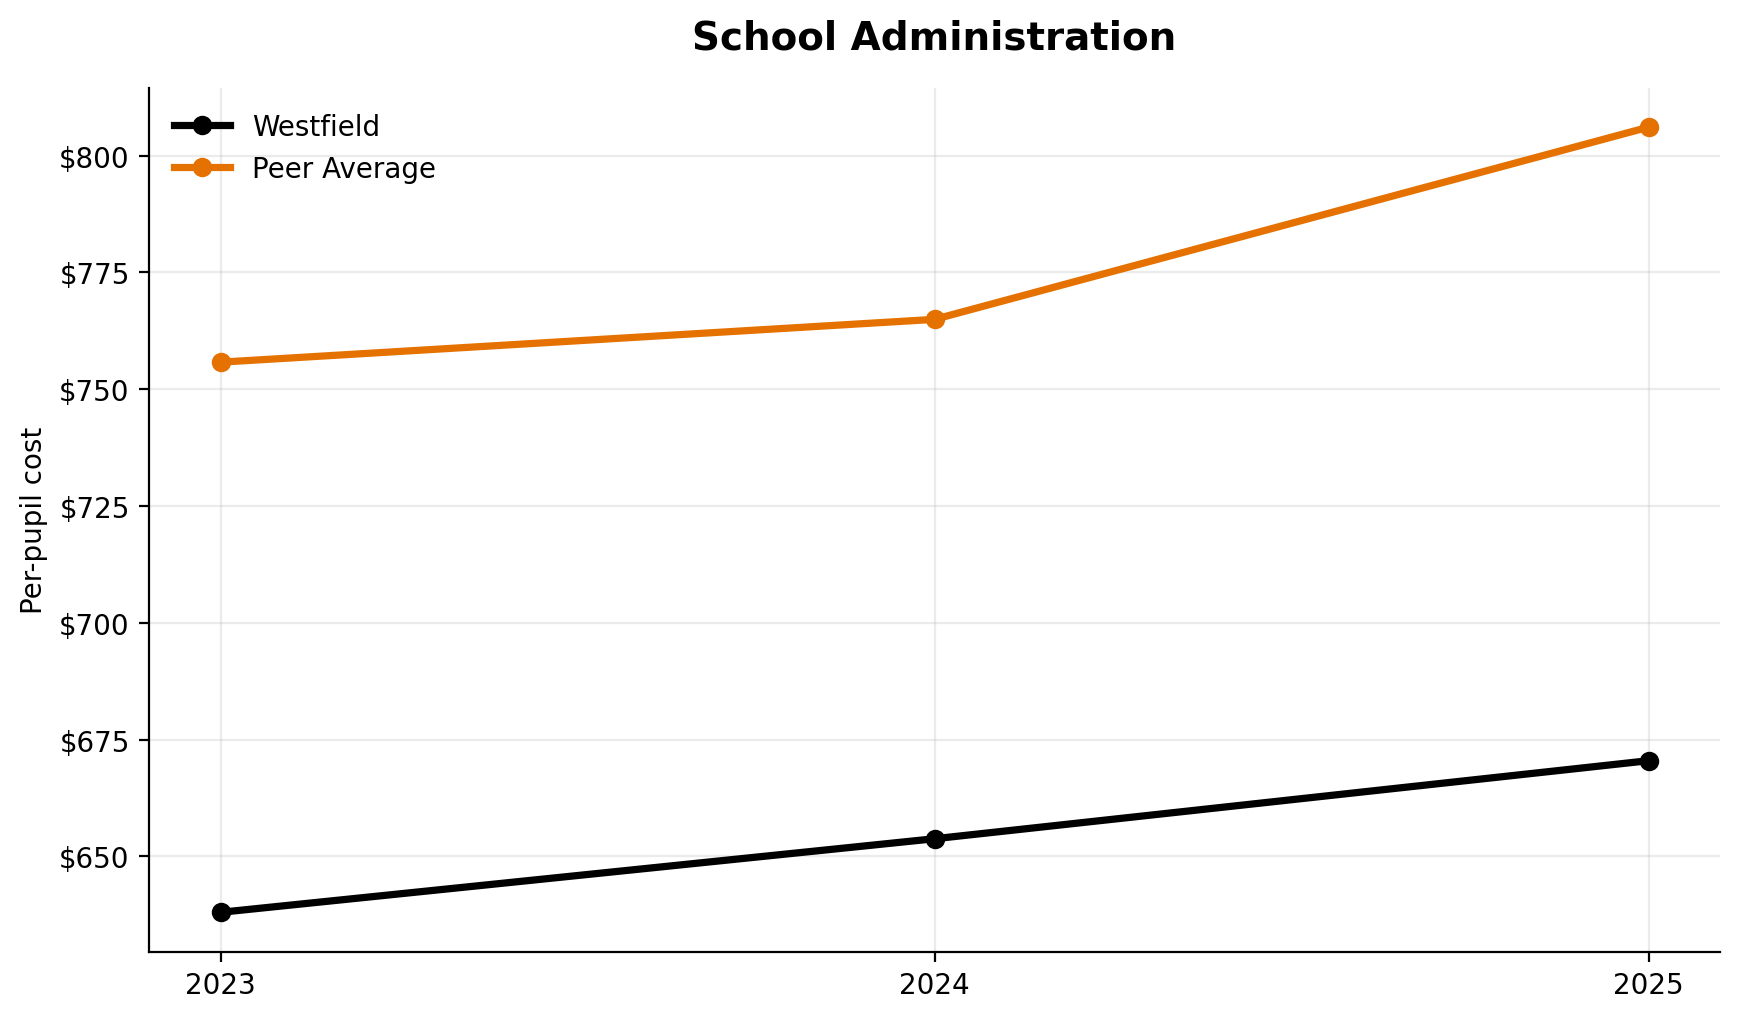
School Administration
School administration ranks 7th of 7.
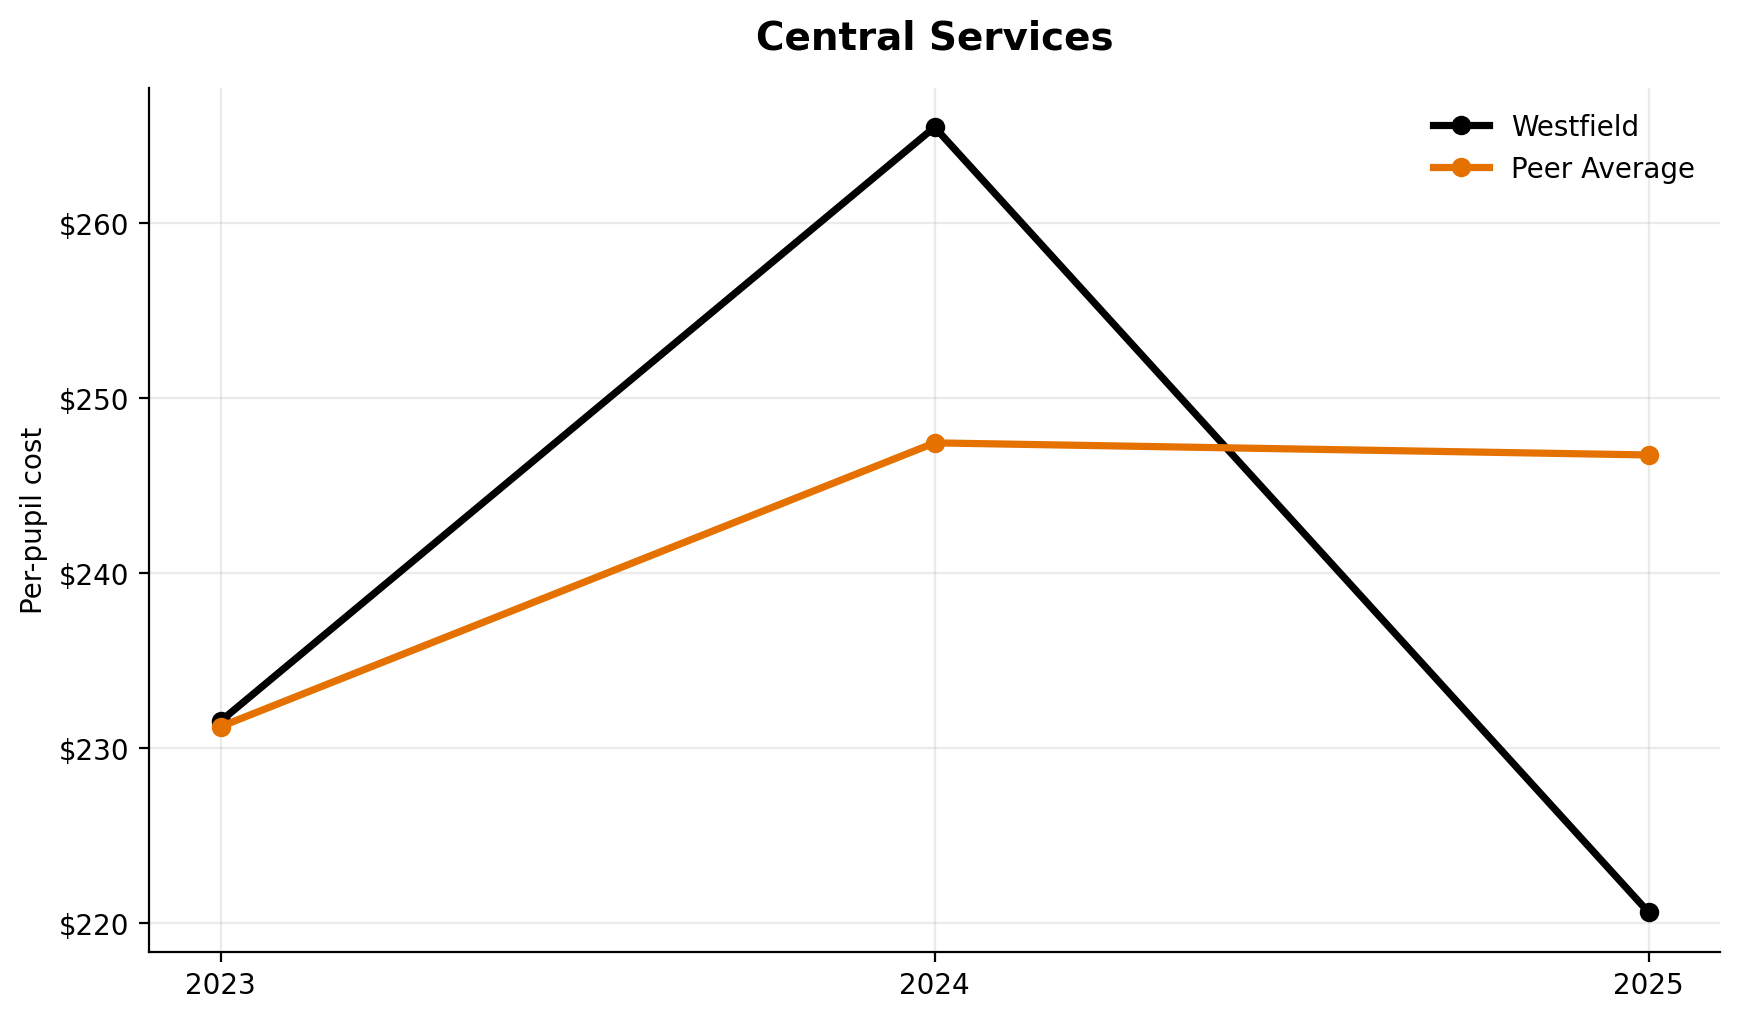
Central Services
Central services rank 5th of 7.
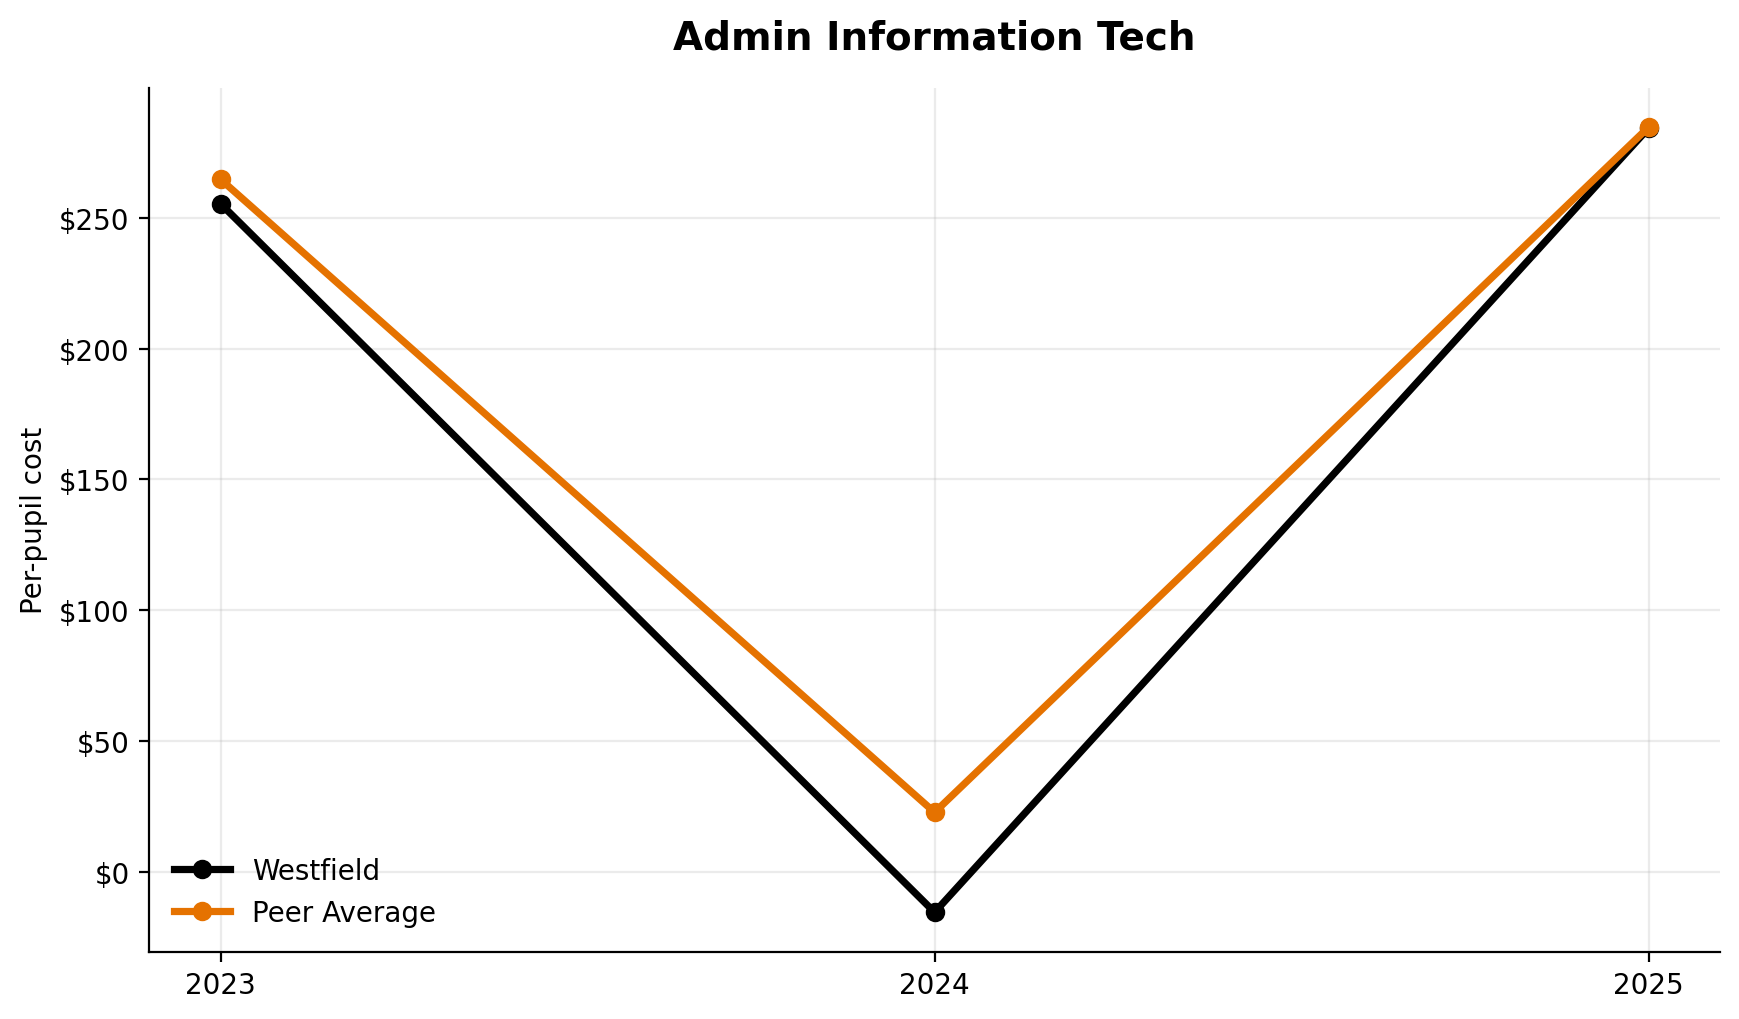
Admin Information Tech
Administrative information technology ranks 3rd of 7.
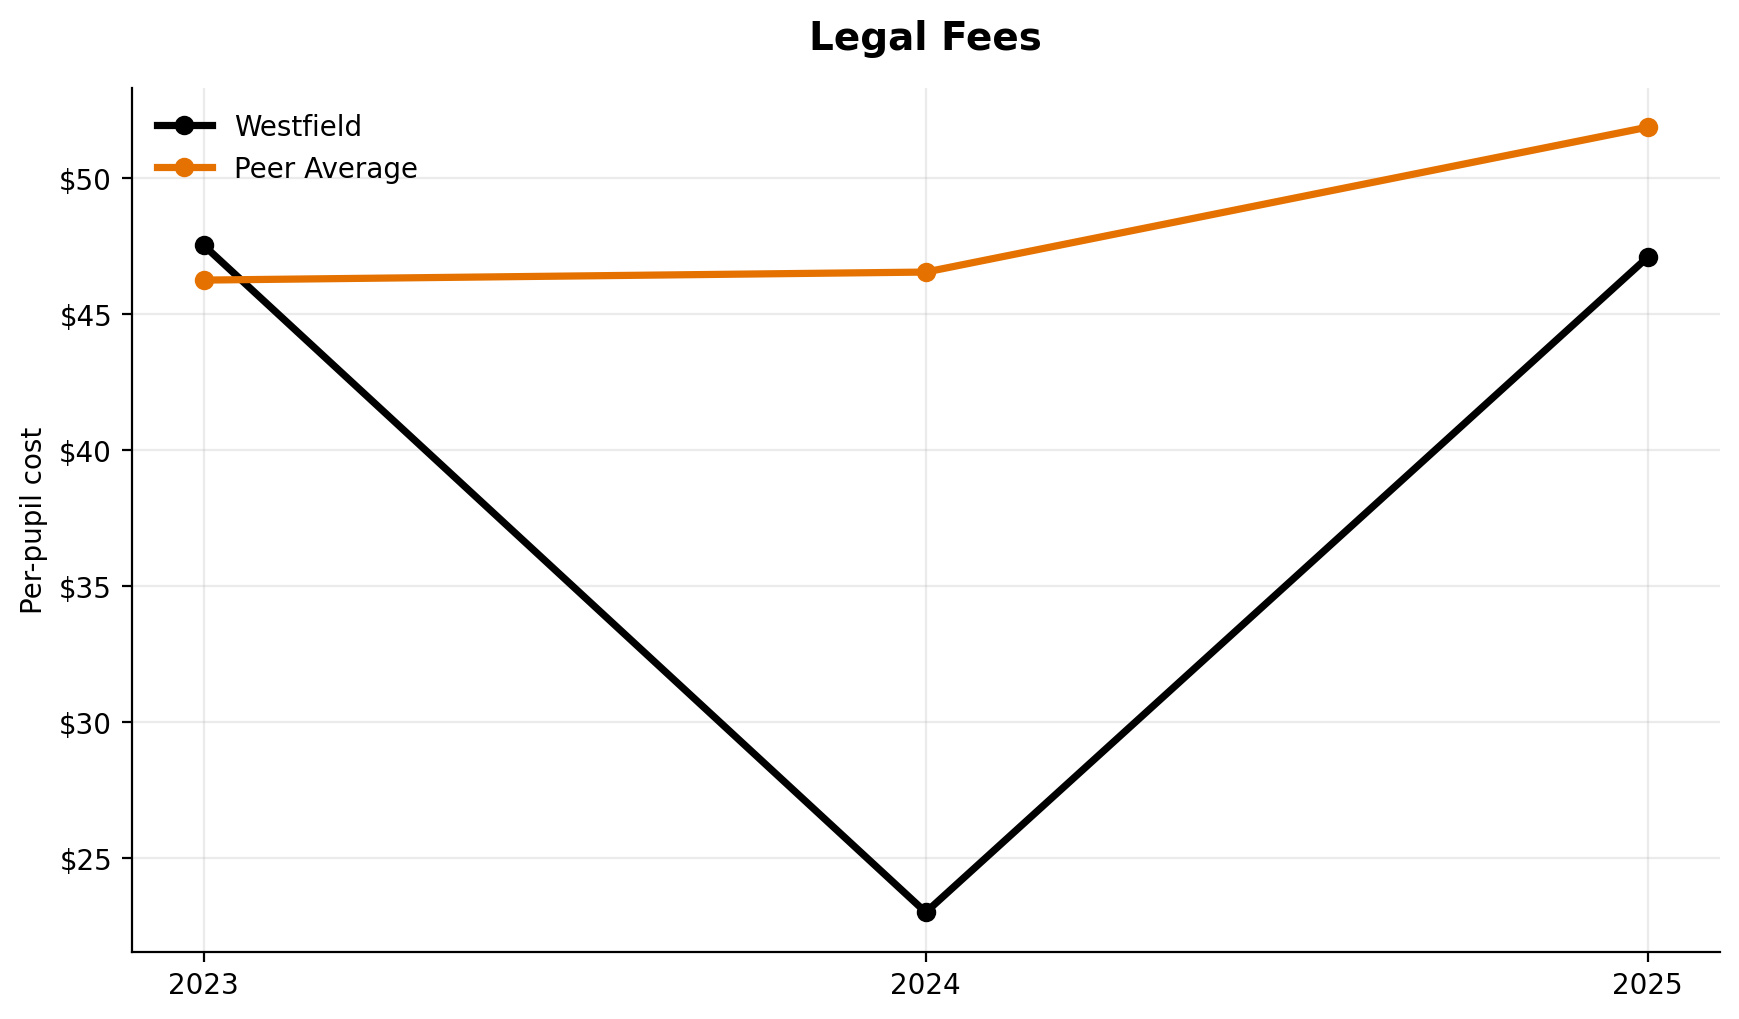
Legal Fees
Legal fees rank 4th of 7.
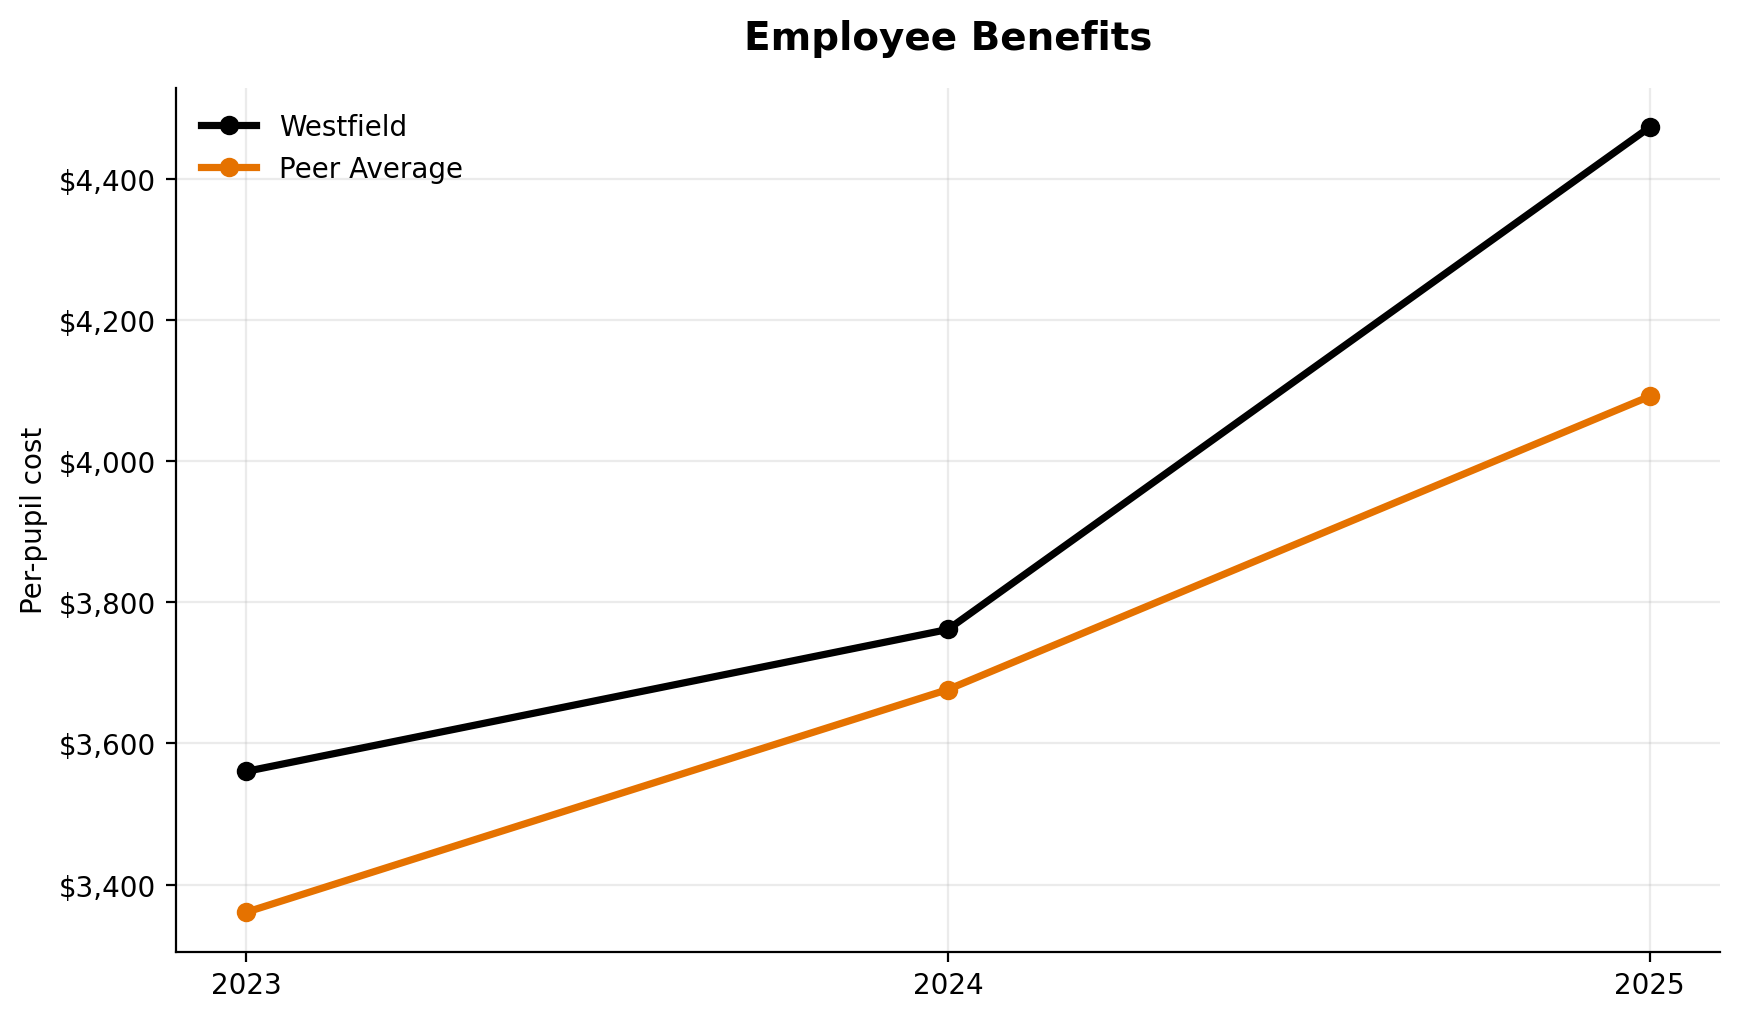
Employee Benefits
Employee benefits rank 2nd of 7.
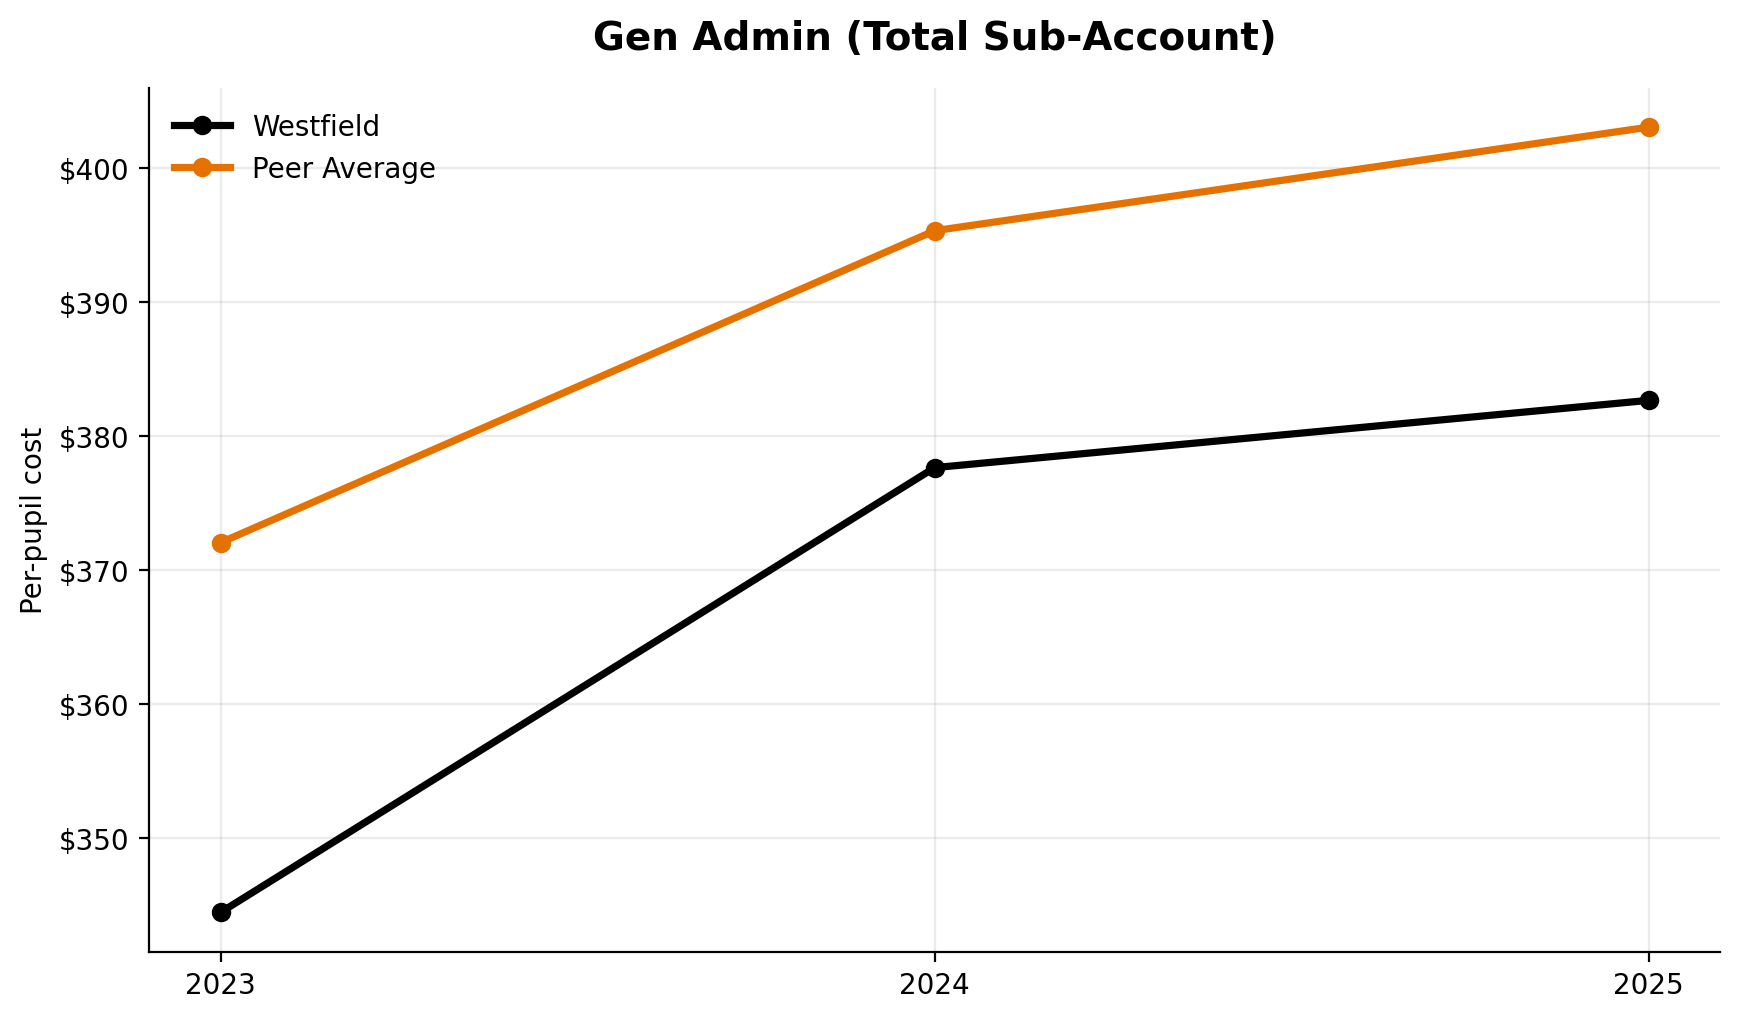
Gen Admin (Total Sub-Account)
This broader admin bucket ranks 4th of 7.
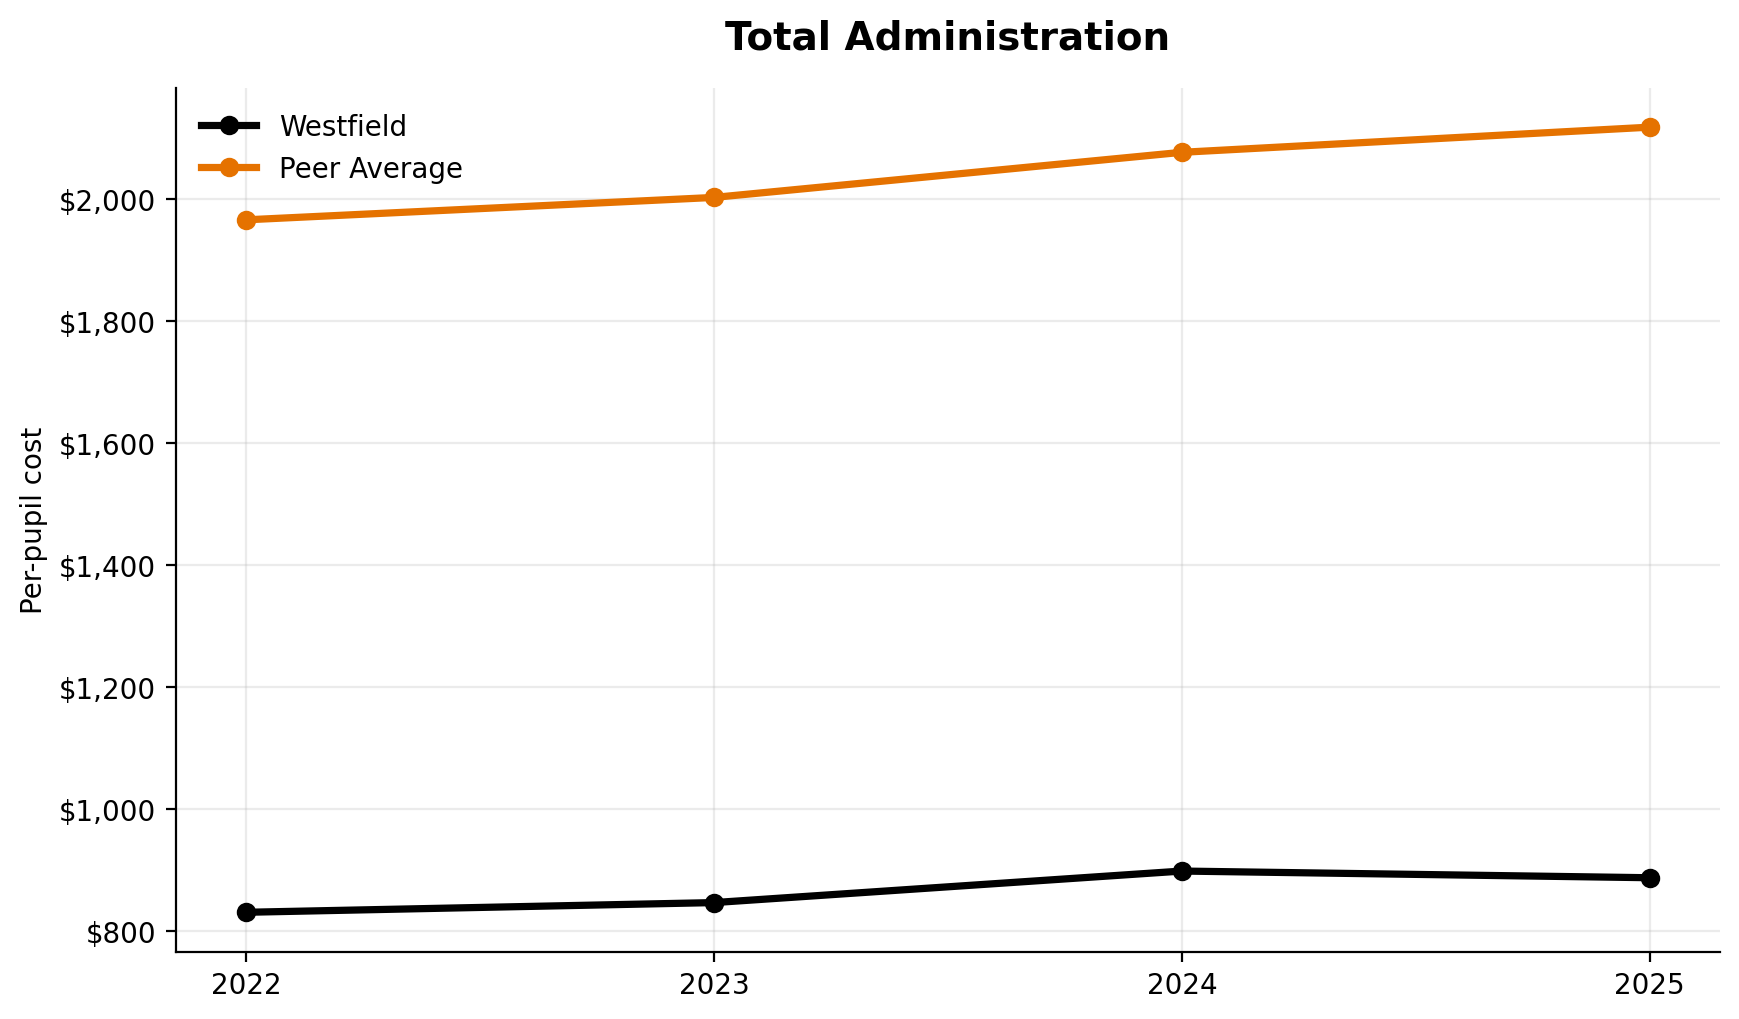
Total Administration
Total administration ranks 7th of 7 overall.
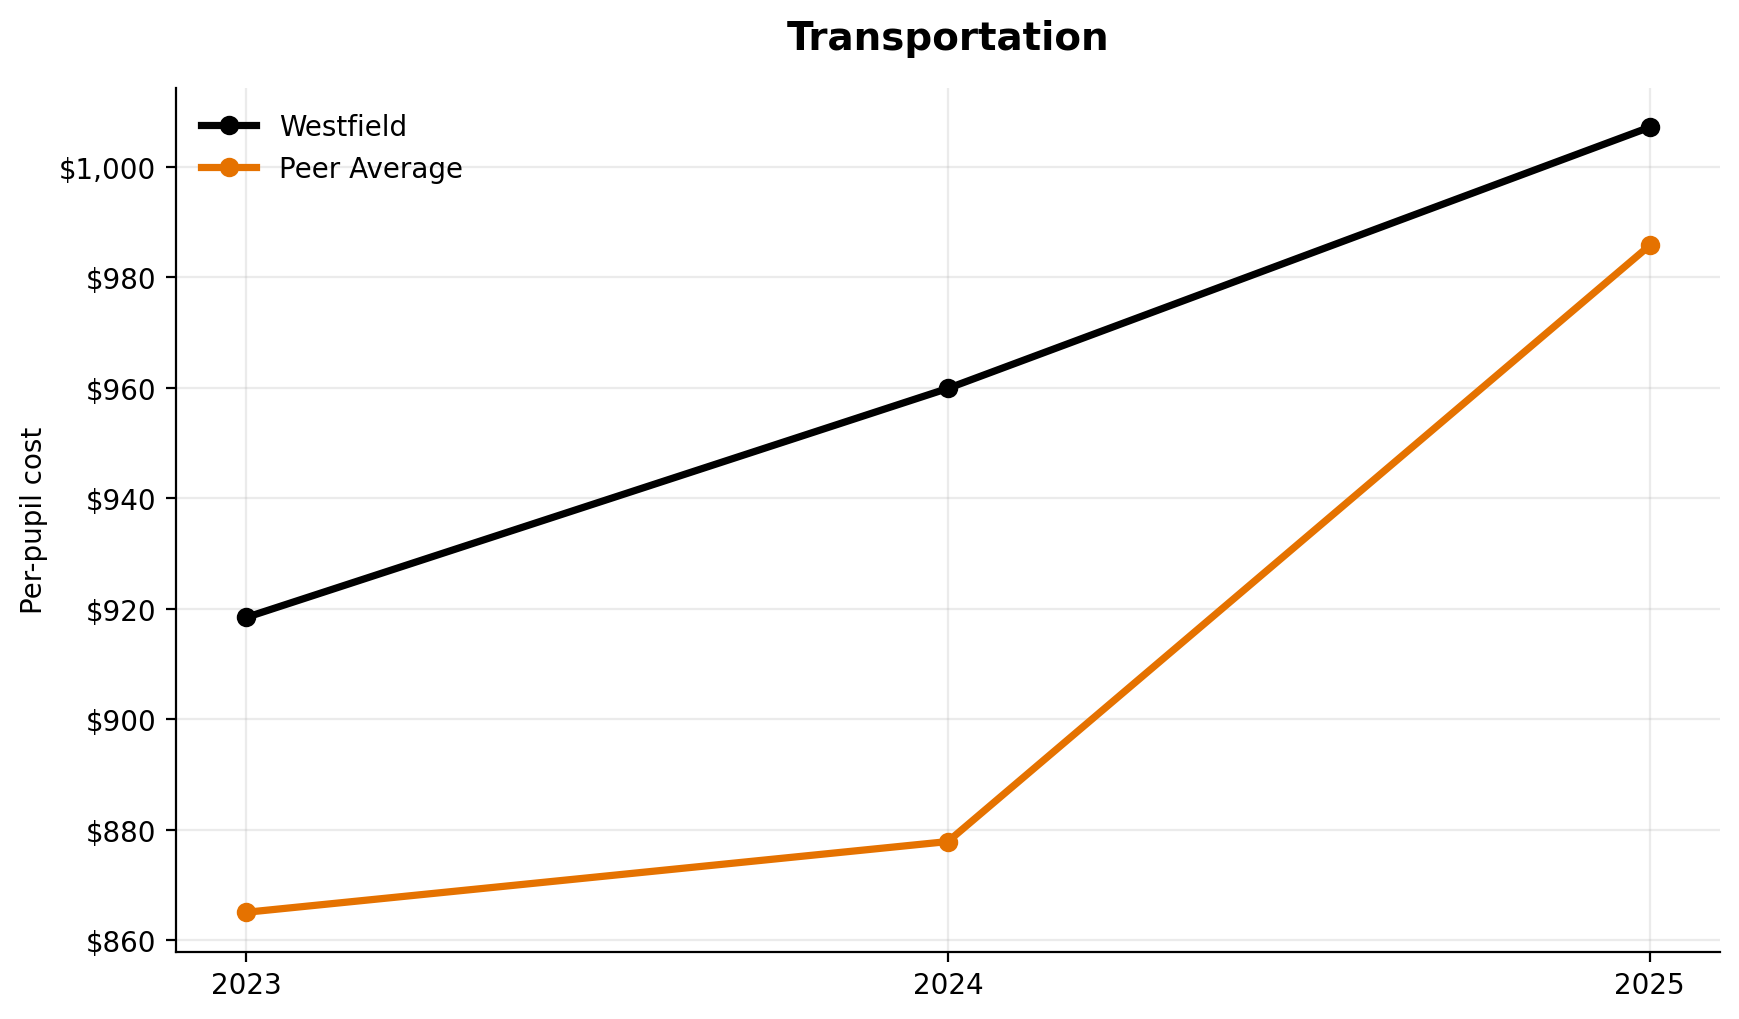
Transportation
Transportation ranks 5th of 7.
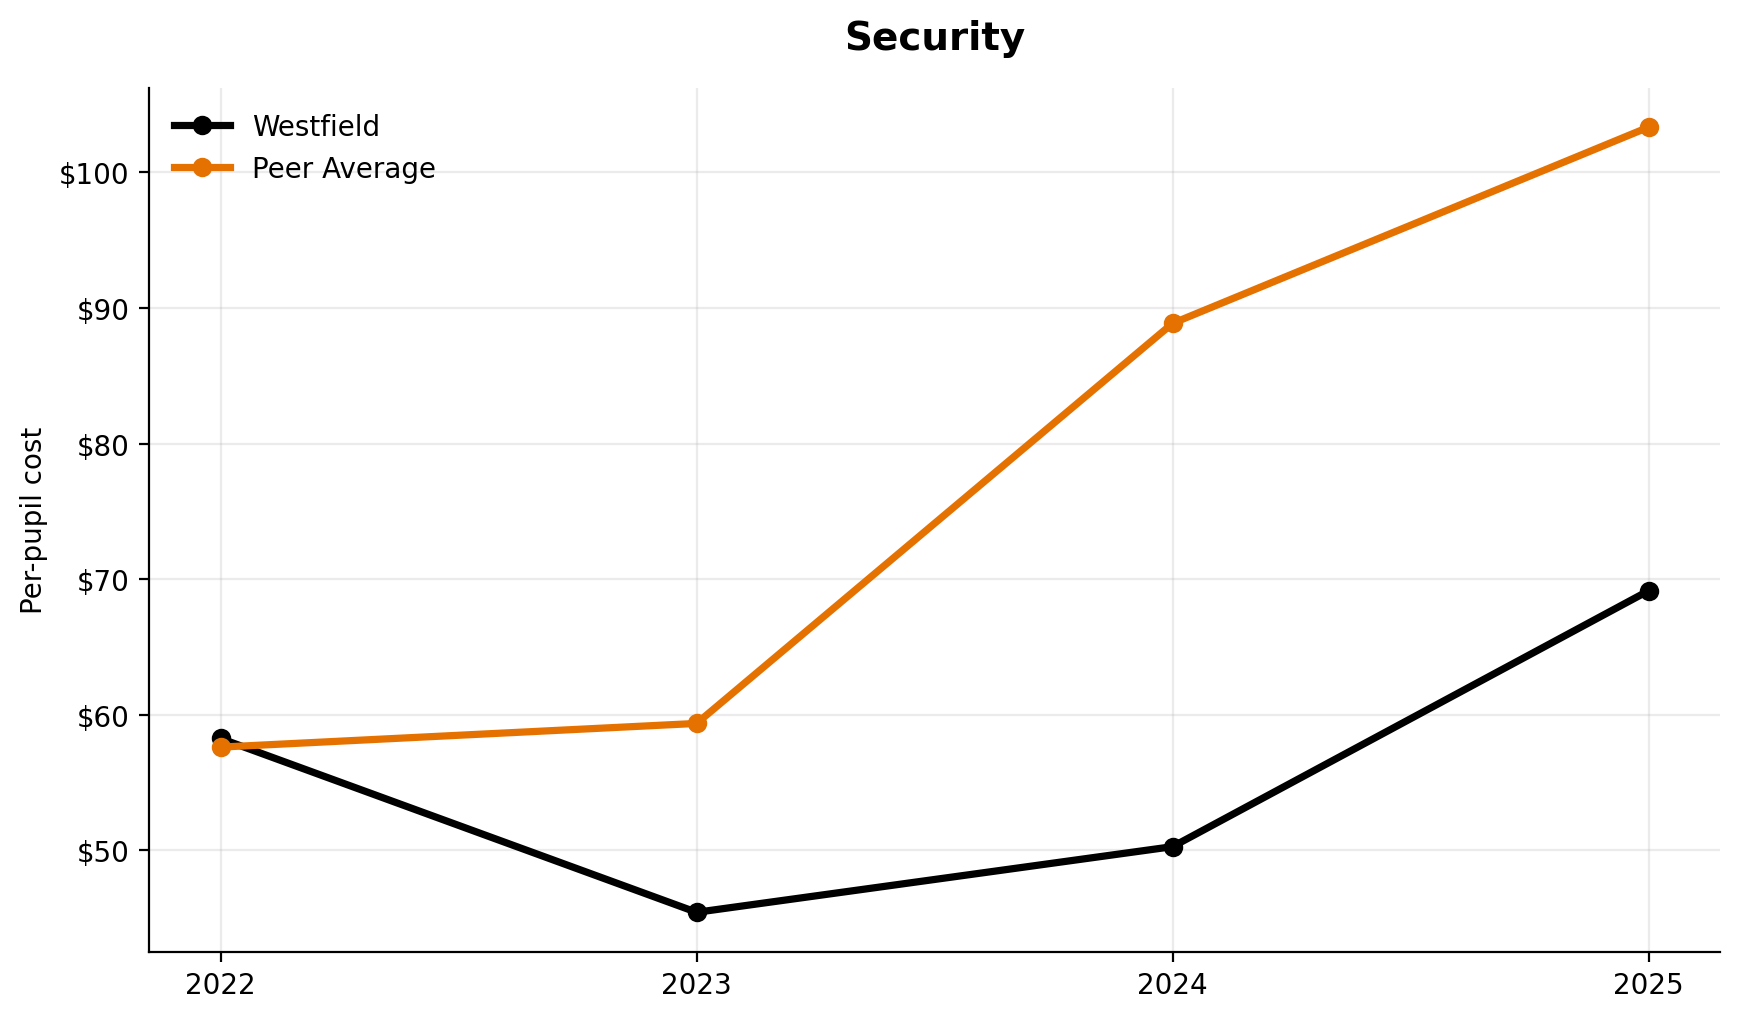
Security
Security ranks 4th of 7 and uses a 2022-2025 per-pupil trend.
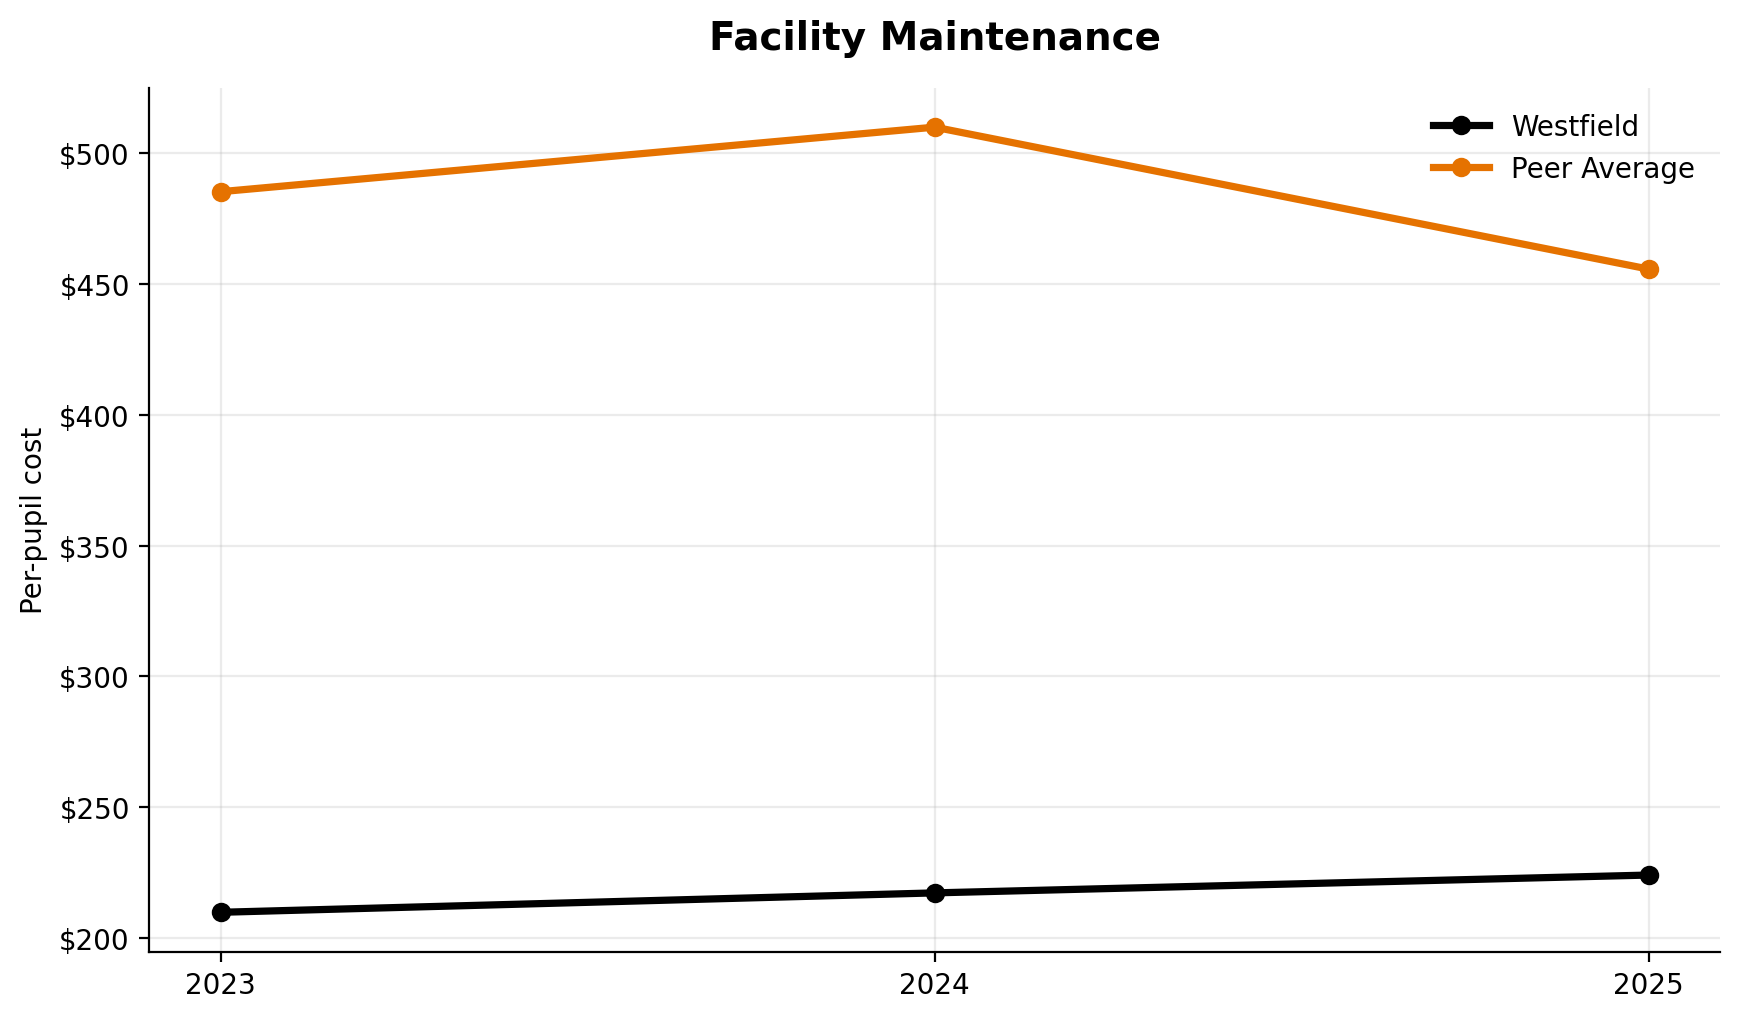
Facility Maintenance
Facility maintenance ranks 7th of 7.
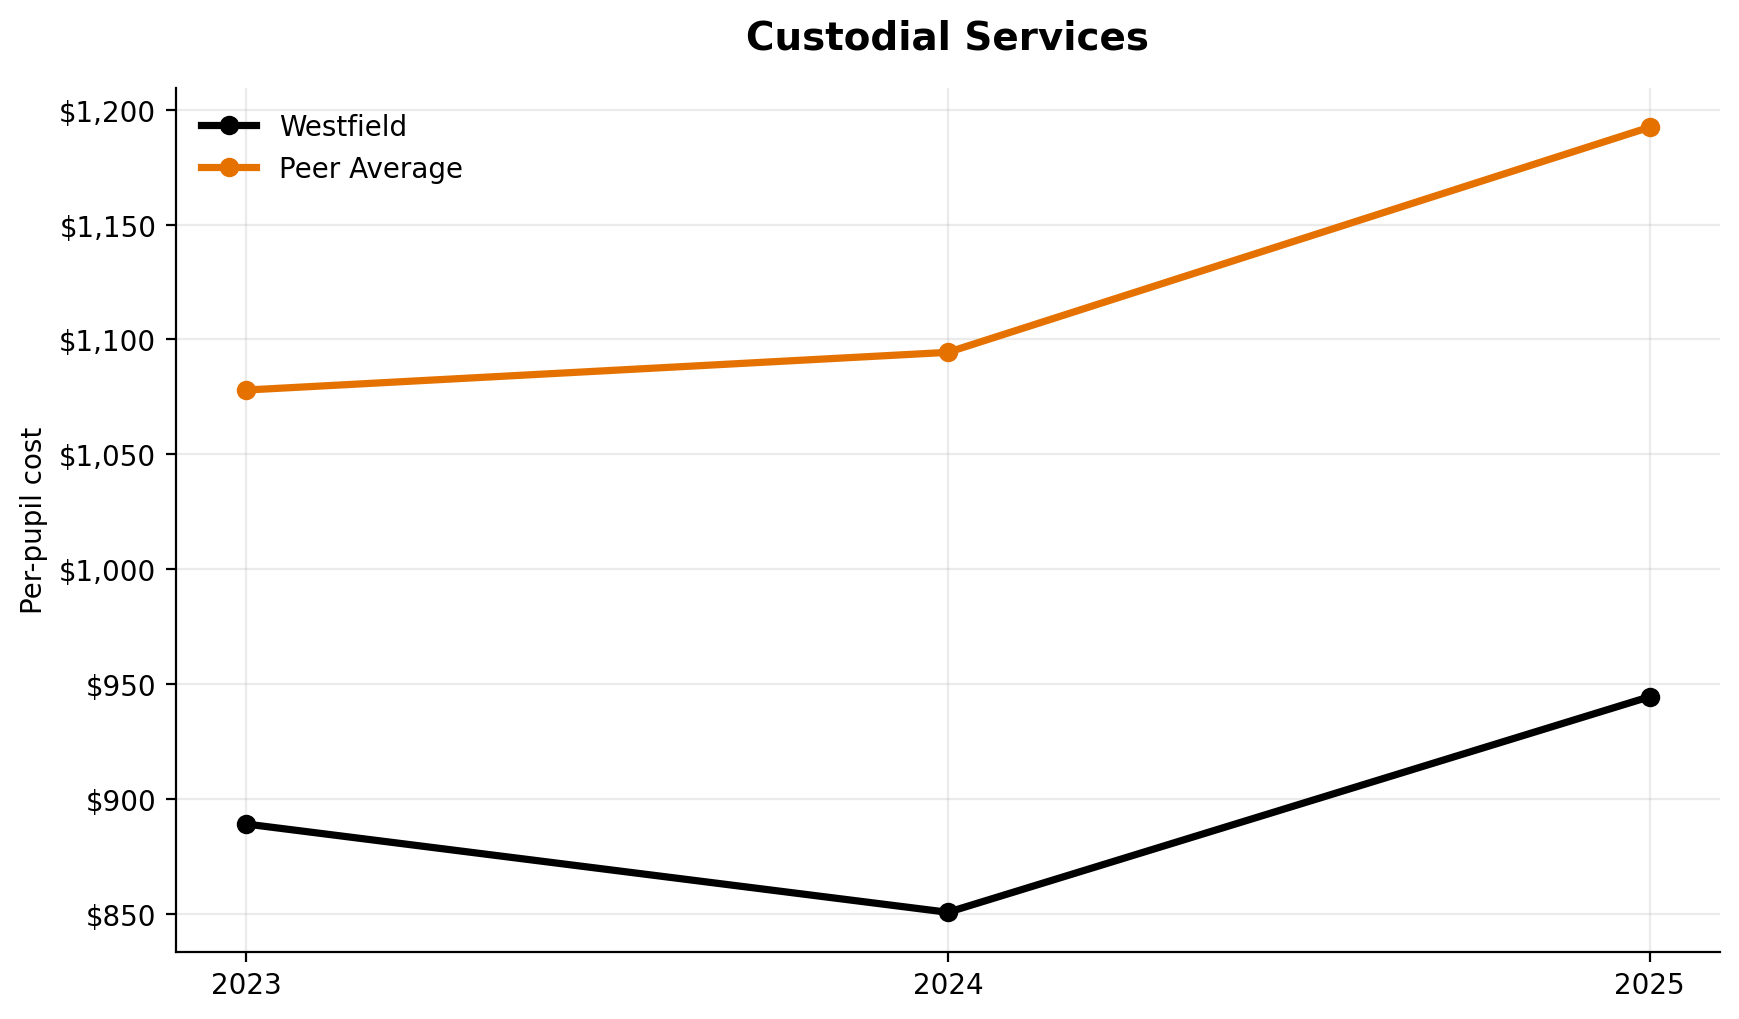
Custodial Services
Custodial services rank 6th of 7.
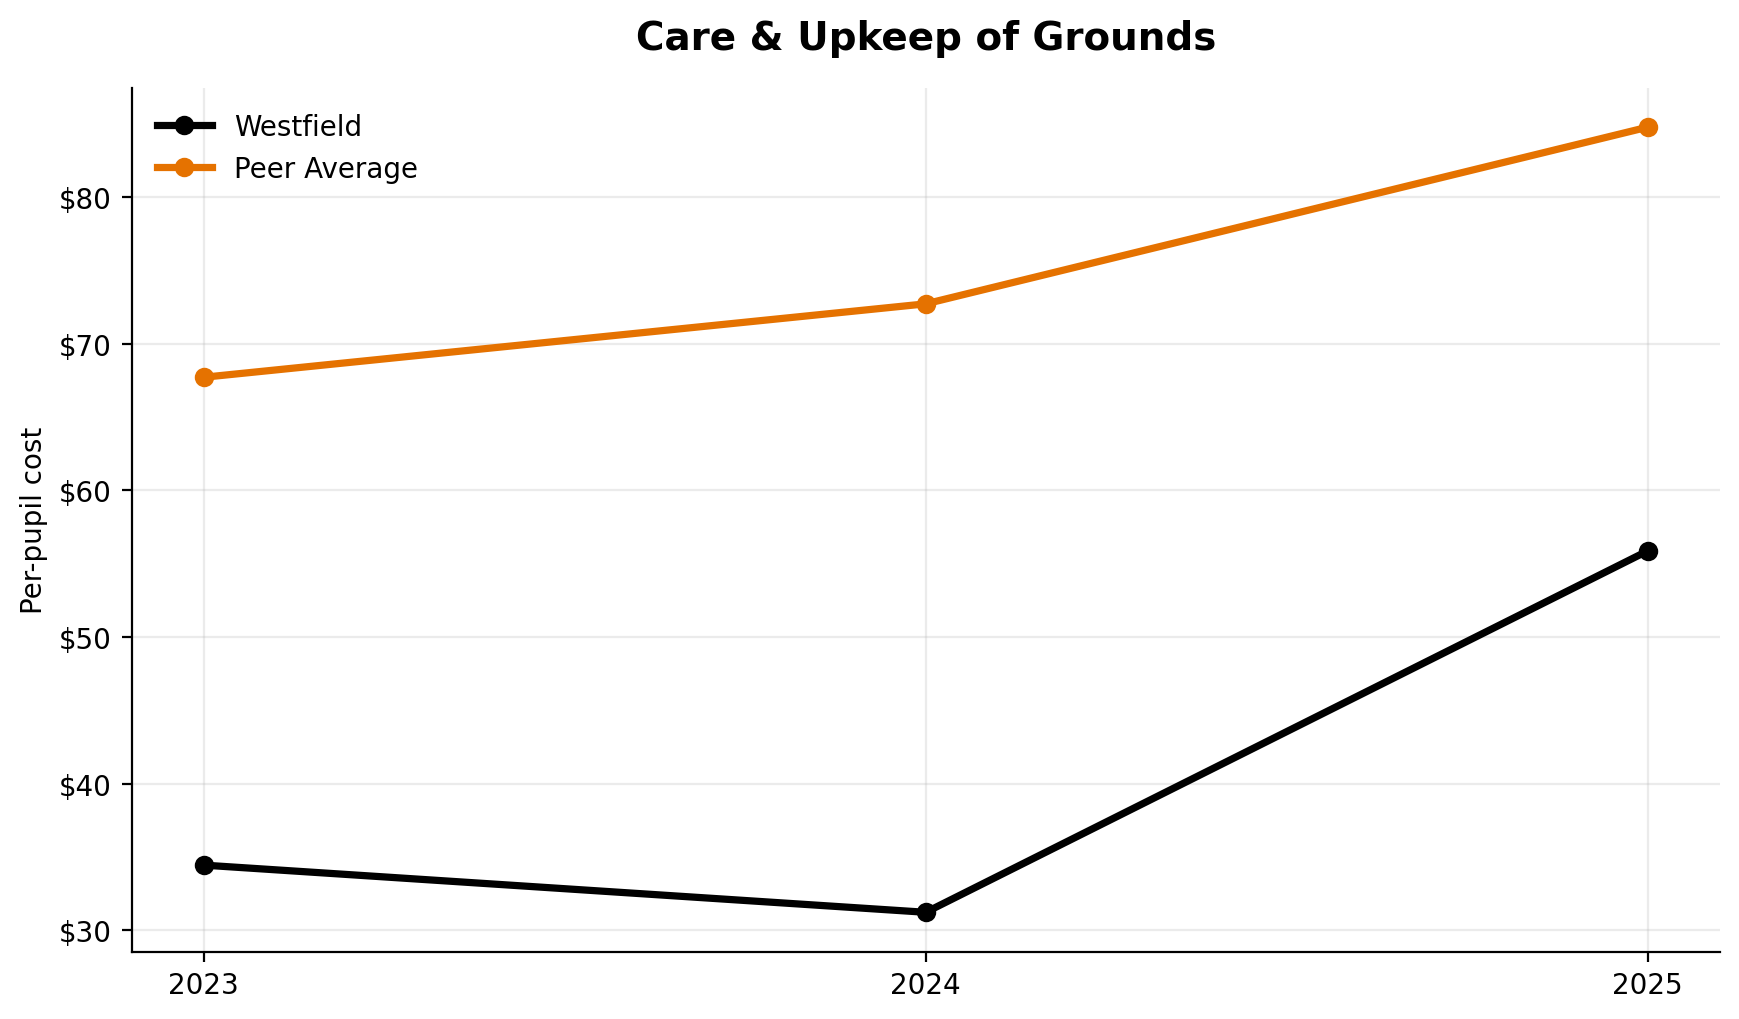
Care & Upkeep of Grounds
Grounds spending ranks 4th of 7.