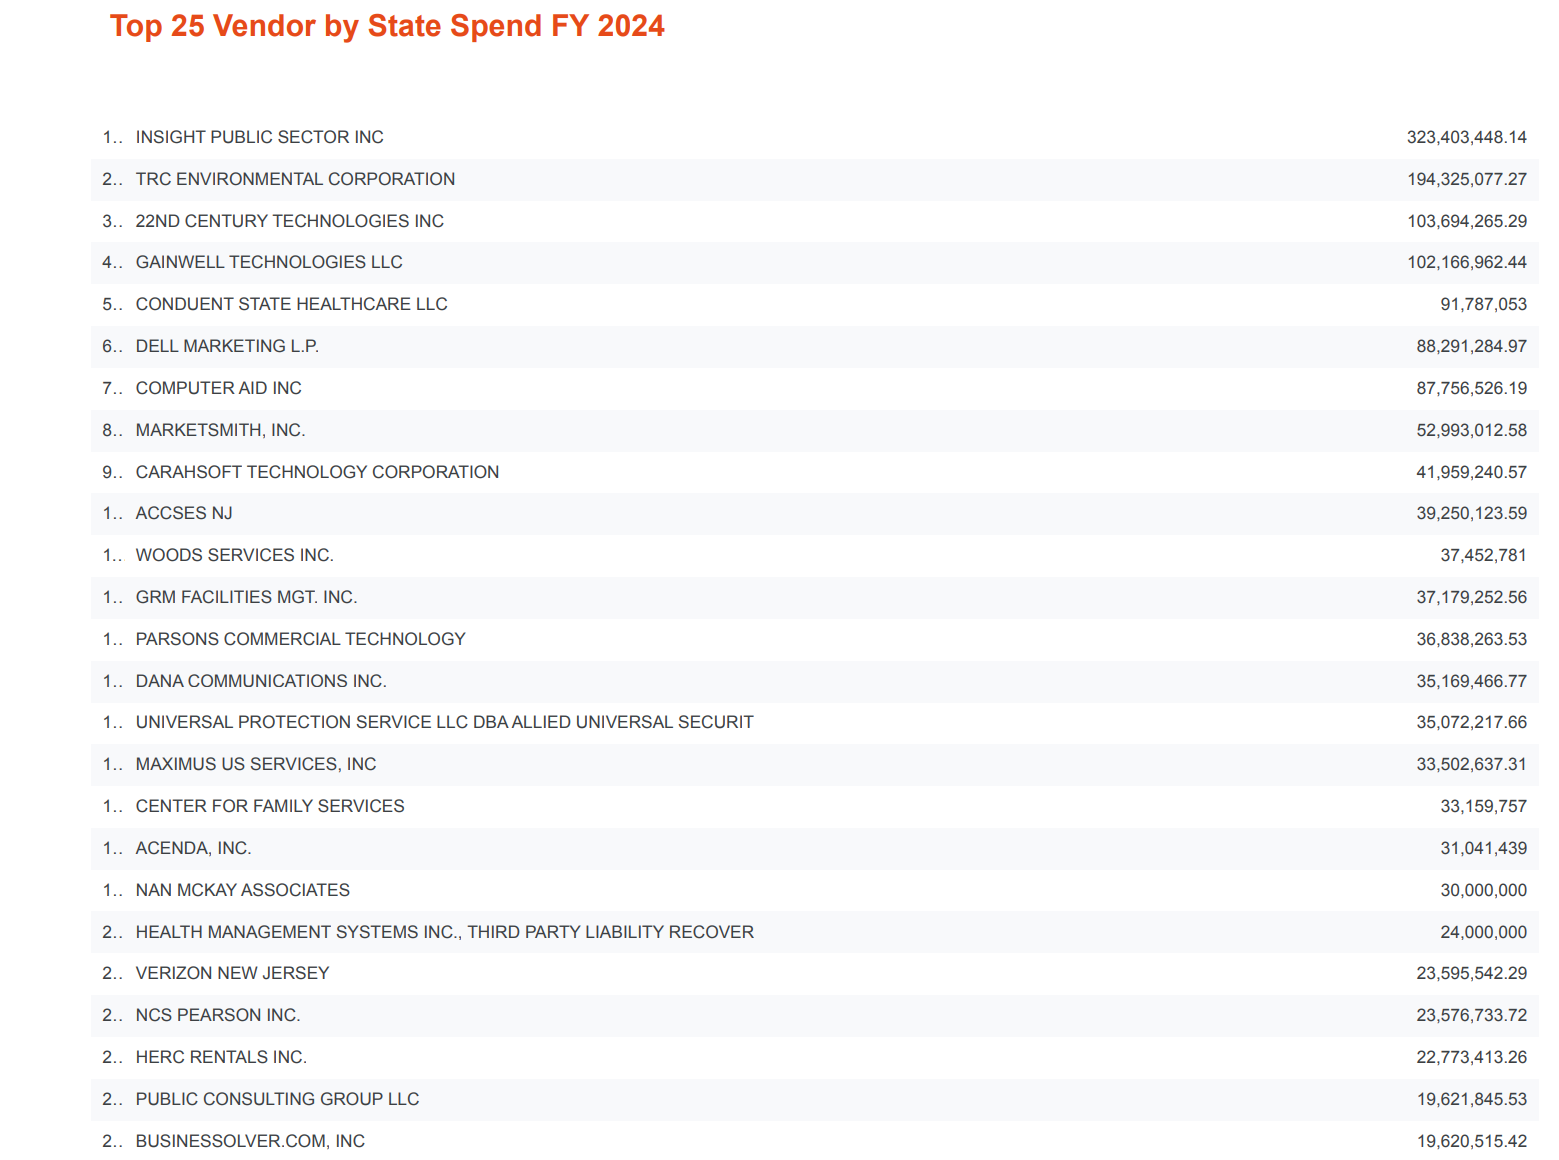
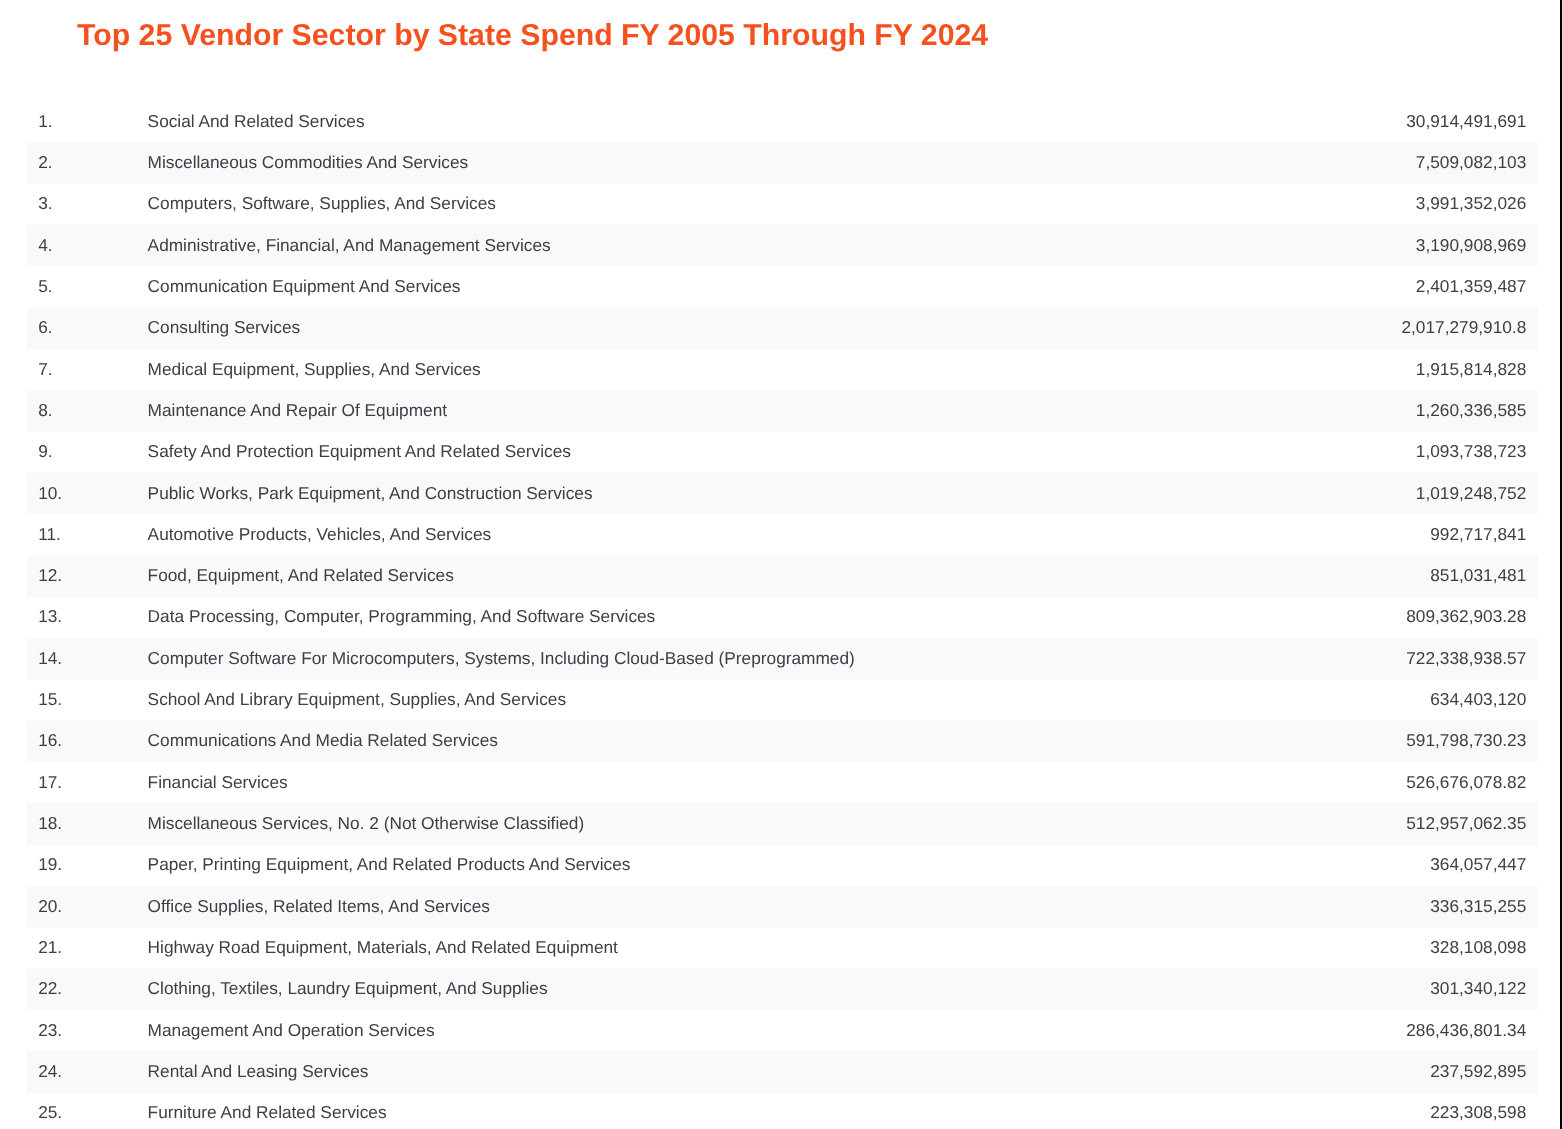
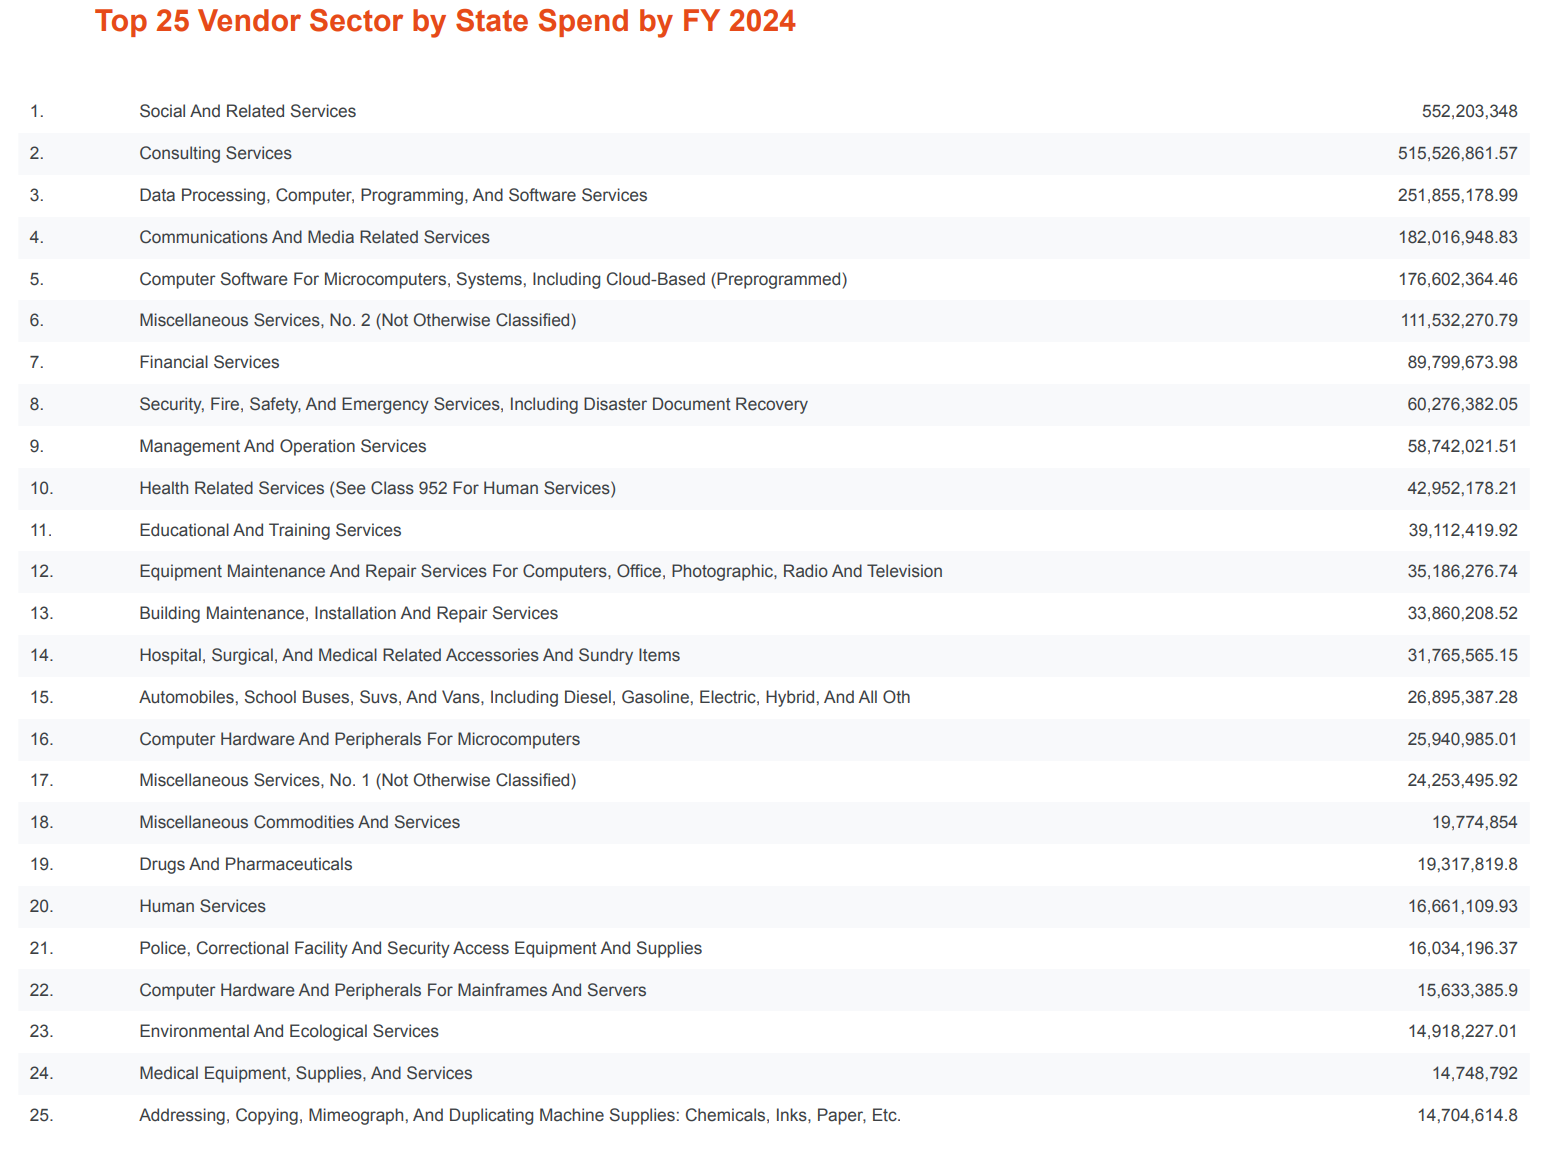
New Jersey spent more than $3.1 billion on vendors during Fiscal Year 2024 — paying for everything from social services and environmental cleanup to consulting contracts and IT infrastructure. But who got paid, how much, and by which agency?
Thanks to data published by the New Jersey Department of the Treasury available through NJ’s Open Data Portal, the public can explore how billions in vendor contracts are distributed across state departments and companies.
We provide a link to a tool at the bottom of this report that allows you to see top vendors for each State Agency..
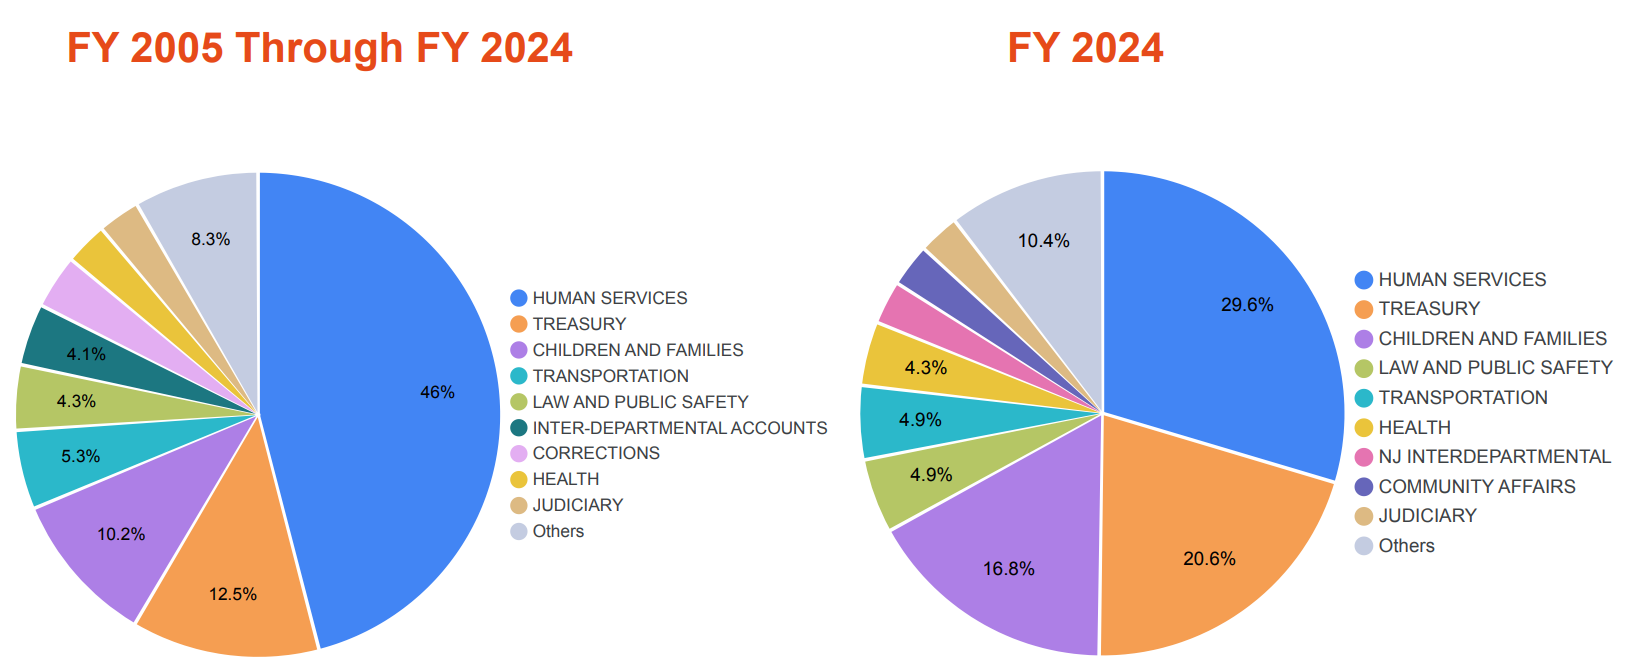
Percentage Share of NJ Agency/Department on Vendors: FY 2005–2024 vs FY 2024
From 2005 through 2024, close to half of all vendor payments (46%) came from the Department of Human Services, which oversees everything from Medicaid to social programs. Treasury came next at 12.5%, followed by Children and Families (10.2%) and Transportation (5.3%).
In FY 2024, the percentages appears to shift. Human Services is still the biggest spender, but its share dropped to 29.6%, while Children and Families rose sharply to 16.8% — reflecting growing investments in youth and family support services. Treasury held steady at 20.6%, and both Transportation and Law and Public Safety saw modest increases, each now accounting for about 4.9%.
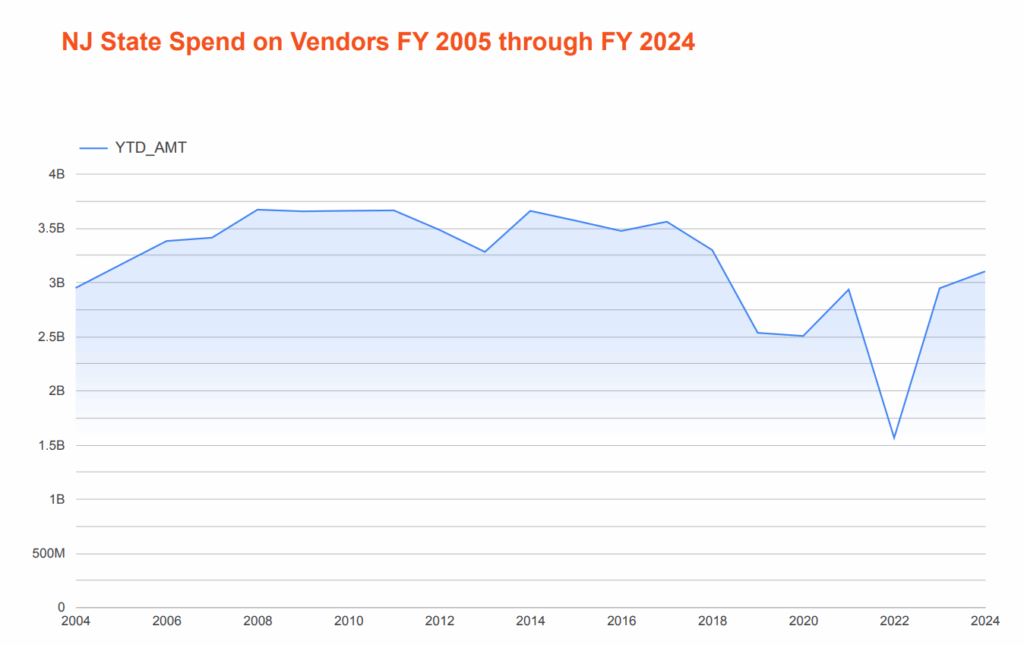
Spending Trends Over Time: FY 2005–2024
NJ21st developed a tool that allows you to explore top vendors for each state department/agency – you can access it through this link
You can access the PDF of graphs and tables in this report here.
See More Special Reports and Resources
Subscribe to NJ21st For Free
Our Commitment to Ethical Journalism
|
