If you want to know where the state is growing, don’t listen to speeches.
Follow the permits.
The NJ DCA 2024 housing permit numbers tell a story of towns building towers while others are sticking to cul-de-sacs with a few re-imagining shopping strips as live-work hubs. This while communities struggle to deal with infrastructure impact and working families still wait on the promise of affordable housing.
Overview
Essex County topped the charts with more than 4,700 new housing units as Newark doubles down on redevelopment.
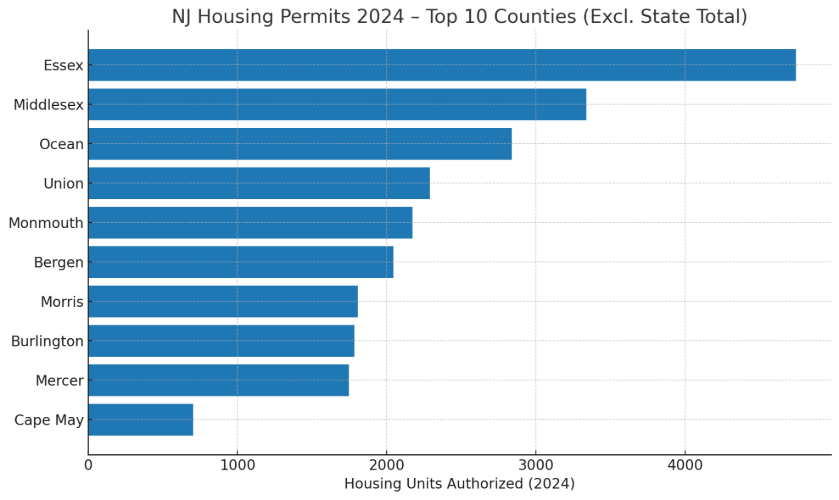
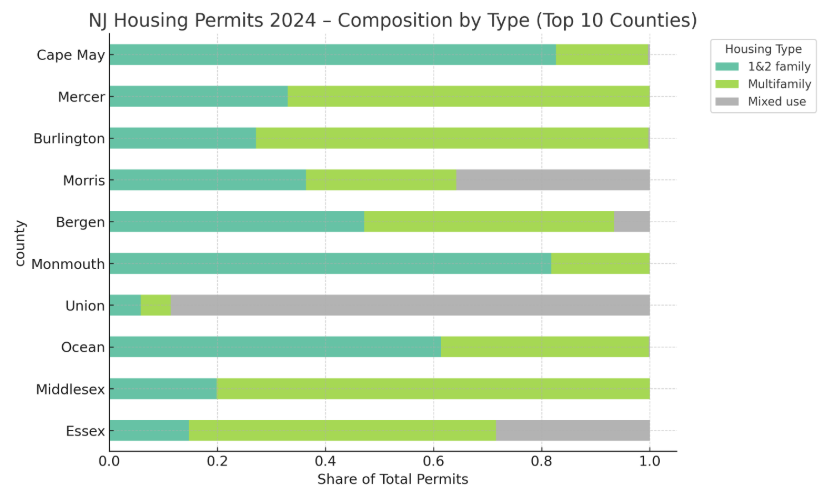
In Essex, single family homes made up only 15% of the pool, 60% were apartments, and about 30% were mixed-use projects. Middlesex wasn’t far behind, with 3,338 units, over 80% of them apartments.
Ocean and Monmouth told a very different story. Together, more than 5,000 units were approved—most of them classic single-family homes.
Then there’s Union County, where nearly 90 percent of approvals came in the form of mixed-use projects – developments grafted onto commercial corridors.
At the town level Newark led the pack with more than 3,400 units, split across apartments, mixed-use towers, and a smaller chunk of houses. 97% of East Brunswicks’s permits went to multifamily. Linden may be the wildest card of them all: 98 percent of its 2,044 units were in mixed-use projects.
South Orange and West New York both clocked in at 100% multifamily—no cul-de-sacs being carved there.
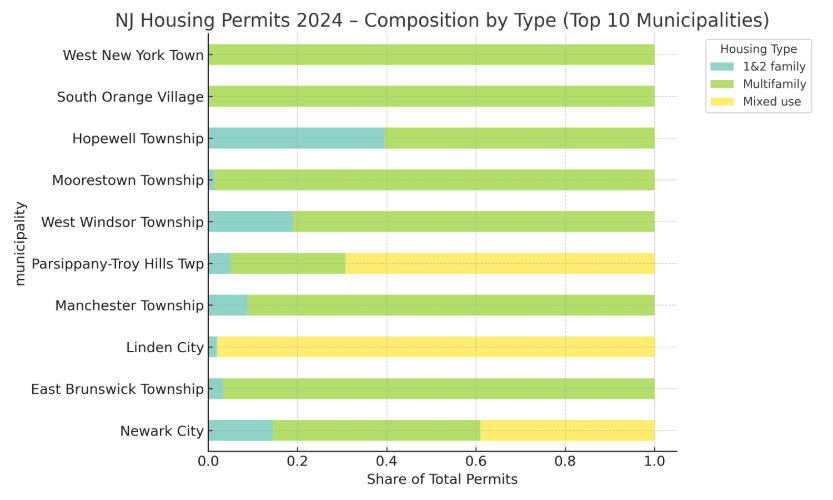
New Jersey’s building doesn’t appear to be even based on the data. Some places are sprinting toward towers, others are clinging to sprawl, and a handful are gambling on hybrids.
When we look at building density per person (combining permit data with census population) we can see how uneven the growth is. Several suburbs are approving far more housing per resident than their neighbors.
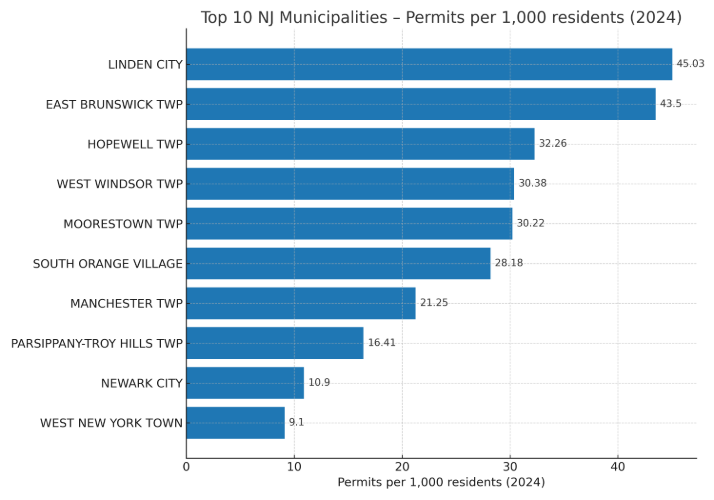
Based on the data, Linden hits the top of the list with 45.03 permits per 1,000 residents – almost all from mixed-use projects. East Brunswick is right behind at 43.50 primarily due to large multifamily approvals. Hopewell(32.26), West Windsor (30.38), Moorestown (30.22), and South Orange (28.18) all lean heavily toward apartments. Manchester (21.25) and Parsippany-Troy (16.41) round out the middle.
School Impact
When you layer housing growth on top of school seats, the imbalance sharpens. Some of the fastest-building towns are already running their schools at or above rated capacity.
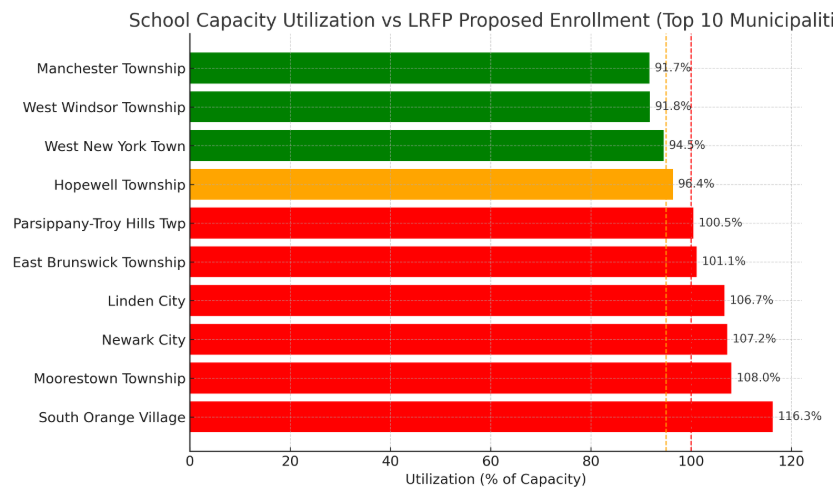
South Orange-Maplewood has 116% utilization—more students than the district’s facilities are designed to handle. Newark sits close behind at 107%, with Linden (107%), Moorestown (108%), East Brunswick (101%), and Parsippany-Troy Hills (100%) all effectively out of room. Every new unit approved in those areas pushed the envelope further.
A smaller set of towns still has breathing room. Hopewell Valley’s schools operate at 96%, Manchester Township at 91%, West New York at 92%, and West Windsor-Plainsboro at 92%. However, the margins are thin and any surge in enrollment could move the needle to red.
Towns and Cities green-lighting thousands of units may not have the classroom space to absorb the kids who will follow. Without new school construction or serious planning – educational capacity may be at risk.
Flooding
New housing approvals are hardly being placed on dry ground. Several of the towns adding the most units are also some of the most flood-prone.
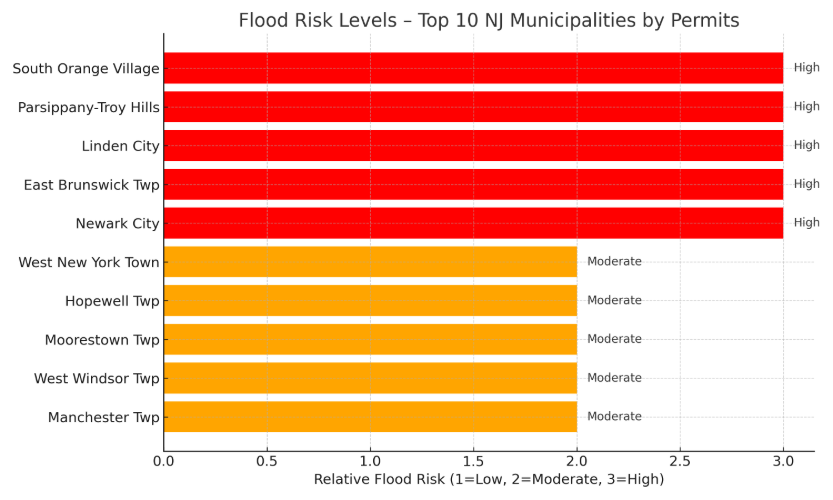
Newark, Linden, Parsippany, South Orange, and East Brunswick all sit squarely in FEMA high-risk flood zones. Newark’s Passaic riverfront and Linden’s Arthur Kill shoreline are already known for repeated inundation. Parsippany has the Whippany and Rockaway Rivers cutting through it. South Orange straddles the East Branch of the Rahway. And East Brunswick is boxed in by the Raritan River and Lawrence Brook, both mapped as repetitive loss areas.
The rest (West Windsor, Moorestown, Hopewell, Manchester, West New York) are moderate risks, with documented flood hazards but less frequent or severe incidents. Even so, each sits partly inside Special Flood Hazard Areas.
The final snapshot? Towns sprinting to approve new housing are prone to serious flood danger.
Analysis
New Jersey has given too much and made it too easy for Developers- construction is filled with builders, lawyers, engineering firms and consultants making a ton from the mandates while donating generously to political campaigns. However, in the mad money rush, communities and families are faced with stretched schools, flooded basements and a pittance of actual affordable housing sorely needed in our state. Residents need to scrutinize the building occurring in their communities – especially when they involve PILOTs that get developers off the hook when it comes to supporting schools or re-zoning favors that leave residents bearing the flooding burden.
Families in every community can unite and recognize that if the money were pulled out of generous municipal contracts and political campaigns – we could provide secure housing for working families while at the same time meet education and infrastructure needs. Real Affordable Housing where everyone wins is possible – we just need to stop fighting each other and demand better from both political parties.
Source Data for Permits (produced by NJ)
References for Population Estimates (produced by NJ21st)
References for School Data (NJ21st)
References for Flood Data (NJ21st)
As a non-commercial and ad-free, free platform, we rely on you to help us grow. If you value independent coverage of local government, please consider helping us out.
See More Special Reports and Resources
Subscribe to NJ21st For Free
Our Commitment to Ethical Journalism
|

