This is the first in a series intended to help families better understand how to hold their School District spending student-centered and accountable.
Outside of these seven districts families and stakeholders can use this series as a guide in how to interpret their own District’s ACFR and perhaps create their own Dashboard. If that happens please share it with us so we can publish it and allow others to access it. At the end of this article is a link to the state website that houses the ACFR.
The seven districts we are going to cover in this series are…
Berkeley Heights
Chatham
Madison
Millburn
New Providence
Summit
Westfield
What is the ACFR?
The Annual Comprehensive Financial Report is a District’s audit and the authoritative picture of how a District spends its dollars – it is a better source of data than the Tax Payers Guide to Education Spending. In looking at a Districts adopted budget alongside the ACFR – residents can hold Districts accountable to spending creeps in areas not connected to student learning. District often use overspends in categories to reset baselines in a new budget year.
The ACFR allows you to walk into a budget meeting and ask questions like
“For the last five years the District has consistently overspent this area by 50 to 100K and then has established it’s new baseline by the increased amount only to repeat the same pattern the next year. Can you please explain why this keeps happening and what is included in these costs?”
ACFR’s were recently published for the 2024-2025 school year, the data below includes 2025 and goes back to 2022 with the exception of the last category (Admin and Support – Gen Admin) – we went back to 2023.
In this article we will be looking at four areas of spending:
Cost Per Pupil- The amount of money is costs to educate one student in a District. This is arrived at by simply dividing the Total Amount the District Spent in 2025 by the Total Number of Enrolled Students (average daily enrollment).
Instruction- How much the District spent on Teaching Students – this includes everything from teachers salaries, special education services, athletic and clubs/activities.
Administration – Costs connected to managing schools at both the district and building level, (superintendents, principals, administrative staff etc) – positions and services not involved with classroom instruction.
Administration and Support Services (General Admin)- Captures costs for top level management and oversight (executive leadership, business offices, legal and audit services etc)
We are covering these four areas in our first article as they give us the best perspective on where to drill down.
This is what the ACFR’s for our 7 districts tell us about these four areas…
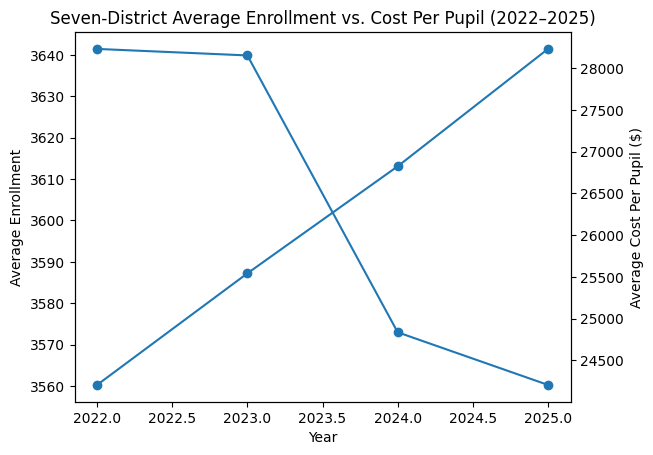
Enrollments Declined in most Districts as Cost Per Pupil Increased – enrollment has been mostly flat or declining since 2022,, yet cost per pupil has risen in every district.
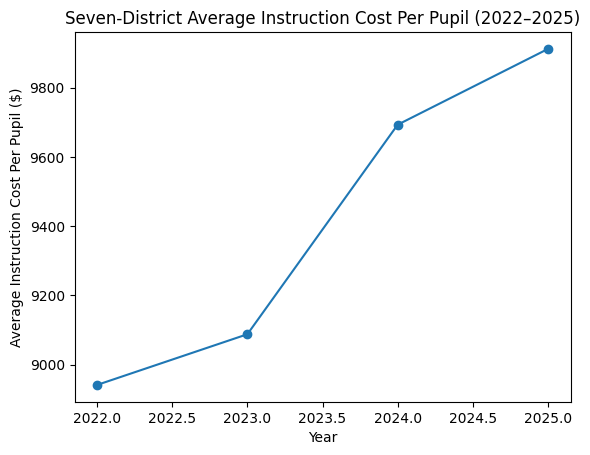
Per pupil spend on instruction increased overall from 2022 to 2025, though that’s slowing down / flattening in the most recent year.
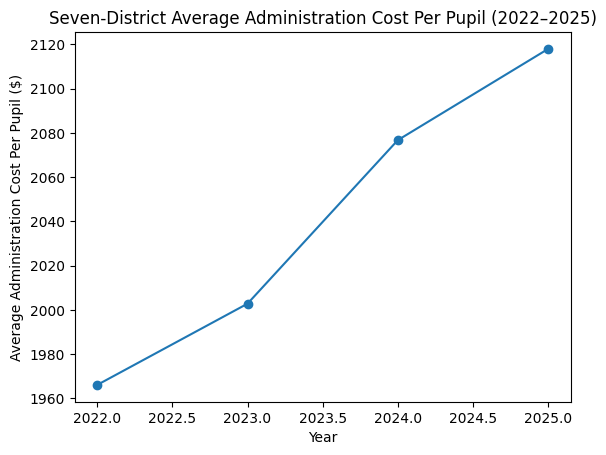
Average administrative cost per pupil increased steadily from 2022 to 2025, rising faster and more consistently than instructional cost per pupil over the same time frame.
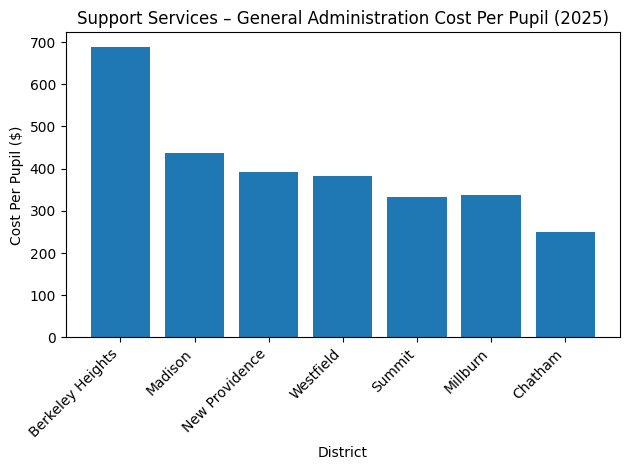
Per-pupil spend on Support Services-General Admin varies widely across districts – ranging from ~ $250 to ~ $690 in 2025.
Here is how each District landed across categories in 2024-2025 – ranked highest per pupil spend to lowest for each category…
Total Cost Per Pupil (2025)
Districts ranked from highest to lowest total per-pupil cost.
| District | 2025 Cost Per Pupil |
|---|---|
| Berkeley Heights | $31,572 |
| Millburn | $30,187 |
| Madison | $28,958 |
| Chatham | $28,374 |
| Westfield | $27,266 |
| Summit | $25,766 |
| New Providence | $25,487 |
Instruction Cost Per Pupil (2025)
Instructional spending ranked by per-pupil cost.
| District | 2025 Instruction Cost Per Pupil |
|---|---|
| Berkeley Heights | $10,858 |
| Millburn | $10,573 |
| Chatham | $10,279 |
| Madison | $9,876 |
| Summit | $9,788 |
| Westfield | $9,096 |
| New Providence | $8,914 |
Administration Cost Per Pupil (2025)
Administrative costs ranked from highest to lowest per pupil.
| District | 2025 Administration Cost Per Pupil |
|---|---|
| New Providence | $2,530 |
| Berkeley Heights | $2,411 |
| Millburn | $2,347 |
| Chatham | $2,274 |
| Madison | $2,265 |
| Summit | $2,112 |
| Westfield | $887 |
Support Services – General Administration Cost Per Pupil (2025)
This category shows the greatest per-pupil divergence across districts.
| District | 2025 Support Services – General Admin Cost Per Pupil |
|---|---|
| Berkeley Heights | $689 |
| Madison | $438 |
| New Providence | $392 |
| Westfield | $383 |
| Millburn | $338 |
| Summit | $332 |
| Chatham | $250 |
If you would like help in looking at your own District’s spending or performance in comparison to other Districts please reach out to us- we would be happy to help!
Here is Spreadsheet with Raw Data
You can review the source documentation here.
Reference: DOE ACFR Page
Part of the NJ21st ACFR Series
This article is part of an ongoing NJ21st series using audited financial reports (ACFRs) to examine how school districts actually spend public dollars and what those choices mean for students.
View the full ACFR series →
Related Articles

Commentary: My Kids Are Grown. I Still Watch the School Board and So Should You.

$5.44M in Spending, New Film Rules, and Data Center Limits- John’s Notes on the 7/7 Council Meeting