The report takes a look at 401 use of force incidents reported by the following police departments between 2021 through 2025:
Berkeley Heights
Garwood
Mountainside
New Providence
Springfield
Summit
Westfield
The data source this report is pulling from is the NJ Office of Attorney General Use of Force Reporting System which requires law enforcement agencies to track physical force and threat of force incidents.
The report focuses only on those incidents reported by the town’s police department, incidents that were handled by outside agencies within the township (State Police or other local departments as an example) are excluded. This was done to ensure fairness to local departments reflected in the report.
Incidents by Year
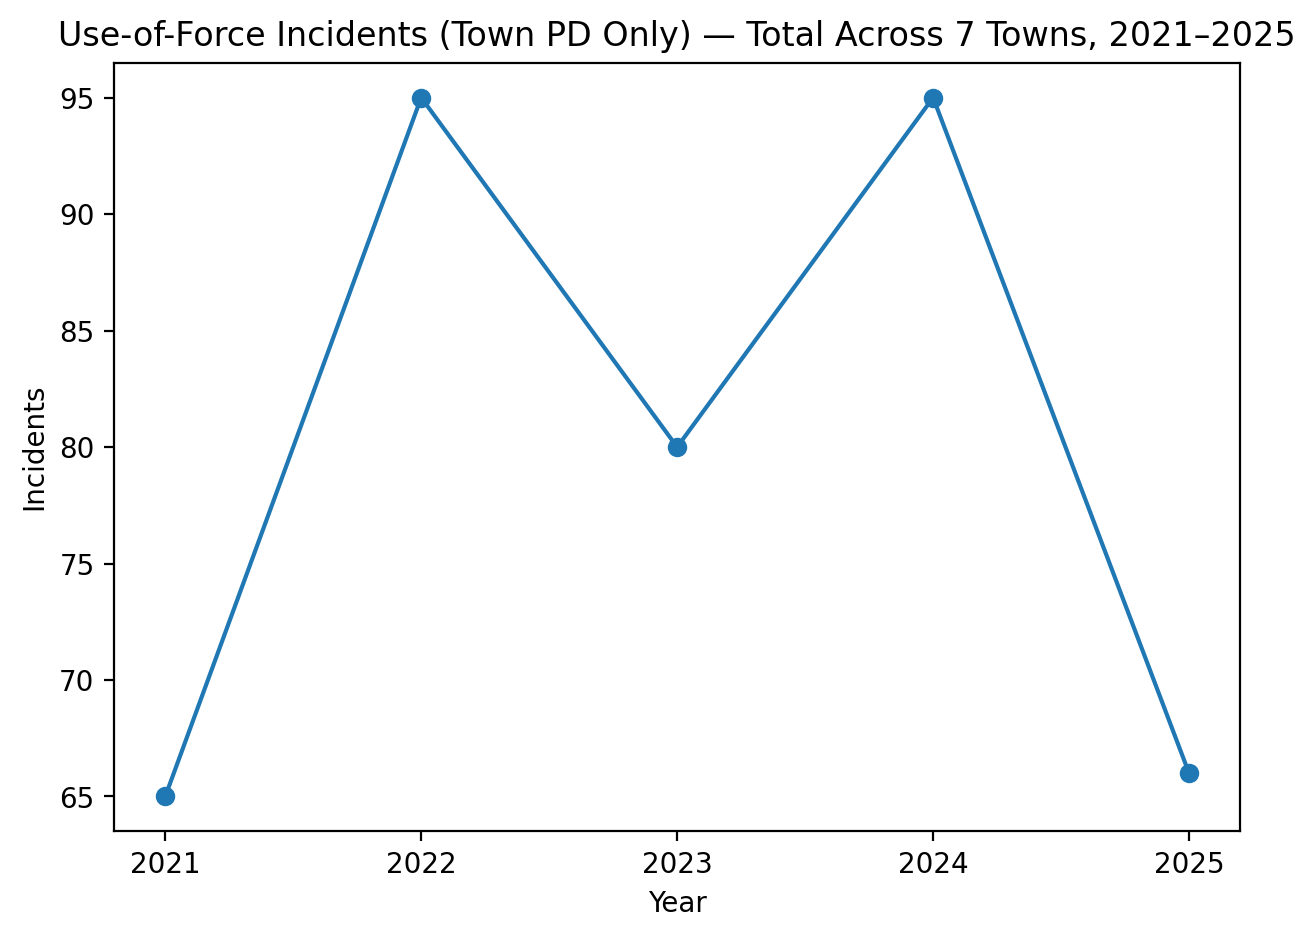
The drop in 2025 should be viewed as provisional given the reliance on state data that tends to be updated over time due to late submissions, corrections or revisions. With that said, across all 7 Townships, we see the numbers fluctuating from one year to the next – 2022 and 2024 saw increased, 2021 and 2023 saw drops.
Incidents per Capita (per 10,000)
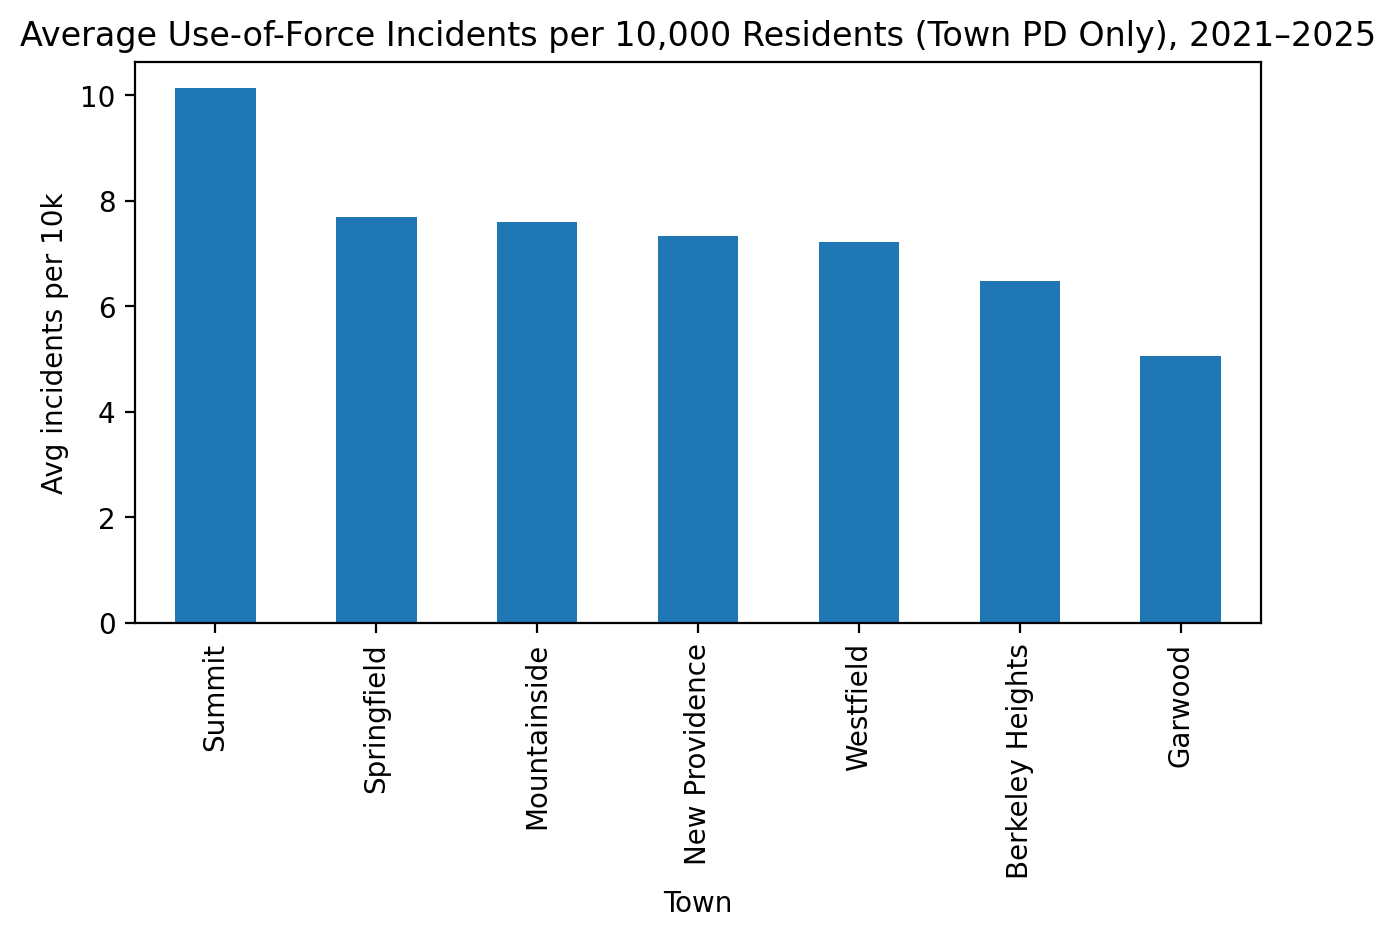
Summit reported a higher per Capita rate of use-of force incidents than the six other towns the report includes. Important to note that both Mountainside and Garwood are much smaller towns and both had very few incidents so their per capita rates should be viewed with caution since they can be more volatile.
Injuries
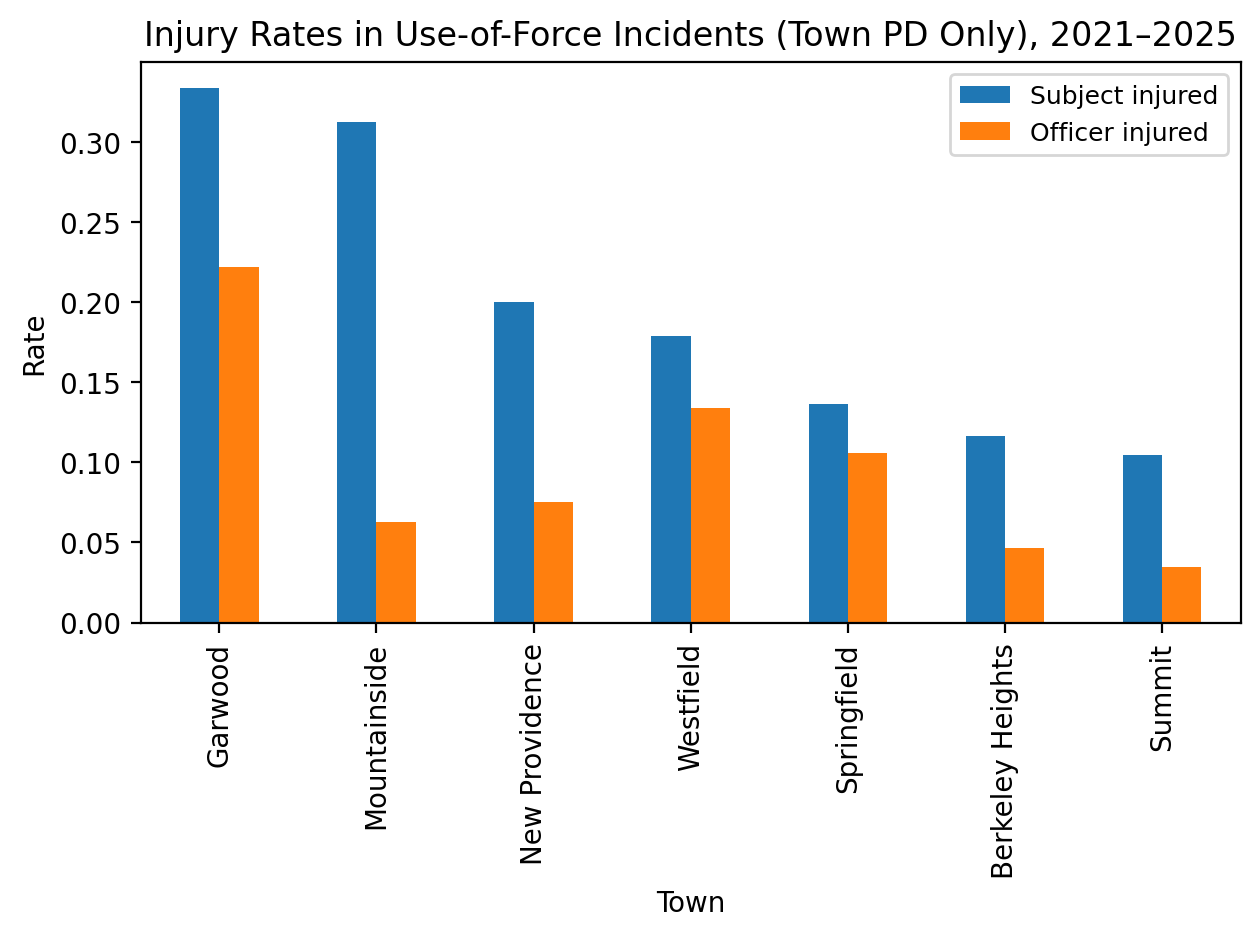
Injury rates varied substantially between departments – Westfield is notable because it had both a higher volume of incidents and a higher injury rate for both officers and individuals involved in the incident. While Garwood and Mountainside showed rates above 30% it’s important to note that this again should be viewed cautiously due to the small incident count.
Footage
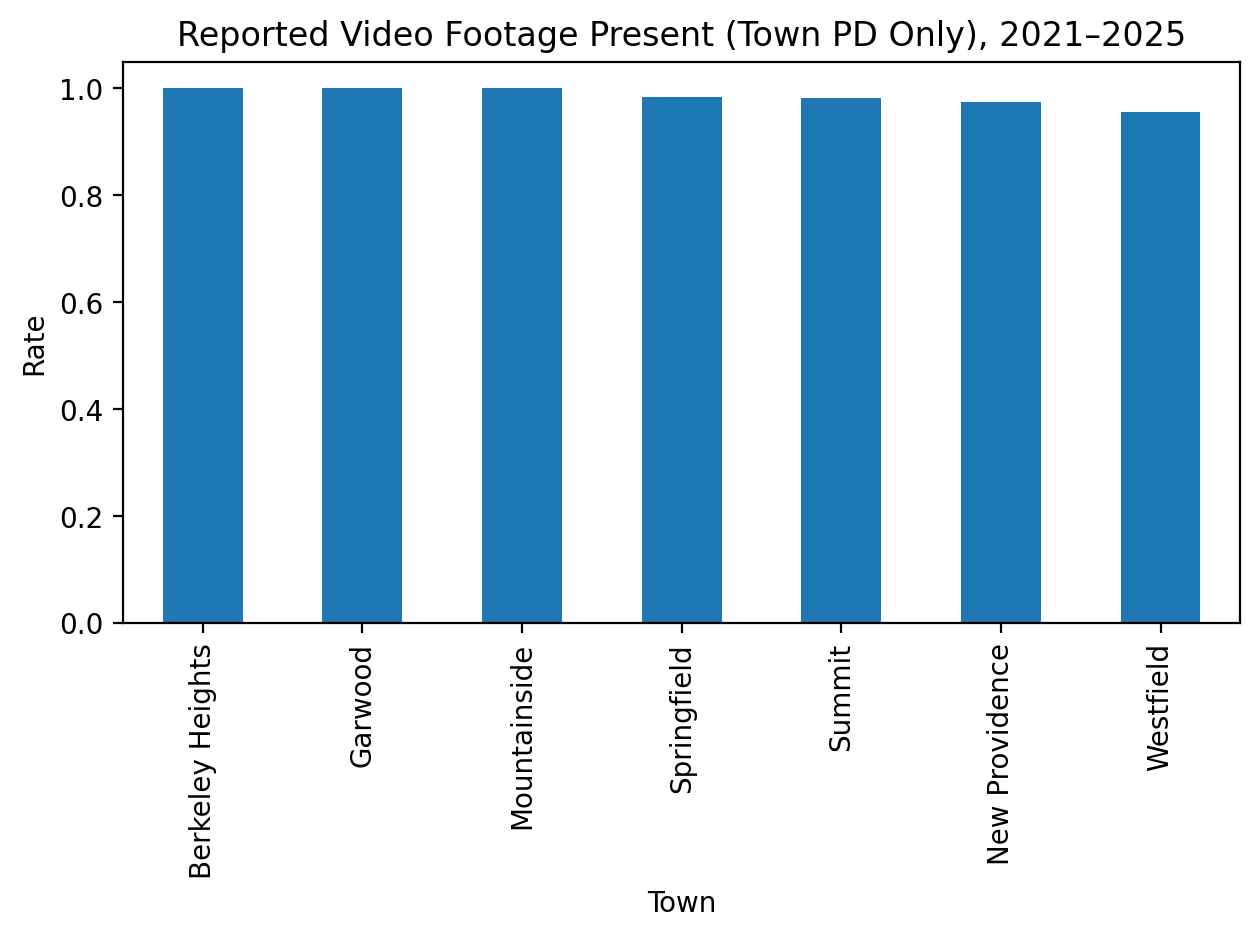
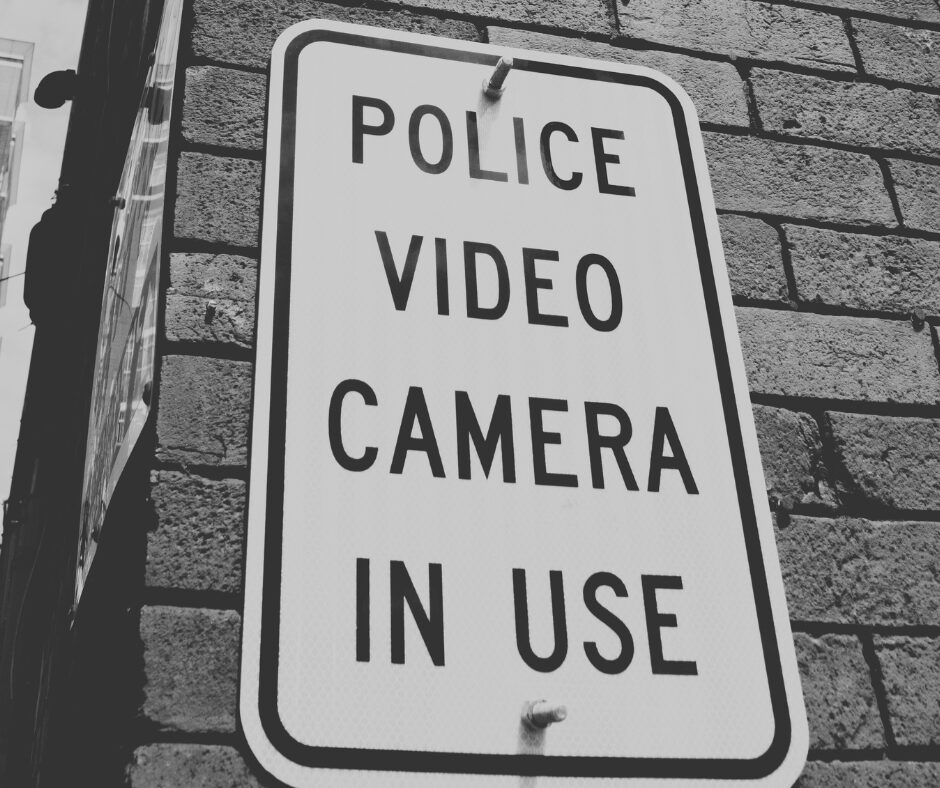
All seven departments were effective in documenting incidents through video.
Types of Force
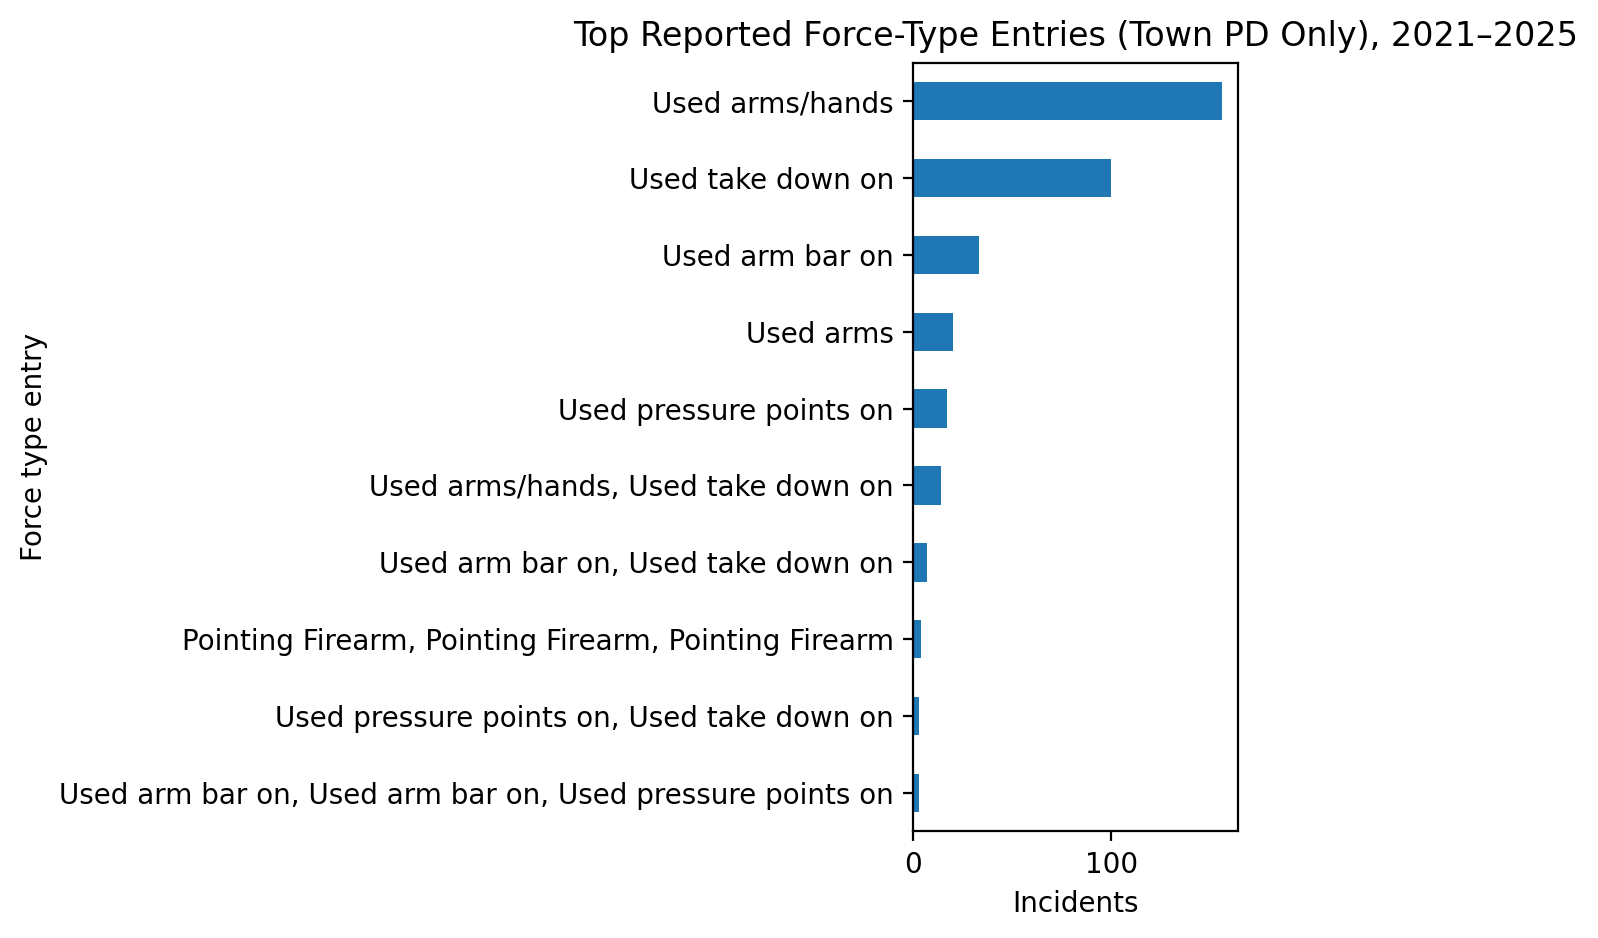
The vast majority of incident types were hands on physical encounters. However, within incidents where fire arms were pointed, 8 of the 9 individuals were Black or Hispanic.
Race/Ethnicity of Individuals Involved in Incidents & Demographics
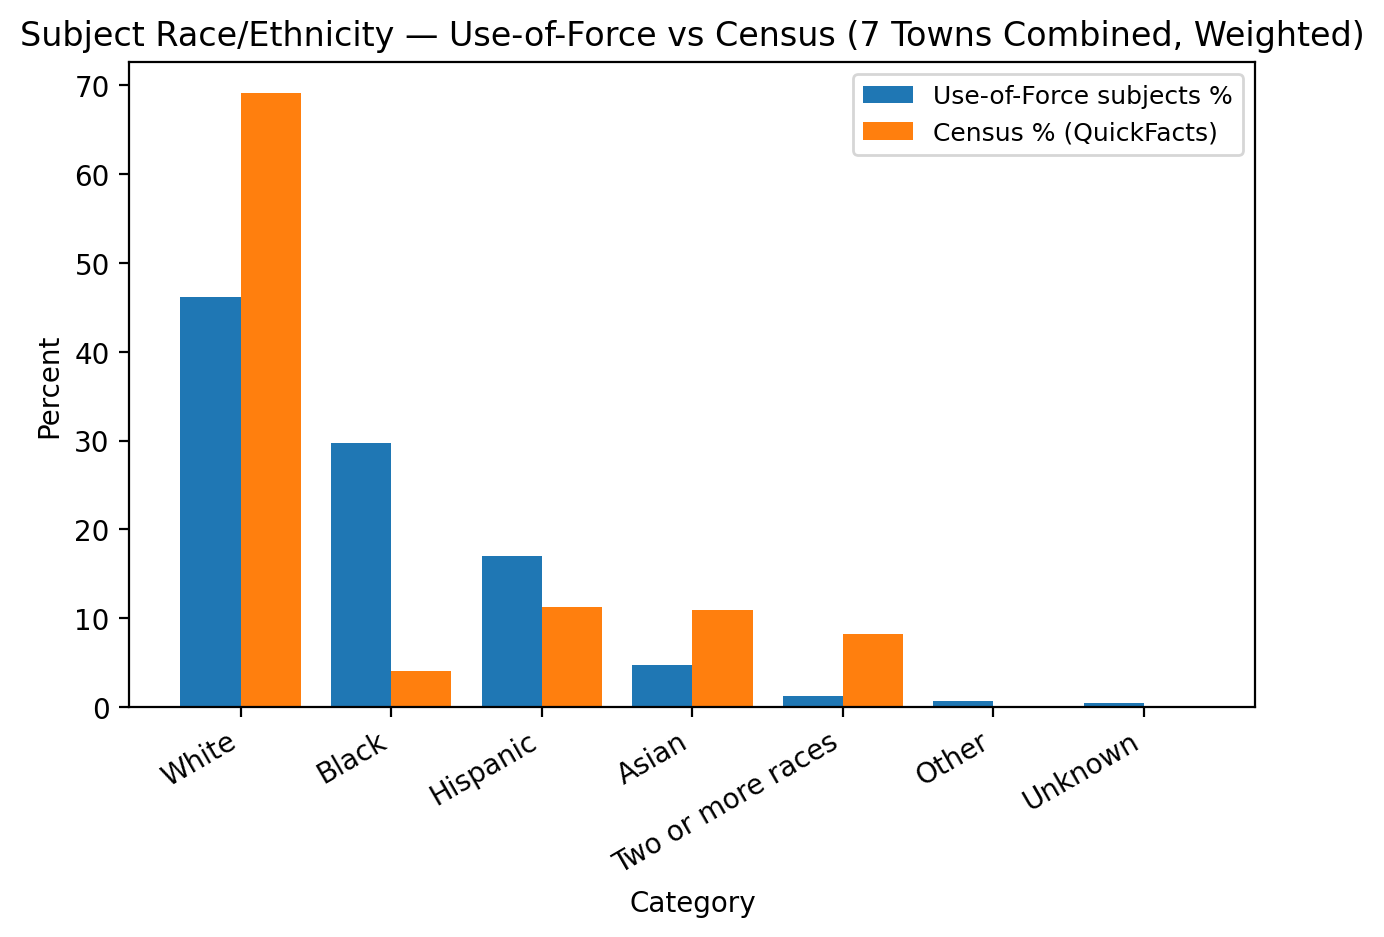
~50% of individuals that were involved in use-of-force incidents are White, ~30% are Black and 17% are Hispanic. In order to determine whether these numbers represent under/over-representation we need to consider local demographics.
Using US Census Data – the 7 towns combined have a weight population that’s ~ 69.15% White; Springfield has the largest Black and Hispanic population (9.3%, 17.8%);
Race – Use of Force against Census Data
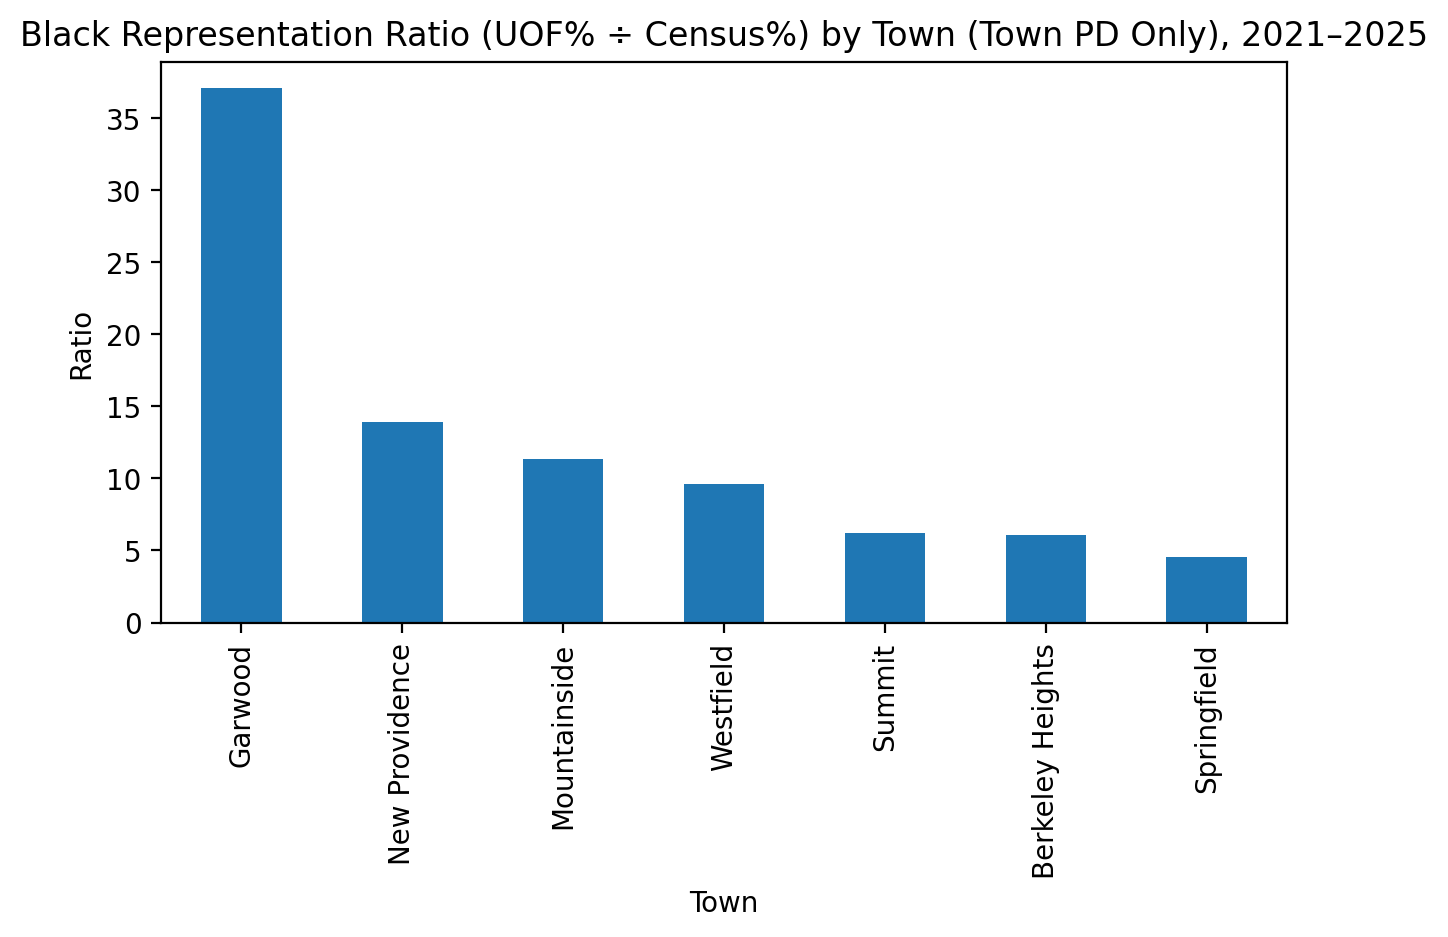
Black residents appear in use-of-force incidents more than 7 times higher than their share of the local population within these communities, Hispanics 1.5 times higher. Being that some of these towns have train stations, large retail sections and major highways surrounding them its important to keep in mind that SOME incidents may involve folks who do not live in these communities. However, the disparity remains a meaningful point of data for community discussion, regardless.
Officer Race
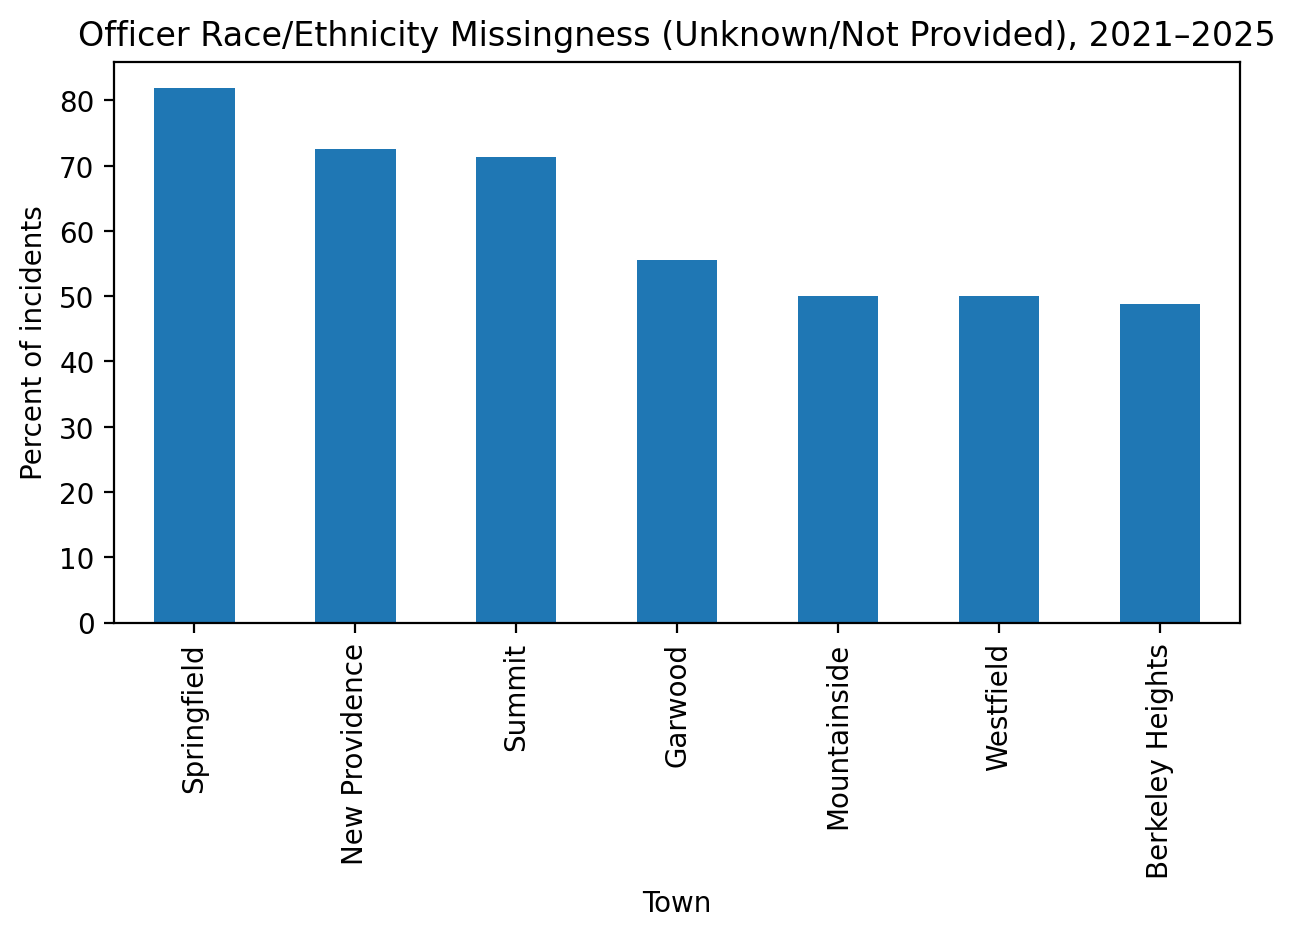
There is a highly significant transparency gap in reporting as most reports in several of the towns included in this report don’t include information about the Officer’s race so it isn’t possible to conduct a reliable analysis of dynamic on race between officer and individual.
Agency Type
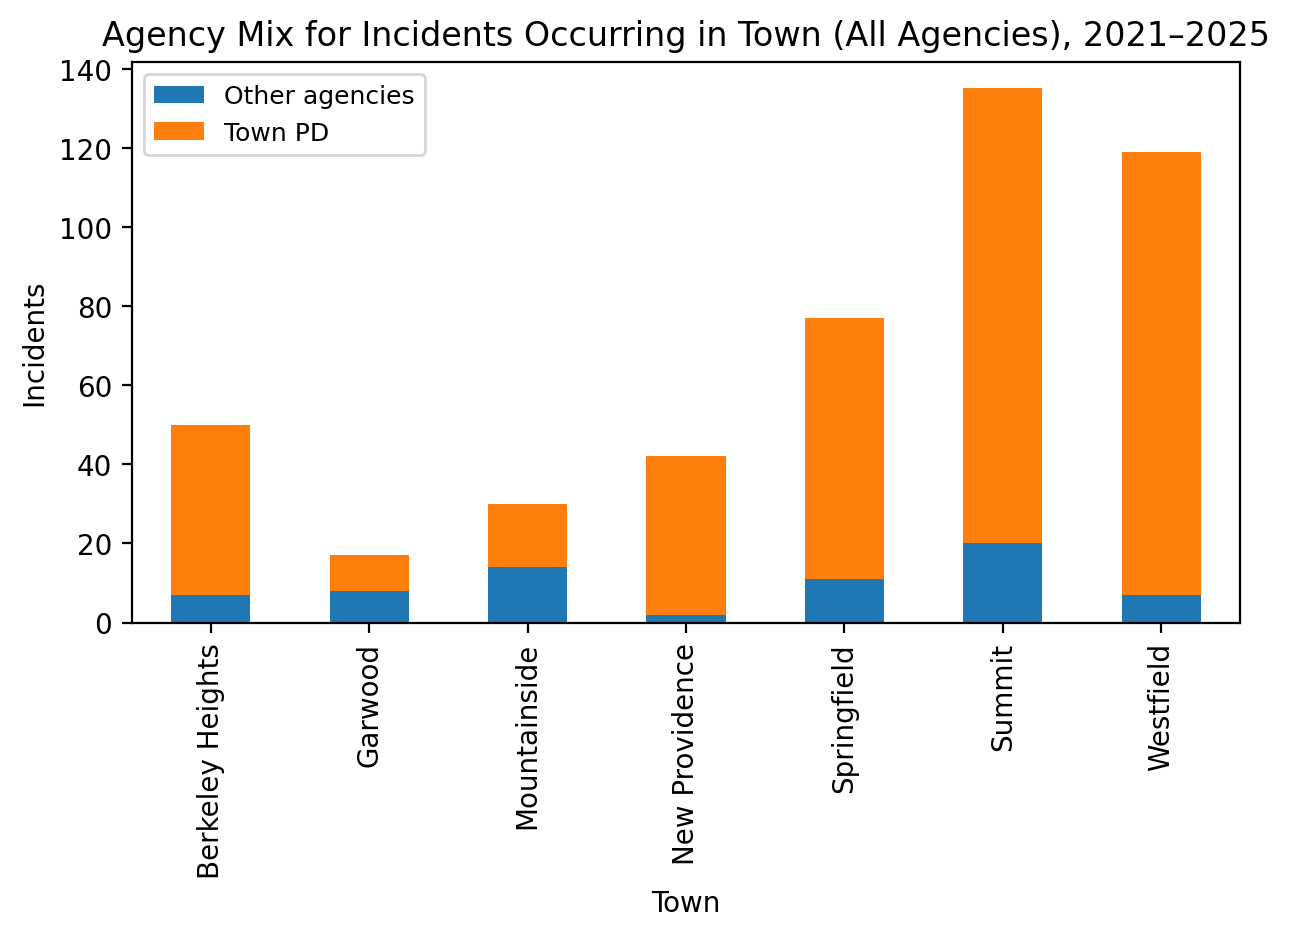
Again, the data above represents ONLY use of force incidents by officers within the communities police department. When you look at the data involving all law enforcement agencies we find that in smaller communities like Garwood and Mountainside, ~50% of use-of-force incidents that occurred within those communities involved outside agencies.
Value
While 400 incidents over a 5 year period may not seem like a ton of data or significant – within the context of safety, civil rights and local government they are a meaningful evaluation point.
Proportion not volume
Despite the low crime rate, the 7.28 representation ratio for Black individuals (4%of the population but 30% within the incidents reported) points to a disparity that can’t simply be brushed aside as a result of a small sample size. Rather, it is a data point that warrants further evaluation and discussion.
Transparency Gap
There are two gaps this report reveals.
The first is that, in smaller communities like Mountainside and Garwood nearly half of the use-of-force incidents involve law enforcement that aren’t accountable to local government bodies or the communities they operated in.
The second, pointed out earlier, involves the lack of data identifying race of officer in these incidents which makes understanding racial dynamics at play difficult.
Measurement
If you don’t measure it then you can’t improve it and the report can offer a baseline point. And while the sample size is small, it is a representation of the reality that exists within these communities.
Fidelity
The vast majority of incidents contained in this report have video footage as a receipt.
Use Case Study
The greatest value is that the report shows one way or method the state data can be used by residents of local communities to evaluatee their police departments
Vulnerabilities
In future reporting, we may treat Mountainside and Garwood as a separate small-town comparison group because low incident counts make rates more volatile and require cautious interpretation.
Related Articles
The Red Flags in New Providence’s Remote Police Video Access Agreement

The Rest of the 07/21 Berkeley Heights Agenda: $1.9M in Unitemized Bills, Unclear Contracts and More Words in the Air