
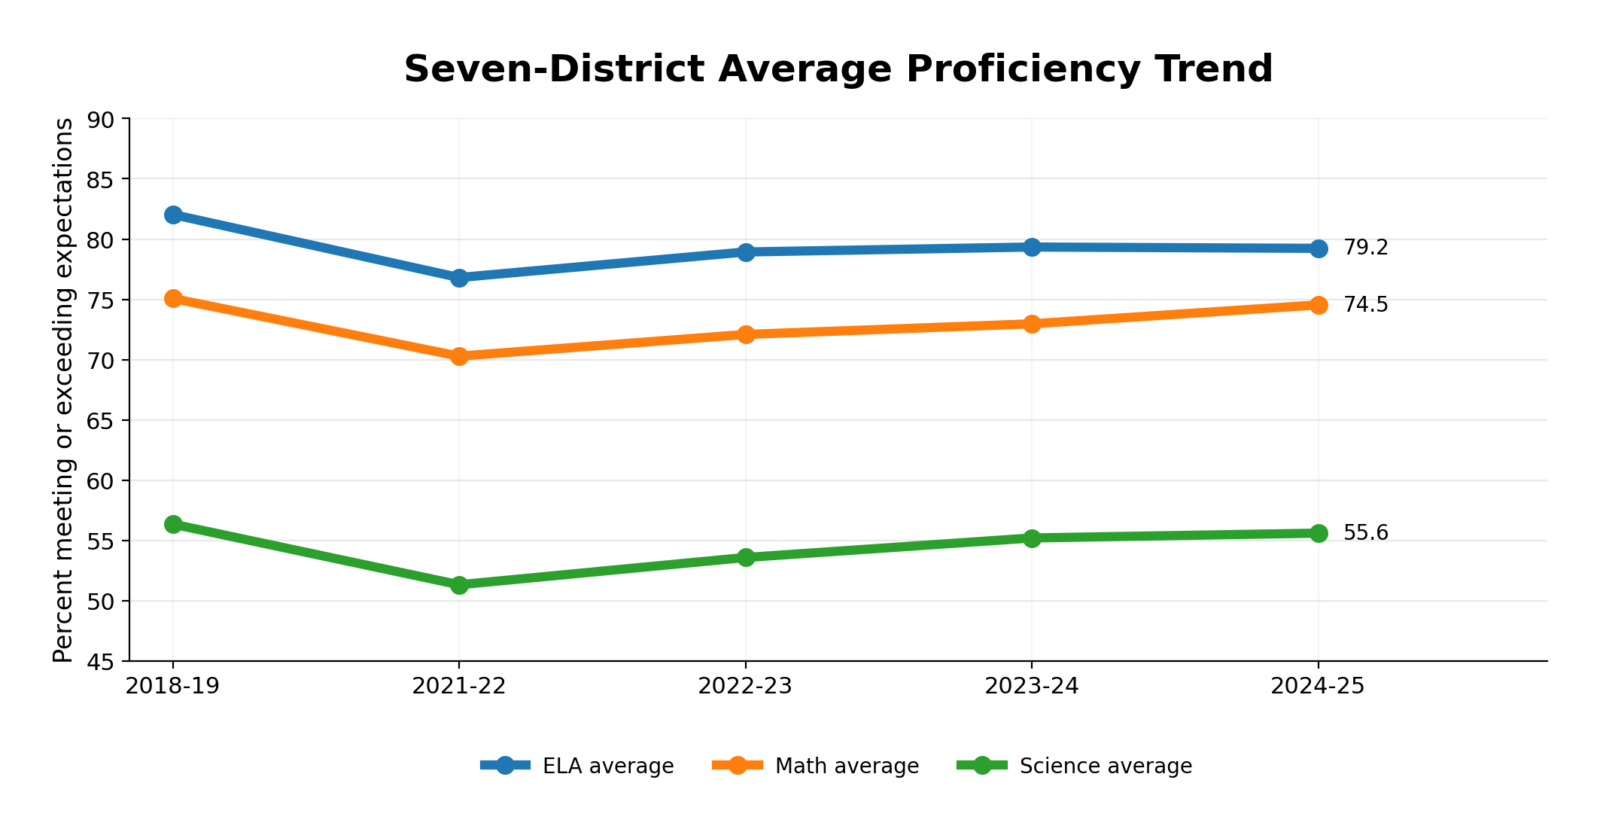
Across our 7-District group proficiency rebounded from the 2021–22 post-pandemic testing period but not evenly across subjects and still below pre-pandemic levels.
ELA, Math, Science
The seven-district ELA average dropped from 82.0% in 2018-19 to 76.8% in 2021-22, then bumped to 79.2% in 24-25.
Math followed the same flow; 75.1% in 18-19 to 70.3% in 21-22 before coming back at 74.5% in 24-25.
Science remained lower overall -56.4% in 18-19 to 55.6% in 24-25.
English Language Arts 2024-25
| Rank | District | 2024–25 Rate |
|---|---|---|
| 1 | Millburn | 85.3% |
| 2 | New Providence | 84.7% |
| 3 | Summit | 82.0% |
| 4 | Madison | 78.8% |
| 5 | Westfield | 75.7% |
| 6 | Chatham | 74.8% |
| 7 | Berkeley Heights | 73.3% |
Math 2024-25
| Rank | District | 2024–25 Rate |
|---|---|---|
| 1 | Millburn | 85.2% |
| 2 | New Providence | 79.4% |
| 3 | Summit | 75.7% |
| 4 | Westfield | 73.6% |
| 5 | Madison | 70.0% |
| 6 | Berkeley Heights | 69.4% |
| 7 | Chatham | 68.5% |
Science 2024-25
| Rank | District | 2024–25 Rate |
|---|---|---|
| 1 | Millburn | 72.8% |
| 2 | New Providence | 60.8% |
| 3 | Chatham | 55.9% |
| 4 | Westfield | 54.9% |
| 5 | Summit | 53.3% |
| 6 | Berkeley Heights | 51.1% |
| 7 | Madison | 40.5% |
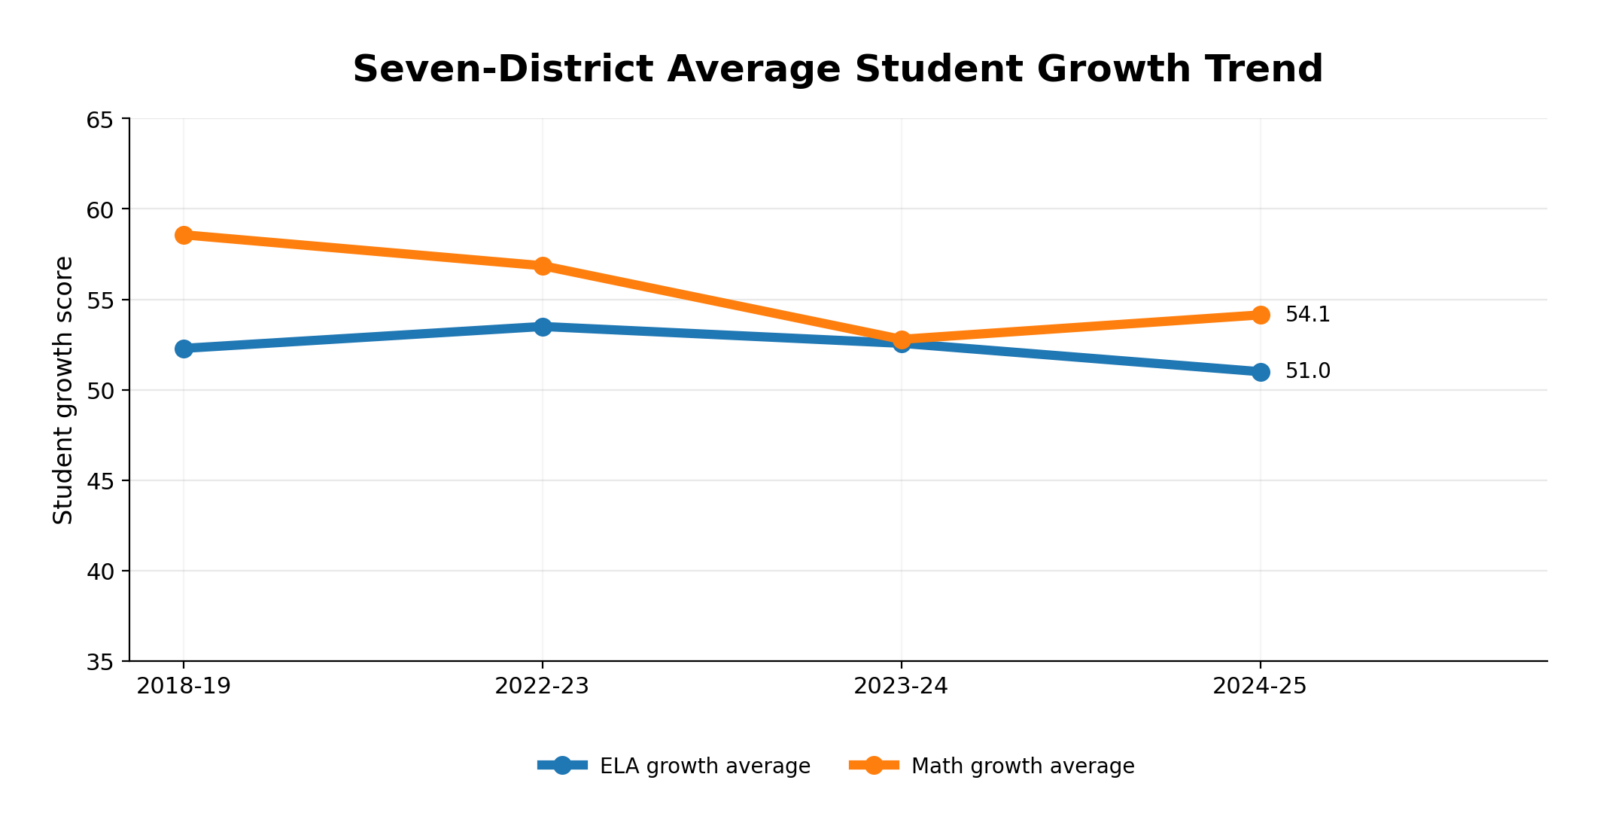
Student Growth
Student growth went a different way – the seven-district ELA growth average was 51.0 in 24-25 below the 22–23 average of 53.5. Math growth averaged 54.1 in 24-25 up from 52.8 in 23-24…both ELA and Math growth are below pre-pandemic levels.
ELA Student Growth 2024-25
| Rank | District | 2024–25 Growth |
|---|---|---|
| 1 | New Providence | 63.0 |
| 2 | Millburn | 56.0 |
| 2 | Madison | 56.0 |
| 4 | Summit | 54.0 |
| 5 | Berkeley Heights | 48.0 |
| 6 | Westfield | 43.0 |
| 7 | Chatham | 37.0 |
Math Student Growth 2024-25
| Rank | District | 2024–25 Growth |
|---|---|---|
| 1 | Millburn | 62.0 |
| 2 | Madison | 61.0 |
| 3 | New Providence | 59.0 |
| 4 | Summit | 56.0 |
| 5 | Westfield | 52.0 |
| 6 | Berkeley Heights | 46.0 |
| 7 | Chatham | 43.0 |
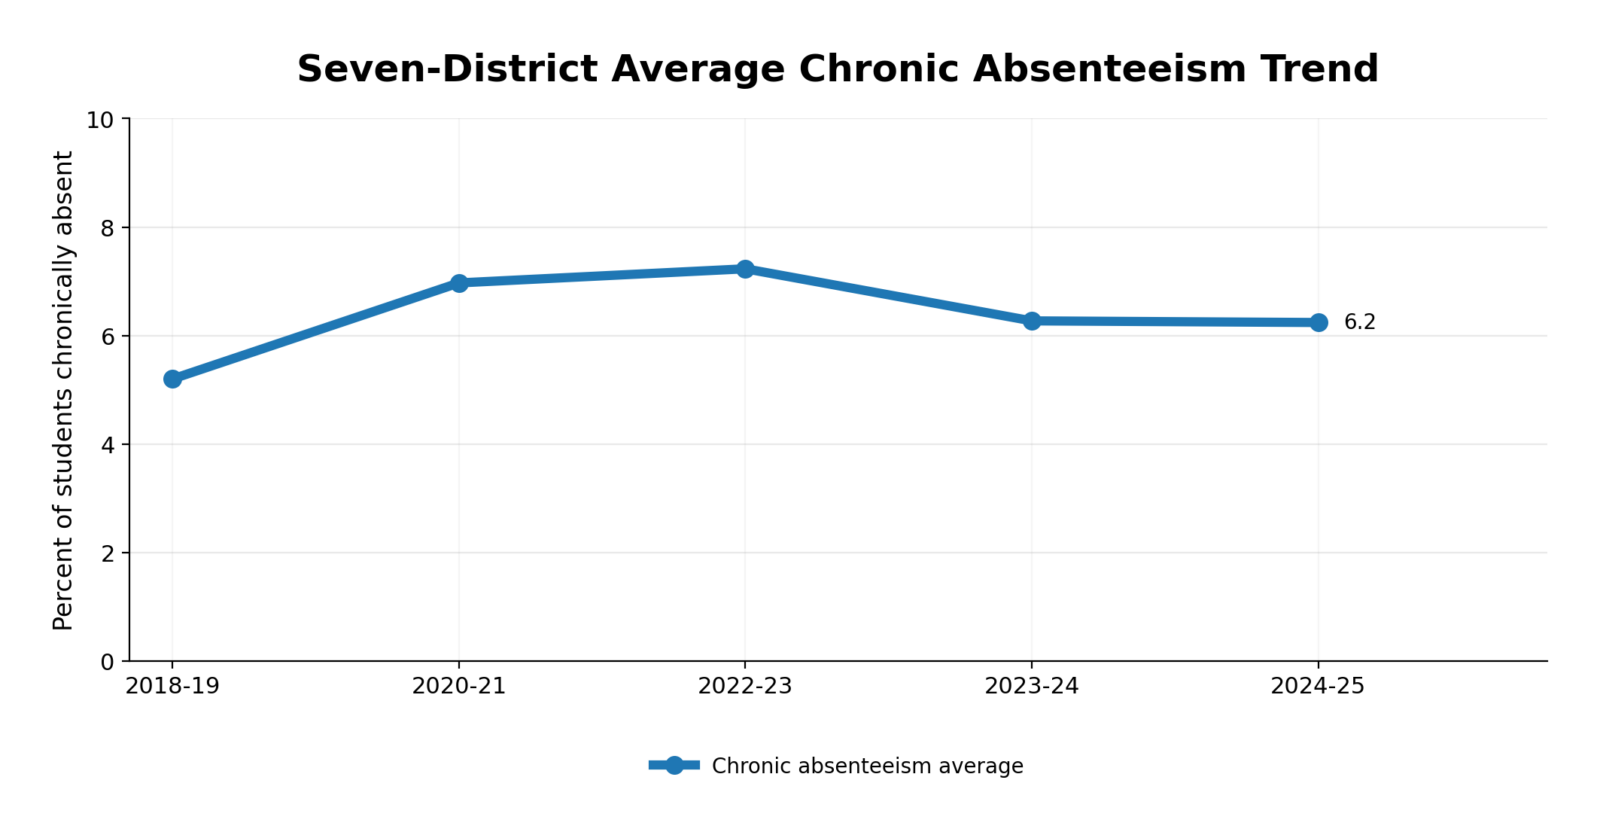
Chronic Absenteeism
Chronic absenteeism improved from its 22–23 level but still higher than the pre-pandemic baseline. The seven-district average was 5.2% in 18-19, went up to 7.2% in 22-23 and came back down to 6.2% in 24-25.
Chronic Absenteeism 2024-25
Lower is better.
| Rank | District | 2024–25 Rate |
|---|---|---|
| 1 | Westfield | 3.5% |
| 2 | New Providence | 4.0% |
| 3 | Berkeley Heights | 4.7% |
| 4 | Chatham | 6.3% |
| 5 | Summit | 6.5% |
| 6 | Madison | 9.2% |
| 7 | Millburn | 9.5% |
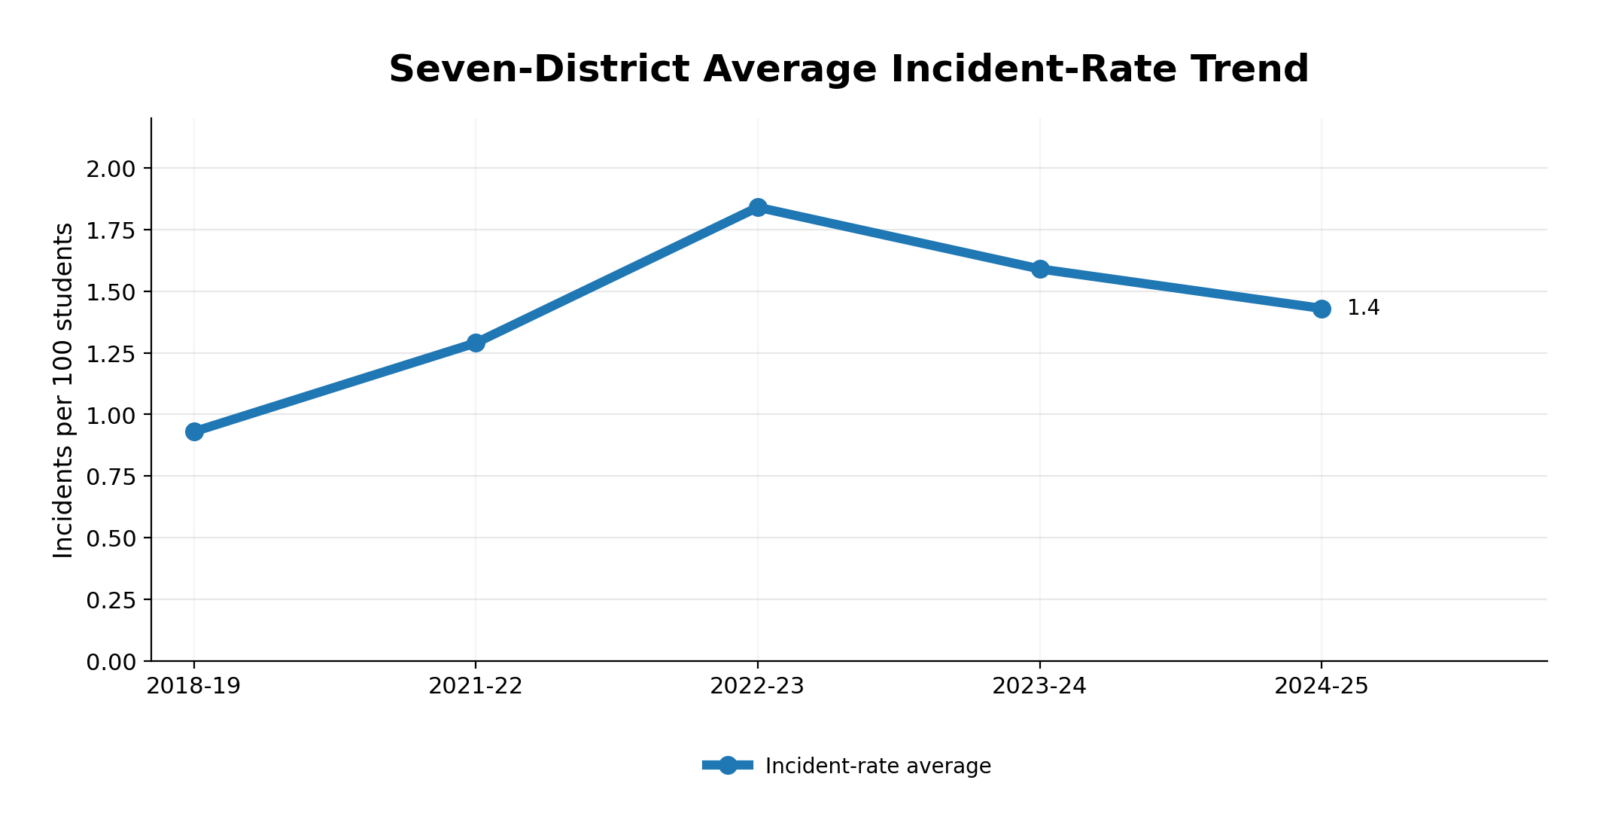
Disciplinary Issues
Incident rate average also stayed above the 18-19 level – 0.93 per 100 students in 18-19, peaking at 1.84 in 22-23, and landing on 1.43 in 24-25.
Violence, Vandalism, HIB and Substance Incidents 2024-25
Lower is better.
| Rank | District | 2024–25 Incidents per 100 |
|---|---|---|
| 1 | Millburn | 0.33 |
| 2 | New Providence | 0.57 |
| 3 | Chatham | 0.67 |
| 4 | Madison | 1.44 |
| 5 | Westfield | 1.50 |
| 6 | Summit | 2.74 |
| 7 | Berkeley Heights | 2.77 |
Explore the Full District Comparison
This article is part of NJ21st’s seven-district school performance series, reviewing Berkeley Heights, New Providence, Summit, Westfield, Chatham, Madison, and Millburn using the latest state performance data.

Related Articles

Commentary: My Kids Are Grown. I Still Watch the School Board and So Should You.

No Votes, No Edits: BHPSNJ Finalizes Plan Despite Public Critique Over Lack of Substance and Questions on Declining Enrollment